Syllabus Edition

First teaching 2023

First exams 2025

|

Emission & Absorption Spectrum (SL IB Physics)

Revision Note

Test Yourself
Katie M

Author

Katie M

Expertise

Physics

Spectra & Atomic Energy Levels

Emission Spectra

  • When an electron transitions from a higher energy level to a lower energy level, this results in the emission of a photon
    • Each transition corresponds to a specific wavelength of light which correlates to an observable spectral line
  • The resulting emission spectrum contains a set of discrete wavelengths, represented by coloured lines on a black background
  • Each emitted photon has a wavelength which is associated with a discrete change in energy

hydrogen-emission-spectra

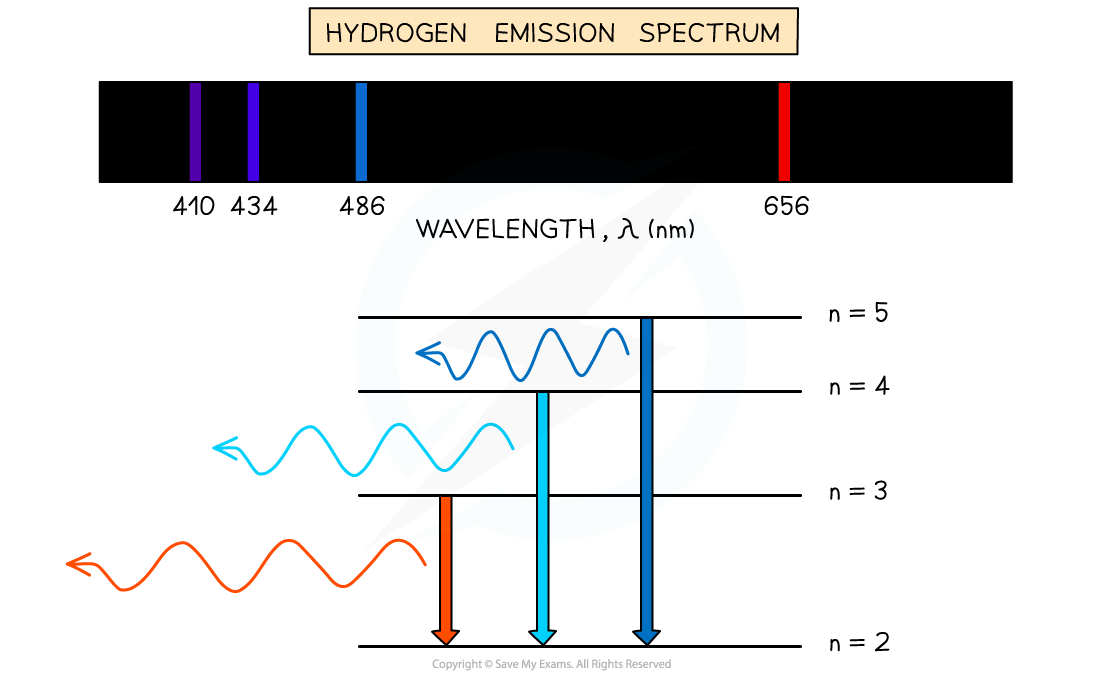
Emission spectrum of hydrogen gas

Absorption Spectra

  • An atom can be raised to an excited state by the absorption of a photon
  • When white light passes through one side of a cool, low-pressure gas it is found that certain wavelengths of light are missing when detected out the other side
    • This type of spectrum is called an absorption spectrum
  • An absorption spectrum consists of a continuous spectrum of all wavelengths (i.e. white light) with dark lines where specific wavelengths have been absorbed by the gas
    • These dark lines correspond exactly to the differences in energy levels in an atom
  • When electrons return to lower energy levels, the photons are emitted in all directions, rather than in the original direction of the white light
    • Therefore, some wavelengths appear to be missing
  • The wavelengths missing from an absorption spectrum correspond to the coloured lines on an emission spectrum for the same element

hydrogen-absorption-spectra

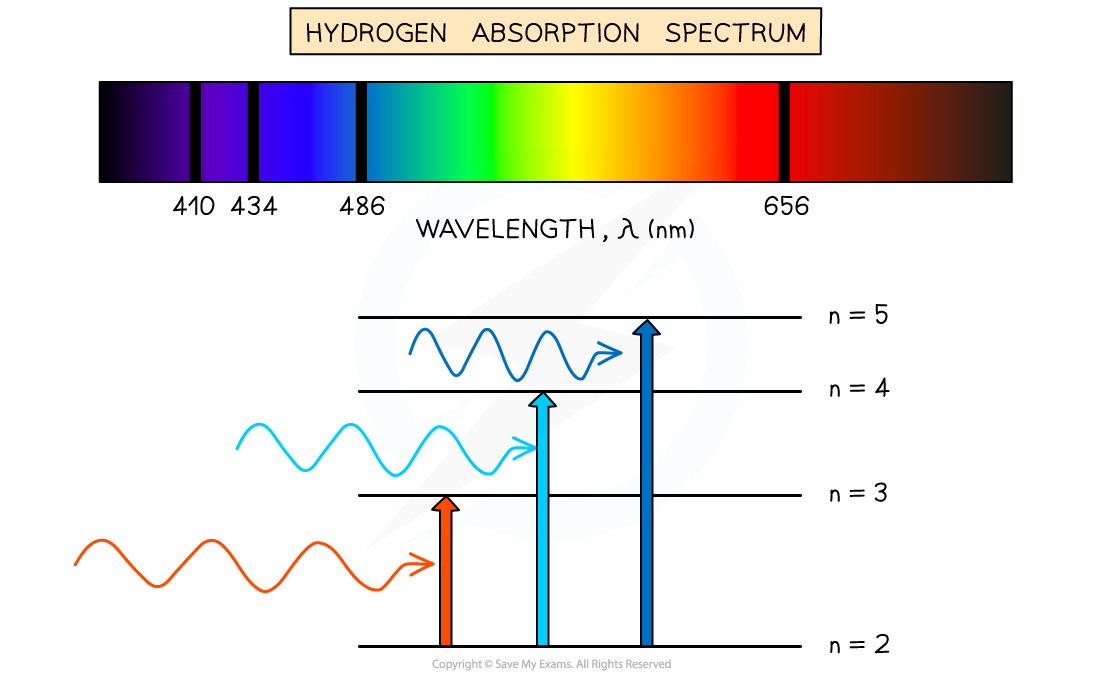
Absorption spectrum of hydrogen gas

Spectra & Chemical Composition

  • The chemical composition of a substance can be investigated using emission and absorption spectra
  • Each element produces a unique set of spectral lines
  • No two elements emit the same set of spectral lines, therefore, elements can be identified by their line spectrum

Reference-Spectra

Emission line spectra are unique to each element, like a fingerprint

  • For example:
    • Hydrogen is known to produce strong spectral lines in the red portion of the visible spectrum, at 656 nm
    • When sodium is burned, a characteristic yellow flame is observed due to it producing strong spectral lines in the yellow portion of the spectrum, at 589 nm
    • When mercury is burned, most of the emission lines are below 450 nm, which produces a characteristic blue light
  • Elements such as sodium and mercury are known for their use in street lights, as well as neon for its use in colourful signs
  • This can be achieved when
    • An electrical discharge is applied to the vapourised substance
    • The energy supplied excites orbital electrons within individual atoms to a higher energy state
    • When the electrons move back down to the ground state, a specific wavelength of light is emitted 

You've read 0 of your 0 free revision notes

Get unlimited access

to absolutely everything:

  • Downloadable PDFs
  • Unlimited Revision Notes
  • Topic Questions
  • Past Papers
  • Model Answers
  • Videos (Maths and Science)

Join the 100,000+ Students that ❤️ Save My Exams

the (exam) results speak for themselves:

Did this page help you?

Katie M

Author: Katie M

Katie has always been passionate about the sciences, and completed a degree in Astrophysics at Sheffield University. She decided that she wanted to inspire other young people, so moved to Bristol to complete a PGCE in Secondary Science. She particularly loves creating fun and absorbing materials to help students achieve their exam potential.