
Emission & Absorption Spectra in Stars
Types of Spectra
- There are three types of light spectra:
- Continuous emission spectra
- Emission line spectra
- Absorption line spectra
Continuous Spectra
- In a continuous spectrum, photons emitted from the core of a star contain all the wavelengths and frequencies of the electromagnetic spectrum
- Continuous spectra are produced from hot, dense sources, such as the cores of stars
Emission Spectra
- When an electron transitions from a higher energy level to a lower energy level, this results in the emission of a photon
- Each transition corresponds to a different wavelength of light and this corresponds to a line in the spectrum
- The resulting emission spectrum contains a set of discrete wavelengths represented by coloured lines on a black background
- Emission line spectra are produced by hot, low-pressure gases
Absorption Spectra
- An atom can be raised to an excited state by the absorption of a photon
- Absorption spectra are observed when white light passes through a cool, low-pressure gas
- Some wavelengths appear to be missing in an absorption spectrum which correspond to the lines in the emission spectra of the same element
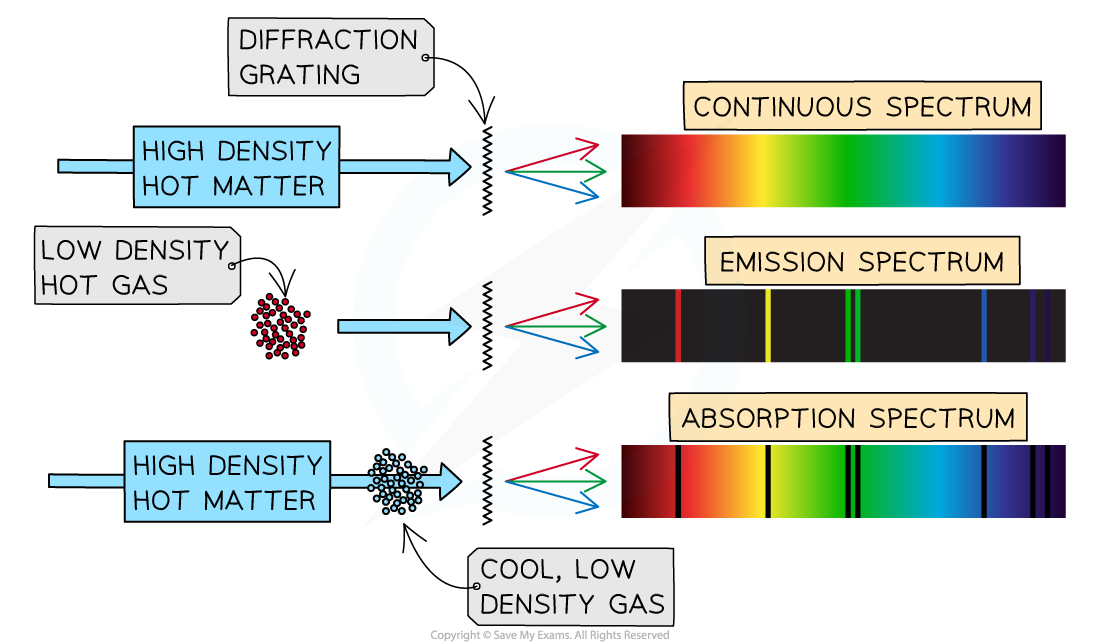
An absorption spectrum is the combination of an emission spectrum on top of a continuous spectrum
Chemical Composition of Stars
- Stellar spectral lines are caused by the interactions between photons and the atoms present in gaseous layers of stars
- Photons produced by fusion reactions in a star’s core move towards the layers of gas in the outer atmosphere of the star
- The photons produced in the core form a continuous spectrum
- Photons are absorbed by the gas atoms, which excite and re-emit other photons of various frequencies in random directions
- The light from a star can be analysed using spectroscopy
- The atmospheres of stars are not hot enough to produce an emission line spectrum
- Therefore, stars are found to emit an absorption line spectrum

An absorption line will appear in a spectrum if an absorbing material is placed between a source and the observer
- An absorption line spectrum is the equivalent of an emission line spectrum but it is made of dark lines on top of a continuous spectrum
- The dark lines represent the frequencies or wavelengths that are absorbed by a medium, such as a gas, when light passes through it
- The absorption spectral lines represent the energy that has been absorbed by electrons in the outer atmosphere of the star
- Each gas produces a unique pattern of spectral lines due to the specific transition between the element’s energy levels
- The presence of spectral lines in a star’s absorption spectrum act as fingerprints
- They can be used to determine the presence of a certain element within the star
- The chemical composition of a star can be investigated even when extremely distant
- If the element is present in the star, its characteristic pattern of spectral lines will appear as dark lines in the absorption line spectrum of the star
- The Sun is predominantly made up of hydrogen and helium gas
- The chemical composition of the Sun can be verified using the emission line spectra of the two gases compared with the absorption line spectrum of the Sun
- For example, the hydrogen emission line spectrum includes lines at:
- 2 nm, 486.3 nm and 656.5 nm
- While helium spectrum includes lines at:
- 7 nm and 587.7 nm
- The same wavelengths can be seen as dark lines on top of the Sun’s continuous spectrum
Surface Temperature of Stars
- The spectra of stars consist of a wide distribution of wavelengths
- Each wavelength of radiation has a different intensity
- The peak wavelength refers to the wavelength with the highest intensity

The colour of a star correlates to its temperature
- Stars are the closest approximation to black-body radiators that exist
- Therefore, the colour of a star i.e. its peak emission wavelength, can be attributed to its temperature according to Wien's law, where:
- A shorter peak wavelength corresponds to a higher temperature at the peak intensity, so hotter stars tend to be white or blue
- A longer peak wavelength corresponds to a lower temperature at the peak intensity, so cooler stars tend to be red or yellow

The intensity-wavelength graph shows how thermodynamic temperature links to the peak wavelength for four different stars
Worked example
Explain why:
Answer:
(a) Hot, dense sources, such as the cores of stars, produce continuous spectra because:
- In a hot, dense material, the atoms or molecules are so close together that they interact with one another
- This leads to a spread of energy states that are not clearly defined
- Therefore, photons of all frequencies are emitted leading to an uninterrupted band of colour
(b) Hot, low pressure gases produce emission line spectra, because:
- Hot gases produce emission line spectra when photons are emitted due to the transition of electrons
between discrete energy levels in atoms of the gas - The line spectrum has certain, fixed frequencies related to the differences in energy between the various energy levels of the atoms of the gas
- In a low pressure gas, the atoms or molecules are not close together
- This means the energy levels of the gas atoms or molecules are clearly quantised and well-defined
- Therefore, only photons which correspond to the differences in energy between the energy levels of a bound electron are seen
(c) Hot, dense sources observed through cold gases produce absorption spectra because:
- Atoms of different elements in the cold gas absorb energy emitted from the hot source but only at particular energy values
- These particular energy values correspond to the differences in energy between the energy levels of a bound electron
- This means that particular frequencies of light are absorbed, creating black lines in the continuous emission spectrum
Exam Tip
Given an absorption line spectrum for a specific star, you can be asked to identify a star of similar chemical composition. It is important to pay attention to the spacing between the lines to be able to correctly identify the most similar star to the given one.
