
Speed of Nerve Impulses
Comparing the speed of transmission
- There are well documented correlations between specific structural features of neurones and the speed of transmission
- Two key features that should be considered include
- Myelination of the neurone
- Myelinated neurones conduct electrical impulses much more quickly than unmyelinated fibres
- This is because of the insulation offered by the myelin sheath which allows faster saltatory conduction along the neurone
- Diameter of the neuron
- An axon with a wider diameter conducts an electrical impulse more quickly than a narrow axon
- This is because a wider axon offers less resistance to the action potential
- Myelination of the neurone
- Squid have giant axons which are unmyelinated and can be up to 1 mm wide, whereas the average diameter of a human neurone is somewhere between 4 and 100 µm
- The graph shows the relationship between axon diameter and speed of transmission in a giant unmyelinated axon from a squid and a 'normal' sized myelinated axon of a mammal
- Despite the axon being significantly wider, the speed of transmission is much faster in the axon which is insulated by a myelin sheath
Comparing Speed of Nerve Transmission Graph

Unmyelinated axons have a much slower speed of conduction compared to a myelinated axon
Myelination
- Neurones have a main, long, fibre known as an axon
- The axons of neurones are surrounded by specialised cells called Schwann cells
- Schwann cells wrap themselves around the axon, forming a structure known as a myelin sheath
- Myelin contains the phospholipids of the Schwann cell membranes; it is built up in layers as the Schwann cells grow around the axon
- The lipid content of the myelin sheath gives it a high electrical resistance
- The myelin sheath acts as an electrical insulator; impulses cannot pass through the myelin sheath
- The myelin sheath has small, uninsulated sections in the gaps between the individual Schwann cells
- These gaps are called nodes of Ranvier
- Electrical impulses effectively jump from one node of Ranvier to the next
- This process is known as saltatory conduction
- It greatly speeds up the rate of transmission of impulses along myelinated neurones
- In non-myelinated neurones the axon is not insulated by myelin, so the impulse travels more slowly
Diagram to show the myelination of neurones
An impulse travels down a neurone via saltatory conduction
Describing a correlation using a correlation coefficient
- When studying the relationship between two variables such as diameter or myelination and speed of transmission, it is important to collect data which allows us to analyse the strength of the correlation
- Correlation is an association or relationship between variables
- There is a clear distinction between correlation and causation: a correlation does not necessarily imply a causative relationship
- Causation occurs when one variable has an influence or is influenced by, another
- For the variables discussed here:
- There may be a correlation between diameter of a neurone and the speed of impulse conduction
- There may be a correlation between the myelination of a neurone and speed of impulse conduction
- The apparent correlation between variables can be analysed using scatter graphs and different statistical tests
Correlation between variables
- In order to get a broad overview of the correlation between two variables the data points for both variables can be plotted on a scatter graph
- The correlation coefficient (r) indicates the strength of the relationship between variables
- Perfect correlation occurs when all of the data points lie on a straight line with a correlation coefficient of 1 or -1
- Correlation can be positive or negative
- Positive correlation: as variable A increases, variable B increases
- Negative correlation: as variable A increases, variable B decreases
- If there is no correlation between variables the correlation coefficient will be 0
Correlation in Data Graphs
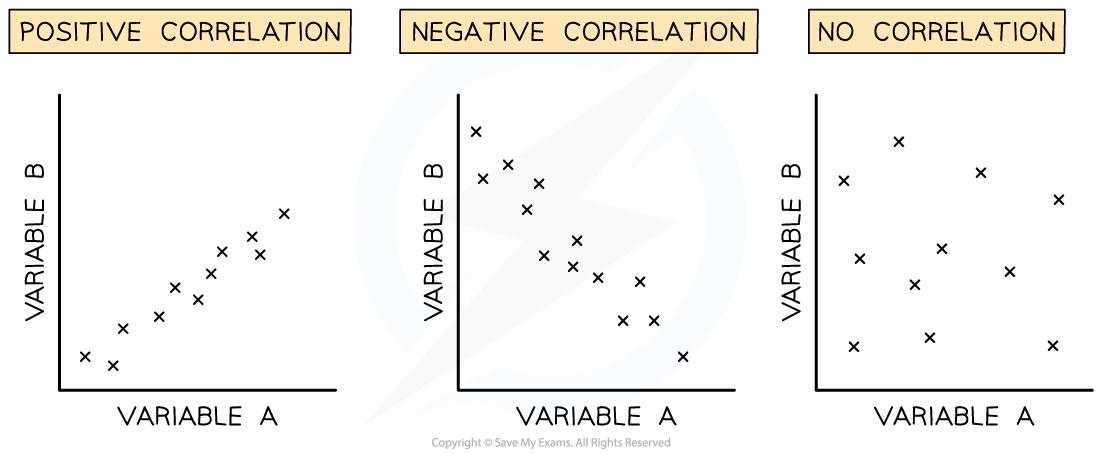
Different types of correlation in scatter graphs
- The correlation coefficient (R) can be calculated to determine whether a linear relationship exists between variables and how strong that relationship is
- The coefficient of determination (R2) can then be calculated to test the strength of the association between the variables
Pearson's linear correlation
- Pearson's linear correlation is a statistical test that determines whether there is linear correlation between two variables
- The data must:
- Be quantitative
- Show normal distribution
- Method:
-
- Step 1: Create a scatter graph of data gathered and identify if a linear correlation exists
- Step 2: State a null hypthessis
- Step 3: Use the following equation to work out Pearson’s correlation coefficient r
-
- If the correlation coefficient r is close to 1 or -1 or the then it can be stated that there is a strong linear correlation between the two variables and the null hypothesis can be rejected
R = n format('truetype')%3Bfont-weight%3Anormal%3Bfont-style%3Anormal%3B%7D%40font-face%7Bfont-family%3A'brack_sm4e06b854ad106cdec1d8cc9'%3Bsrc%3Aurl(data%3Afont%2Ftruetype%3Bcharset%3Dutf-8%3Bbase64%2CAAEAAAAMAIAAAwBAT1MvMi7PH4UAAADMAAAATmNtYXA3kjw6AAABHAAAAFxjdnQgAQYDiAAAAXgAAAASZ2x5ZkyYQ7YAAAGMAAABqmhlYWQLyR8fAAADOAAAADZoaGVhAq0XCAAAA3AAAAAkaG10eDEjA%2FUAAAOUAAAAHGxvY2EAAEKZAAADsAAAACBtYXhwBJsEcQAAA9AAAAAgbmFtZW7QvZAAAAPwAAAB5XBvc3QArQBVAAAF2AAAACBwcmVwu5WEAAAABfgAAAAHAAACDAGQAAUAAAQABAAAAAAABAAEAAAAAAAAAQEAAAAAAAAAAAAAAAAAAAAAAAAAAAAAAAAAAAAAACAgICAAAAAg9AMD%2FP%2F8AAABVAABAAAAAAACAAEAAQAAABQAAwABAAAAFAAEAEgAAAAOAAgAAgAGI6EjoiOjI6QjpSOm%2F%2F8AACOhI6IjoyOkI6Ujpv%2F%2F3GDcYNxg3GDcYNxgAAEAAAAAAAAAAAAAAAAAAAAAAVQAVAEAACsAjACAAKgABwAAAAIAAAAAANUBAQADAAcAADEzESMXIzUz1dWrgIABAdarAAEAAAAAAQABVAAFACkYAbAGELAA1LAAELAF1LAFELAD1ACwBhCwANSwABCwA9SwAxCwAdQwMTERIRUjFQEAqwFUVf8AAQAAAAAAVQFUAAMAIRgBsAEvsQcCPDyxAwL1sAA8ALEDAD%2BwAjx8sQAG9bABPBEzESNVVQFU%2FqwAAQAAAAABAAFUAAUAKRgBsAYQsADUsAAQsAXUsAUQsAPUALAGELAA1LAAELAD1LADELAB1DAxGQEhNSM1AQCrAVT%2BrFX%2FAAEAAAAAAQABVAAFACkYAbAGELAB1LABELAA1LAAELAE1ACwBhCwAdSwARCwBNSwBBCwAtQwMTsBESEVM6tV%2FwCrAVRVAAEAqgAAAQABVAADACEYAbABL7EHAjw8sQMC9bAAPACxAwA%2FsAI8fLEABvWwATwTMxEjqlZWAVT%2BrAABAAAAAAEAAVQABQApGAGwBhCwAdSwARCwANSwABCwBNQAsAYQsAHUsAEQsATUsAQQsALUMDETMxEhNTOrVf8AqwFU%2FqxVAAAAAQAAAAEAAIsesexfDzz1AAMEAP%2F%2F%2F%2F%2FVre5k%2F%2F%2F%2F%2F9Wt7mT%2FgP%2F%2FAdYBWAAAAAoAAgABAAAAAAABAAABVP%2F%2FAAAXcP%2BA%2F4AB1gABAAAAAAAAAAAAAAAAAAAABwDVAAABAAAAAQAAAAEAAAABAAAAAQAAqgEAAAAAAAAAAAAAIQAAAGUAAACeAAAA5AAAASkAAAFjAAABqgABAAAABwAKAAIAAAAAAAIAgAQAAAAAAAQAAGUAAAAAAAAAFQECAAAAAAAAAAEAJgAAAAAAAAAAAAIADgAmAAAAAAAAAAMARAA0AAAAAAAAAAQAJgB4AAAAAAAAAAUAFgCeAAAAAAAAAAYAEwC0AAAAAAAAAAgAHADHAAEAAAAAAAEAJgAAAAEAAAAAAAIADgAmAAEAAAAAAAMARAA0AAEAAAAAAAQAJgB4AAEAAAAAAAUAFgCeAAEAAAAAAAYAEwC0AAEAAAAAAAgAHADHAAMAAQQJAAEAJgAAAAMAAQQJAAIADgAmAAMAAQQJAAMARAA0AAMAAQQJAAQAJgB4AAMAAQQJAAUAFgCeAAMAAQQJAAYAEwC0AAMAAQQJAAgAHADHAEIAcgBhAGMAawBlAHQAcwAgAHMAbQBhAGwAbAAgAHMAaQB6AGUAUgBlAGcAdQBsAGEAcgBNAGEAdABoAHMAIABGAG8AcgAgAE0AbwByAGUAIABCAHIAYQBjAGsAZQB0AHMAIABzAG0AYQBsAGwAIABzAGkAegBlAEIAcgBhAGMAawBlAHQAcwAgAHMAbQBhAGwAbAAgAHMAaQB6AGUAVgBlAHIAcwBpAG8AbgAgADIALgAwQnJhY2tldHNfc21hbGxfc2l6ZQBNAGEAdABoAHMAIABGAG8AcgAgAE0AbwByAGUAAAAAAwAAAAAAAACqAFUAAAAAAAAAAAAAAAAAAAAAAAAAALkH%2FwACjYUA)format('truetype')%3Bfont-weight%3Anormal%3Bfont-style%3Anormal%3B%7D%40font-face%7Bfont-family%3A'round_brackets18549f92a457f2409'%3Bsrc%3Aurl(data%3Afont%2Ftruetype%3Bcharset%3Dutf-8%3Bbase64%2CAAEAAAAMAIAAAwBAT1MvMjwHLFQAAADMAAAATmNtYXDf7xCrAAABHAAAADxjdnQgBAkDLgAAAVgAAAASZ2x5ZmAOz2cAAAFsAAABJGhlYWQOKih8AAACkAAAADZoaGVhCvgVwgAAAsgAAAAkaG10eCA6AAIAAALsAAAADGxvY2EAAARLAAAC%2BAAAABBtYXhwBIgEWQAAAwgAAAAgbmFtZXHR30MAAAMoAAACOXBvc3QDogHPAAAFZAAAACBwcmVwupWEAAAABYQAAAAHAAAGcgGQAAUAAAgACAAAAAAACAAIAAAAAAAAAQIAAAAAAAAAAAAAAAAAAAAAAAAAAAAAAAAAAAAAACAgICAAAAAo8AMGe%2F57AAAHPgGyAAAAAAACAAEAAQAAABQAAwABAAAAFAAEACgAAAAGAAQAAQACACgAKf%2F%2FAAAAKAAp%2F%2F%2F%2F2f%2FZAAEAAAAAAAAAAAFUAFYBAAAsAKgDgAAyAAcAAAACAAAAKgDVA1UAAwAHAAA1MxEjEyMRM9XVq4CAKgMr%2FQAC1QABAAD%2B0AIgBtAACQBNGAGwChCwA9SwAxCwAtSwChCwBdSwBRCwANSwAxCwBzywAhCwCDwAsAoQsAPUsAMQsAfUsAoQsAXUsAoQsADUsAMQsAI8sAcQsAg8MTAREAEzABEQASMAAZCQ%2FnABkJD%2BcALQ%2FZD%2BcAGQAnACcAGQ%2FnAAAQAA%2FtACIAbQAAkATRgBsAoQsAPUsAMQsALUsAoQsAXUsAUQsADUsAMQsAc8sAIQsAg8ALAKELAD1LADELAH1LAKELAF1LAKELAA1LADELACPLAHELAIPDEwARABIwAREAEzAAIg%2FnCQAZD%2BcJABkALQ%2FZD%2BcAGQAnACcAGQ%2FnAAAQAAAAEAAPW2NYFfDzz1AAMIAP%2F%2F%2F%2F%2FVre7u%2F%2F%2F%2F%2F9Wt7u4AAP7QA7cG0AAAAAoAAgABAAAAAAABAAAHPv5OAAAXcAAA%2F%2F4DtwABAAAAAAAAAAAAAAAAAAAAAwDVAAACIAAAAiAAAAAAAAAAAAAkAAAAowAAASQAAQAAAAMACgACAAAAAAACAIAEAAAAAAAEAABNAAAAAAAAABUBAgAAAAAAAAABAD4AAAAAAAAAAAACAA4APgAAAAAAAAADAFwATAAAAAAAAAAEAD4AqAAAAAAAAAAFABYA5gAAAAAAAAAGAB8A%2FAAAAAAAAAAIABwBGwABAAAAAAABAD4AAAABAAAAAAACAA4APgABAAAAAAADAFwATAABAAAAAAAEAD4AqAABAAAAAAAFABYA5gABAAAAAAAGAB8A%2FAABAAAAAAAIABwBGwADAAEECQABAD4AAAADAAEECQACAA4APgADAAEECQADAFwATAADAAEECQAEAD4AqAADAAEECQAFABYA5gADAAEECQAGAB8A%2FAADAAEECQAIABwBGwBSAG8AdQBuAGQAIABiAHIAYQBjAGsAZQB0AHMAIAB3AGkAdABoACAAYQBzAGMAZQBuAHQAIAAxADgANQA0AFIAZQBnAHUAbABhAHIATQBhAHQAaABzACAARgBvAHIAIABNAG8AcgBlACAAUgBvAHUAbgBkACAAYgByAGEAYwBrAGUAdABzACAAdwBpAHQAaAAgAGEAcwBjAGUAbgB0ACAAMQA4ADUANABSAG8AdQBuAGQAIABiAHIAYQBjAGsAZQB0AHMAIAB3AGkAdABoACAAYQBzAGMAZQBuAHQAIAAxADgANQA0AFYAZQByAHMAaQBvAG4AIAAyAC4AMFJvdW5kX2JyYWNrZXRzX3dpdGhfYXNjZW50XzE4NTQATQBhAHQAaABzACAARgBvAHIAIABNAG8AcgBlAAAAAAMAAAAAAAADnwHPAAAAAAAAAAAAAAAAAAAAAAAAAAC5B%2F8AAY2FAA%3D%3D)format('truetype')%3Bfont-weight%3Anormal%3Bfont-style%3Anormal%3B%7D%3C%2Fstyle%3E%3C%2Fdefs%3E%3Cline%20stroke%3D%22%23000000%22%20stroke-linecap%3D%22square%22%20stroke-width%3D%221%22%20x1%3D%222.5%22%20x2%3D%22201.5%22%20y1%3D%2219.5%22%20y2%3D%2219.5%22%2F%3E%3Ctext%20font-family%3D%22Arial%22%20font-size%3D%2214%22%20font-style%3D%22italic%22%20text-anchor%3D%22middle%22%20x%3D%2251.5%22%20y%3D%2214%22%3En%3C%2Ftext%3E%3Ctext%20font-family%3D%22round_brackets18549f92a457f2409%22%20font-size%3D%2214%22%20text-anchor%3D%22middle%22%20x%3D%2259.5%22%20y%3D%2214%22%3E(%3C%2Ftext%3E%3Ctext%20font-family%3D%22round_brackets18549f92a457f2409%22%20font-size%3D%2214%22%20text-anchor%3D%22middle%22%20x%3D%2287.5%22%20y%3D%2214%22%3E)%3C%2Ftext%3E%3Ctext%20font-family%3D%22Arial%22%20font-size%3D%2214%22%20font-style%3D%22italic%22%20text-anchor%3D%22middle%22%20x%3D%2265.5%22%20y%3D%2214%22%3E%26%23x3A3%3B%3C%2Ftext%3E%3Ctext%20font-family%3D%22Arial%22%20font-size%3D%2214%22%20font-style%3D%22italic%22%20text-anchor%3D%22middle%22%20x%3D%2273.5%22%20y%3D%2214%22%3Ex%3C%2Ftext%3E%3Ctext%20font-family%3D%22Arial%22%20font-size%3D%2214%22%20font-style%3D%22italic%22%20text-anchor%3D%22middle%22%20x%3D%2280.5%22%20y%3D%2214%22%3Ey%3C%2Ftext%3E%3Ctext%20font-family%3D%22math1da40657c9fece7e48d30af42d3%22%20font-size%3D%2214%22%20text-anchor%3D%22middle%22%20x%3D%2297.5%22%20y%3D%2214%22%3E%26%23x2212%3B%3C%2Ftext%3E%3Ctext%20font-family%3D%22round_brackets18549f92a457f2409%22%20font-size%3D%2214%22%20text-anchor%3D%22middle%22%20x%3D%22107.5%22%20y%3D%2214%22%3E(%3C%2Ftext%3E%3Ctext%20font-family%3D%22round_brackets18549f92a457f2409%22%20font-size%3D%2214%22%20text-anchor%3D%22middle%22%20x%3D%22128.5%22%20y%3D%2214%22%3E)%3C%2Ftext%3E%3Ctext%20font-family%3D%22Arial%22%20font-size%3D%2214%22%20font-style%3D%22italic%22%20text-anchor%3D%22middle%22%20x%3D%22113.5%22%20y%3D%2214%22%3E%26%23x3A3%3B%3C%2Ftext%3E%3Ctext%20font-family%3D%22Arial%22%20font-size%3D%2214%22%20font-style%3D%22italic%22%20text-anchor%3D%22middle%22%20x%3D%22121.5%22%20y%3D%2214%22%3Ex%3C%2Ftext%3E%3Ctext%20font-family%3D%22round_brackets18549f92a457f2409%22%20font-size%3D%2214%22%20text-anchor%3D%22middle%22%20x%3D%22134.5%22%20y%3D%2214%22%3E(%3C%2Ftext%3E%3Ctext%20font-family%3D%22round_brackets18549f92a457f2409%22%20font-size%3D%2214%22%20text-anchor%3D%22middle%22%20x%3D%22155.5%22%20y%3D%2214%22%3E)%3C%2Ftext%3E%3Ctext%20font-family%3D%22Arial%22%20font-size%3D%2214%22%20font-style%3D%22italic%22%20text-anchor%3D%22middle%22%20x%3D%22140.5%22%20y%3D%2214%22%3E%26%23x3A3%3B%3C%2Ftext%3E%3Ctext%20font-family%3D%22Arial%22%20font-size%3D%2214%22%20font-style%3D%22italic%22%20text-anchor%3D%22middle%22%20x%3D%22148.5%22%20y%3D%2214%22%3Ey%3C%2Ftext%3E%3Cpolyline%20fill%3D%22none%22%20points%3D%229%2C-16%209%2C-16%204%2C0%201%2C-6%22%20stroke%3D%22%23000000%22%20stroke-linecap%3D%22square%22%20stroke-width%3D%221%22%20transform%3D%22translate(3.5%2C41.5)%22%2F%3E%3Cpolyline%20fill%3D%22none%22%20points%3D%224%2C0%201%2C-6%200%2C-5%22%20stroke%3D%22%23000000%22%20stroke-linecap%3D%22square%22%20stroke-width%3D%221%22%20transform%3D%22translate(3.5%2C41.5)%22%2F%3E%3Cline%20stroke%3D%22%23000000%22%20stroke-linecap%3D%22square%22%20stroke-width%3D%221%22%20x1%3D%2213.5%22%20x2%3D%22200.5%22%20y1%3D%2225.5%22%20y2%3D%2225.5%22%2F%3E%3Ctext%20font-family%3D%22brack_sm4e06b854ad106cdec1d8cc9%22%20font-size%3D%2214%22%20text-anchor%3D%22start%22%20x%3D%2216.5%22%20y%3D%2232%22%3E%26%23x23A1%3B%3C%2Ftext%3E%3Ctext%20font-family%3D%22brack_sm4e06b854ad106cdec1d8cc9%22%20font-size%3D%2214%22%20text-anchor%3D%22start%22%20x%3D%2216.5%22%20y%3D%2237%22%3E%26%23x23A2%3B%3C%2Ftext%3E%3Ctext%20font-family%3D%22brack_sm4e06b854ad106cdec1d8cc9%22%20font-size%3D%2214%22%20text-anchor%3D%22start%22%20x%3D%2216.5%22%20y%3D%2242%22%3E%26%23x23A3%3B%3C%2Ftext%3E%3Ctext%20font-family%3D%22brack_sm4e06b854ad106cdec1d8cc9%22%20font-size%3D%2214%22%20text-anchor%3D%22start%22%20x%3D%22100.5%22%20y%3D%2232%22%3E%26%23x23A4%3B%3C%2Ftext%3E%3Ctext%20font-family%3D%22brack_sm4e06b854ad106cdec1d8cc9%22%20font-size%3D%2214%22%20text-anchor%3D%22start%22%20x%3D%22100.5%22%20y%3D%2237%22%3E%26%23x23A5%3B%3C%2Ftext%3E%3Ctext%20font-family%3D%22brack_sm4e06b854ad106cdec1d8cc9%22%20font-size%3D%2214%22%20text-anchor%3D%22start%22%20x%3D%22100.5%22%20y%3D%2242%22%3E%26%23x23A6%3B%3C%2Ftext%3E%3Ctext%20font-family%3D%22Arial%22%20font-size%3D%2214%22%20font-style%3D%22italic%22%20text-anchor%3D%22middle%22%20x%3D%2225.5%22%20y%3D%2240%22%3En%3C%2Ftext%3E%3Ctext%20font-family%3D%22Arial%22%20font-size%3D%2214%22%20font-style%3D%22italic%22%20text-anchor%3D%22middle%22%20x%3D%2233.5%22%20y%3D%2240%22%3E%26%23x3A3%3B%3C%2Ftext%3E%3Ctext%20font-family%3D%22Arial%22%20font-size%3D%2214%22%20font-style%3D%22italic%22%20text-anchor%3D%22middle%22%20x%3D%2241.5%22%20y%3D%2240%22%3Ex%3C%2Ftext%3E%3Ctext%20font-family%3D%22Arial%22%20font-size%3D%2210%22%20text-anchor%3D%22middle%22%20x%3D%2249.5%22%20y%3D%2234%22%3E2%3C%2Ftext%3E%3Ctext%20font-family%3D%22math1da40657c9fece7e48d30af42d3%22%20font-size%3D%2214%22%20text-anchor%3D%22middle%22%20x%3D%2259.5%22%20y%3D%2240%22%3E%26%23x2212%3B%3C%2Ftext%3E%3Ctext%20font-family%3D%22round_brackets18549f92a457f2409%22%20font-size%3D%2214%22%20text-anchor%3D%22middle%22%20x%3D%2269.5%22%20y%3D%2240%22%3E(%3C%2Ftext%3E%3Ctext%20font-family%3D%22round_brackets18549f92a457f2409%22%20font-size%3D%2214%22%20text-anchor%3D%22middle%22%20x%3D%2290.5%22%20y%3D%2240%22%3E)%3C%2Ftext%3E%3Ctext%20font-family%3D%22Arial%22%20font-size%3D%2214%22%20font-style%3D%22italic%22%20text-anchor%3D%22middle%22%20x%3D%2275.5%22%20y%3D%2240%22%3E%26%23x3A3%3B%3C%2Ftext%3E%3Ctext%20font-family%3D%22Arial%22%20font-size%3D%2214%22%20font-style%3D%22italic%22%20text-anchor%3D%22middle%22%20x%3D%2283.5%22%20y%3D%2240%22%3Ex%3C%2Ftext%3E%3Ctext%20font-family%3D%22Arial%22%20font-size%3D%2210%22%20text-anchor%3D%22middle%22%20x%3D%2296.5%22%20y%3D%2234%22%3E2%3C%2Ftext%3E%3Ctext%20font-family%3D%22brack_sm4e06b854ad106cdec1d8cc9%22%20font-size%3D%2214%22%20text-anchor%3D%22start%22%20x%3D%22110.5%22%20y%3D%2232%22%3E%26%23x23A1%3B%3C%2Ftext%3E%3Ctext%20font-family%3D%22brack_sm4e06b854ad106cdec1d8cc9%22%20font-size%3D%2214%22%20text-anchor%3D%22start%22%20x%3D%22110.5%22%20y%3D%2237%22%3E%26%23x23A2%3B%3C%2Ftext%3E%3Ctext%20font-family%3D%22brack_sm4e06b854ad106cdec1d8cc9%22%20font-size%3D%2214%22%20text-anchor%3D%22start%22%20x%3D%22110.5%22%20y%3D%2242%22%3E%26%23x23A3%3B%3C%2Ftext%3E%3Ctext%20font-family%3D%22brack_sm4e06b854ad106cdec1d8cc9%22%20font-size%3D%2214%22%20text-anchor%3D%22start%22%20x%3D%22194.5%22%20y%3D%2232%22%3E%26%23x23A4%3B%3C%2Ftext%3E%3Ctext%20font-family%3D%22brack_sm4e06b854ad106cdec1d8cc9%22%20font-size%3D%2214%22%20text-anchor%3D%22start%22%20x%3D%22194.5%22%20y%3D%2237%22%3E%26%23x23A5%3B%3C%2Ftext%3E%3Ctext%20font-family%3D%22brack_sm4e06b854ad106cdec1d8cc9%22%20font-size%3D%2214%22%20text-anchor%3D%22start%22%20x%3D%22194.5%22%20y%3D%2242%22%3E%26%23x23A6%3B%3C%2Ftext%3E%3Ctext%20font-family%3D%22Arial%22%20font-size%3D%2214%22%20font-style%3D%22italic%22%20text-anchor%3D%22middle%22%20x%3D%22119.5%22%20y%3D%2240%22%3En%3C%2Ftext%3E%3Ctext%20font-family%3D%22Arial%22%20font-size%3D%2214%22%20font-style%3D%22italic%22%20text-anchor%3D%22middle%22%20x%3D%22127.5%22%20y%3D%2240%22%3E%26%23x3A3%3B%3C%2Ftext%3E%3Ctext%20font-family%3D%22Arial%22%20font-size%3D%2214%22%20font-style%3D%22italic%22%20text-anchor%3D%22middle%22%20x%3D%22135.5%22%20y%3D%2240%22%3Ey%3C%2Ftext%3E%3Ctext%20font-family%3D%22Arial%22%20font-size%3D%2210%22%20text-anchor%3D%22middle%22%20x%3D%22143.5%22%20y%3D%2234%22%3E2%3C%2Ftext%3E%3Ctext%20font-family%3D%22math1da40657c9fece7e48d30af42d3%22%20font-size%3D%2214%22%20text-anchor%3D%22middle%22%20x%3D%22153.5%22%20y%3D%2240%22%3E%26%23x2212%3B%3C%2Ftext%3E%3Ctext%20font-family%3D%22round_brackets18549f92a457f2409%22%20font-size%3D%2214%22%20text-anchor%3D%22middle%22%20x%3D%22163.5%22%20y%3D%2240%22%3E(%3C%2Ftext%3E%3Ctext%20font-family%3D%22round_brackets18549f92a457f2409%22%20font-size%3D%2214%22%20text-anchor%3D%22middle%22%20x%3D%22184.5%22%20y%3D%2240%22%3E)%3C%2Ftext%3E%3Ctext%20font-family%3D%22Arial%22%20font-size%3D%2214%22%20font-style%3D%22italic%22%20text-anchor%3D%22middle%22%20x%3D%22169.5%22%20y%3D%2240%22%3E%26%23x3A3%3B%3C%2Ftext%3E%3Ctext%20font-family%3D%22Arial%22%20font-size%3D%2214%22%20font-style%3D%22italic%22%20text-anchor%3D%22middle%22%20x%3D%22177.5%22%20y%3D%2240%22%3Ey%3C%2Ftext%3E%3Ctext%20font-family%3D%22Arial%22%20font-size%3D%2210%22%20text-anchor%3D%22middle%22%20x%3D%22190.5%22%20y%3D%2234%22%3E2%3C%2Ftext%3E%3C%2Fsvg%3E)
∑x = total of the first variable value
∑y = total of the second variable value
∑xy = sum of the product of the first and second value
∑x2 = sum of the squares of the first value
∑y2 = sum of the squares of the second value
The coefficient of determination
format('truetype')%3Bfont-weight%3Anormal%3Bfont-style%3Anormal%3B%7D%40font-face%7Bfont-family%3A'round_brackets18549f92a457f2409'%3Bsrc%3Aurl(data%3Afont%2Ftruetype%3Bcharset%3Dutf-8%3Bbase64%2CAAEAAAAMAIAAAwBAT1MvMjwHLFQAAADMAAAATmNtYXDf7xCrAAABHAAAADxjdnQgBAkDLgAAAVgAAAASZ2x5ZmAOz2cAAAFsAAABJGhlYWQOKih8AAACkAAAADZoaGVhCvgVwgAAAsgAAAAkaG10eCA6AAIAAALsAAAADGxvY2EAAARLAAAC%2BAAAABBtYXhwBIgEWQAAAwgAAAAgbmFtZXHR30MAAAMoAAACOXBvc3QDogHPAAAFZAAAACBwcmVwupWEAAAABYQAAAAHAAAGcgGQAAUAAAgACAAAAAAACAAIAAAAAAAAAQIAAAAAAAAAAAAAAAAAAAAAAAAAAAAAAAAAAAAAACAgICAAAAAo8AMGe%2F57AAAHPgGyAAAAAAACAAEAAQAAABQAAwABAAAAFAAEACgAAAAGAAQAAQACACgAKf%2F%2FAAAAKAAp%2F%2F%2F%2F2f%2FZAAEAAAAAAAAAAAFUAFYBAAAsAKgDgAAyAAcAAAACAAAAKgDVA1UAAwAHAAA1MxEjEyMRM9XVq4CAKgMr%2FQAC1QABAAD%2B0AIgBtAACQBNGAGwChCwA9SwAxCwAtSwChCwBdSwBRCwANSwAxCwBzywAhCwCDwAsAoQsAPUsAMQsAfUsAoQsAXUsAoQsADUsAMQsAI8sAcQsAg8MTAREAEzABEQASMAAZCQ%2FnABkJD%2BcALQ%2FZD%2BcAGQAnACcAGQ%2FnAAAQAA%2FtACIAbQAAkATRgBsAoQsAPUsAMQsALUsAoQsAXUsAUQsADUsAMQsAc8sAIQsAg8ALAKELAD1LADELAH1LAKELAF1LAKELAA1LADELACPLAHELAIPDEwARABIwAREAEzAAIg%2FnCQAZD%2BcJABkALQ%2FZD%2BcAGQAnACcAGQ%2FnAAAQAAAAEAAPW2NYFfDzz1AAMIAP%2F%2F%2F%2F%2FVre7u%2F%2F%2F%2F%2F9Wt7u4AAP7QA7cG0AAAAAoAAgABAAAAAAABAAAHPv5OAAAXcAAA%2F%2F4DtwABAAAAAAAAAAAAAAAAAAAAAwDVAAACIAAAAiAAAAAAAAAAAAAkAAAAowAAASQAAQAAAAMACgACAAAAAAACAIAEAAAAAAAEAABNAAAAAAAAABUBAgAAAAAAAAABAD4AAAAAAAAAAAACAA4APgAAAAAAAAADAFwATAAAAAAAAAAEAD4AqAAAAAAAAAAFABYA5gAAAAAAAAAGAB8A%2FAAAAAAAAAAIABwBGwABAAAAAAABAD4AAAABAAAAAAACAA4APgABAAAAAAADAFwATAABAAAAAAAEAD4AqAABAAAAAAAFABYA5gABAAAAAAAGAB8A%2FAABAAAAAAAIABwBGwADAAEECQABAD4AAAADAAEECQACAA4APgADAAEECQADAFwATAADAAEECQAEAD4AqAADAAEECQAFABYA5gADAAEECQAGAB8A%2FAADAAEECQAIABwBGwBSAG8AdQBuAGQAIABiAHIAYQBjAGsAZQB0AHMAIAB3AGkAdABoACAAYQBzAGMAZQBuAHQAIAAxADgANQA0AFIAZQBnAHUAbABhAHIATQBhAHQAaABzACAARgBvAHIAIABNAG8AcgBlACAAUgBvAHUAbgBkACAAYgByAGEAYwBrAGUAdABzACAAdwBpAHQAaAAgAGEAcwBjAGUAbgB0ACAAMQA4ADUANABSAG8AdQBuAGQAIABiAHIAYQBjAGsAZQB0AHMAIAB3AGkAdABoACAAYQBzAGMAZQBuAHQAIAAxADgANQA0AFYAZQByAHMAaQBvAG4AIAAyAC4AMFJvdW5kX2JyYWNrZXRzX3dpdGhfYXNjZW50XzE4NTQATQBhAHQAaABzACAARgBvAHIAIABNAG8AcgBlAAAAAAMAAAAAAAADnwHPAAAAAAAAAAAAAAAAAAAAAAAAAAC5B%2F8AAY2FAA%3D%3D)format('truetype')%3Bfont-weight%3Anormal%3Bfont-style%3Anormal%3B%7D%3C%2Fstyle%3E%3C%2Fdefs%3E%3Ctext%20font-family%3D%22Arial%22%20font-size%3D%2218%22%20text-anchor%3D%22middle%22%20x%3D%2215.5%22%20y%3D%2220%22%3EThe%3C%2Ftext%3E%3Ctext%20font-family%3D%22Arial%22%20font-size%3D%2218%22%20text-anchor%3D%22middle%22%20x%3D%2276.5%22%20y%3D%2220%22%3Ecoefficient%3C%2Ftext%3E%3Ctext%20font-family%3D%22Arial%22%20font-size%3D%2218%22%20text-anchor%3D%22middle%22%20x%3D%22129.5%22%20y%3D%2220%22%3Eof%3C%2Ftext%3E%3Ctext%20font-family%3D%22Arial%22%20font-size%3D%2218%22%20text-anchor%3D%22middle%22%20x%3D%22196.5%22%20y%3D%2220%22%3Edetermination%3C%2Ftext%3E%3Ctext%20font-family%3D%22round_brackets18549f92a457f2409%22%20font-size%3D%2218%22%20text-anchor%3D%22middle%22%20x%3D%22259.5%22%20y%3D%2220%22%3E(%3C%2Ftext%3E%3Ctext%20font-family%3D%22round_brackets18549f92a457f2409%22%20font-size%3D%2218%22%20text-anchor%3D%22middle%22%20x%3D%22284.5%22%20y%3D%2220%22%3E)%3C%2Ftext%3E%3Ctext%20font-family%3D%22Arial%22%20font-size%3D%2218%22%20text-anchor%3D%22middle%22%20x%3D%22268.5%22%20y%3D%2220%22%3ER%3C%2Ftext%3E%3Ctext%20font-family%3D%22Arial%22%20font-size%3D%2213%22%20text-anchor%3D%22middle%22%20x%3D%22278.5%22%20y%3D%2213%22%3E2%3C%2Ftext%3E%3Ctext%20font-family%3D%22math17f39f8317fbdb1988ef4c628eb%22%20font-size%3D%2218%22%20text-anchor%3D%22middle%22%20x%3D%22297.5%22%20y%3D%2220%22%3E%3D%3C%2Ftext%3E%3Ctext%20font-family%3D%22round_brackets18549f92a457f2409%22%20font-size%3D%2218%22%20text-anchor%3D%22middle%22%20x%3D%22315.5%22%20y%3D%2220%22%3E(%3C%2Ftext%3E%3Ctext%20font-family%3D%22round_brackets18549f92a457f2409%22%20font-size%3D%2218%22%20text-anchor%3D%22middle%22%20x%3D%22562.5%22%20y%3D%2220%22%3E)%3C%2Ftext%3E%3Ctext%20font-family%3D%22Arial%22%20font-size%3D%2218%22%20text-anchor%3D%22middle%22%20x%3D%22351.5%22%20y%3D%2220%22%3EPearson%3C%2Ftext%3E%3Ctext%20font-family%3D%22Arial%22%20font-size%3D%2218%22%20text-anchor%3D%22middle%22%20x%3D%22432.5%22%20y%3D%2220%22%3Ecorrelation%3C%2Ftext%3E%3Ctext%20font-family%3D%22Arial%22%20font-size%3D%2218%22%20text-anchor%3D%22middle%22%20x%3D%22519.5%22%20y%3D%2220%22%3Ecoefficient%3C%2Ftext%3E%3Ctext%20font-family%3D%22Arial%22%20font-size%3D%2213%22%20text-anchor%3D%22middle%22%20x%3D%22569.5%22%20y%3D%2212%22%3E2%3C%2Ftext%3E%3C%2Fsvg%3E)
The to find the coefficient of determination...
- Method:
-
- Step 1: Square the value found for R
- Step 2: Convert the value into a percentage
-
- An R2 value of closer to 1 (or 100%) shows that the variables have a strong correlation, or, you can predict the dependent variable accurately from the independent variable
- The null hypothesis can be rejected
- An R2 value closer to 0 indicates that there is no correlation, or, the dependent variable cannot be predicted from the independent variable
Exam Tip
You will be provided with the formula for Pearson’s linear correlation in the exam. You need to be able to carry out the calculation to test for correlation, as you could be asked to do this in the exam. You should understand when it is appropriate to use the different statistical tests that crop up in this topic, and the conditions in which each is valid.
