Skewness (Edexcel GCSE Statistics): Revision Note
Exam code: 1ST0

Skewness
What is skewness?
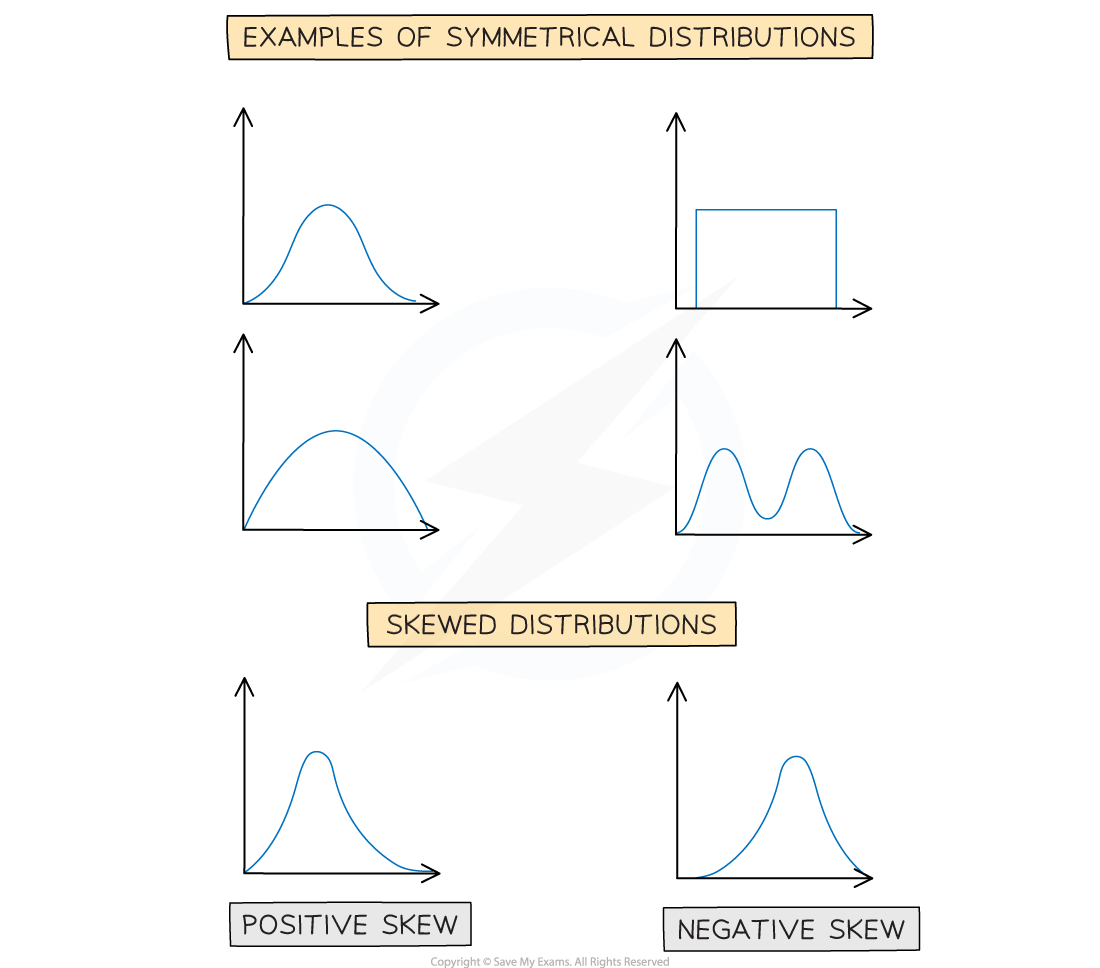
Skewness describes the way in which data in a distribution is 'leaning'
A distribution that has its 'tail' on the right side has positive skew
Most of the data values are on the lower end
The distribution is stretched out in the positive direction
Values above the median have a greater spread than values below the median
A distribution that has its tail on the left side has negative skew
Most of the data values are on the higher end
The distribution is stretched out in the negative direction
Values below the median have a greater spread than values above the median
A distribution that is evenly spread out to the left and right is symmetrical
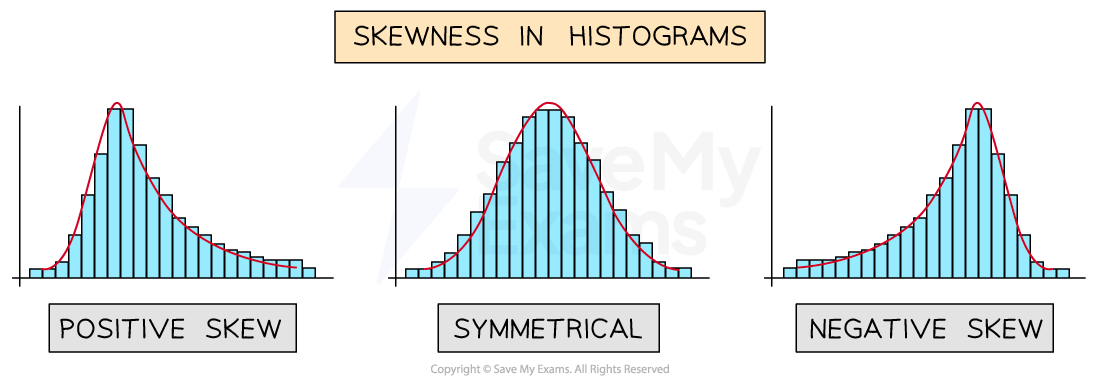
Skewness can be spotted quite easily in histograms
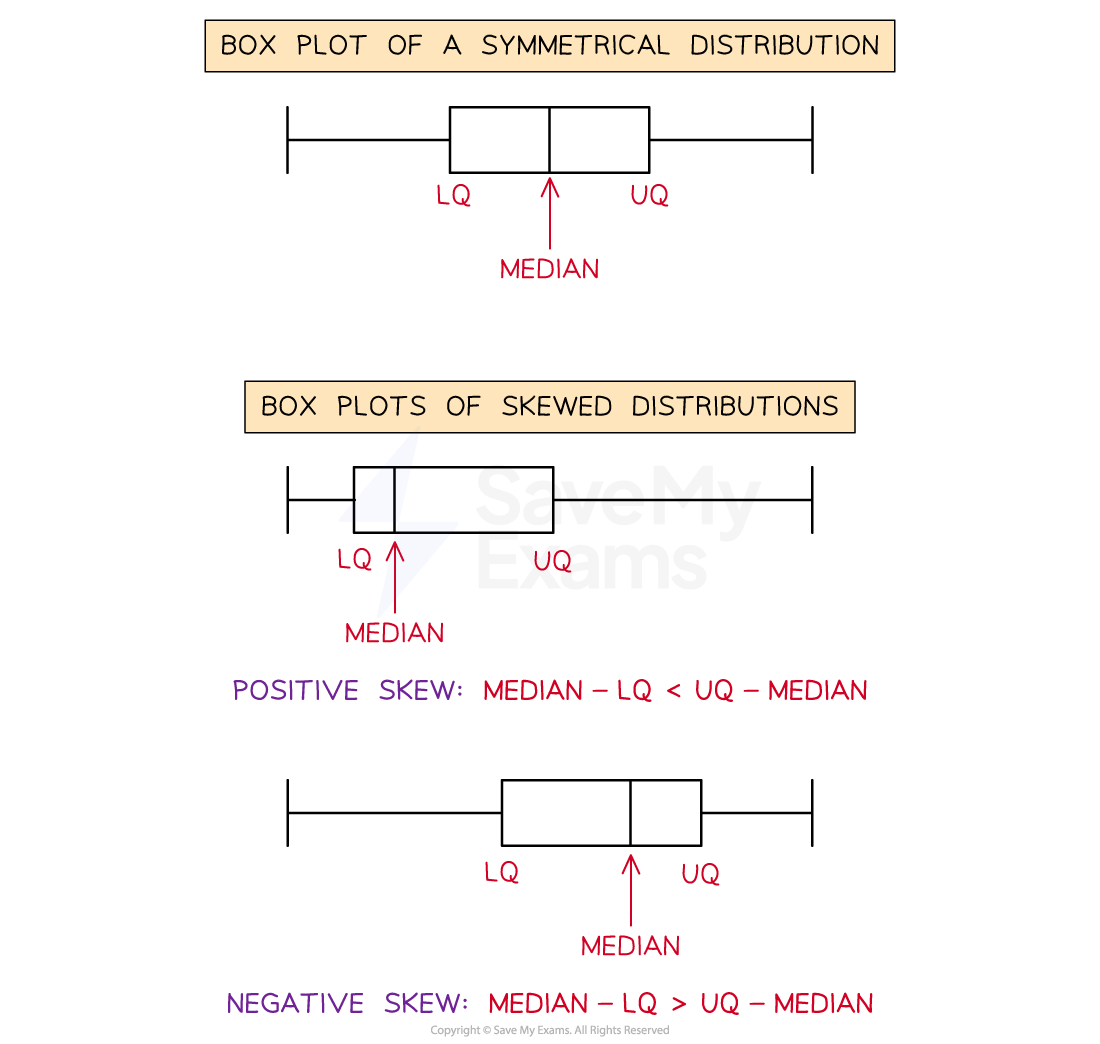
On a box plot looking at the median and quartiles can help you decide how a distribution is skewed
If the median is closer to the lower quartile then the distribution has positive skew
median - LQ < UQ - median
If the median is closer to the upper quartile then the distribution has negative skew
median - LQ > UQ - median
If the median is in the middle of the two quartiles then the distribution is symmetrical
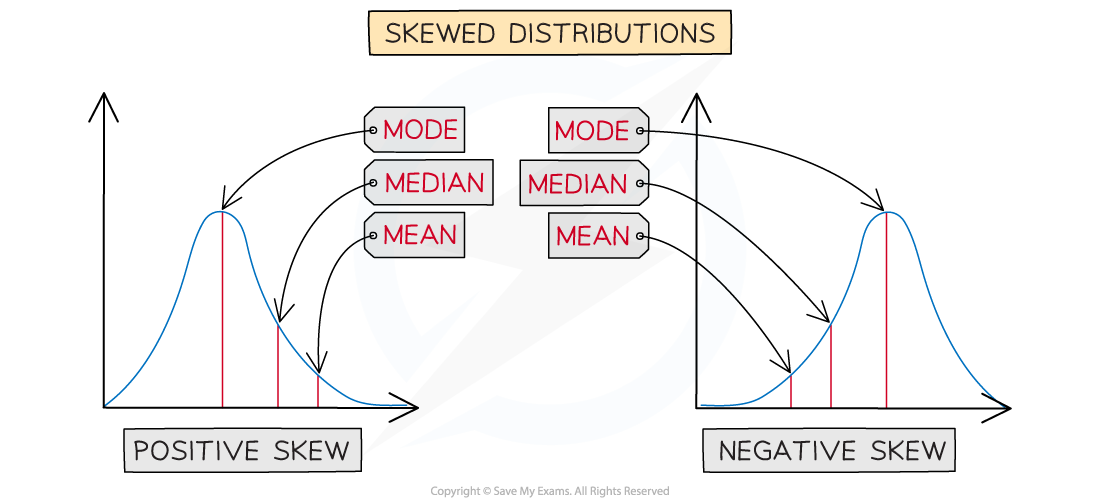
Looking at the values of the averages can help you decide how a distribution is skewed
mean > median > mode can indicate positive skew
mode > median > mean can indicate negative skew
In a perfectly symmetrical distribution the three averages are equal
Examiner Tips and Tricks
An exam question may not ask you specifically about skewness
But if a question asks about 'the shape of a distribution', you should say whether it is symmetrical or positively or negatively skewed
Worked Example
(a) Lenny collected data on the ages of customers coming into his shop one morning. This data is shown in the following stem-and-leaf diagram:
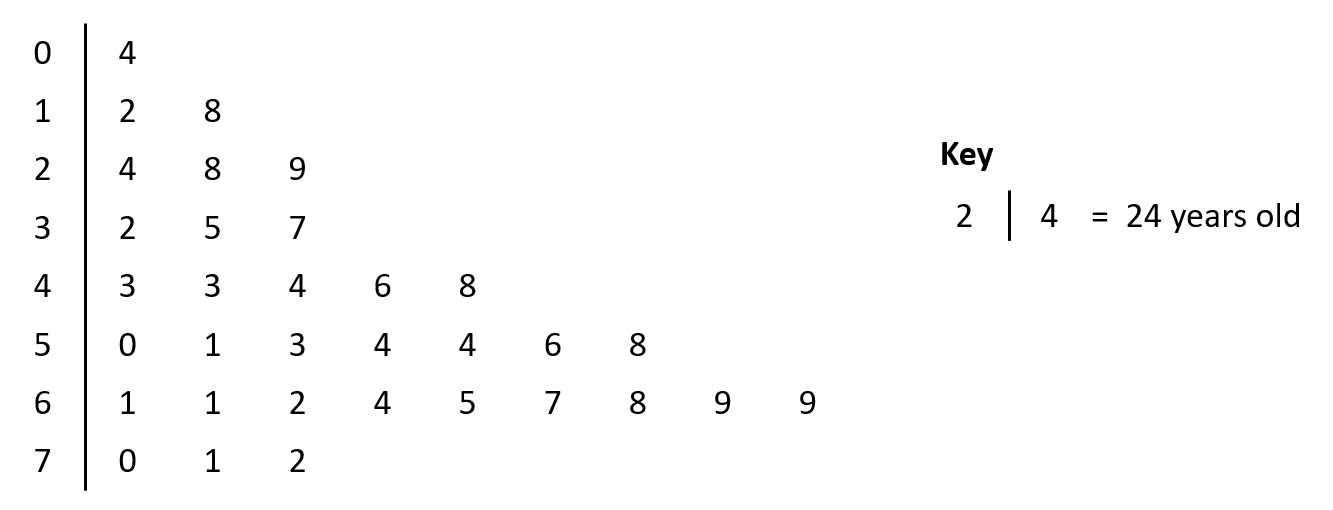
Comment on the shape of the distribution.
Most of the data values are on the higher end and the 'tail' is on the lower end
This means that the distribution has negative skew
(Note you can also 'read' the shape of the distribution by the looking at the length of the leaves row next to each stem)
The distribution has negative skew
(b) John also collected data on the ages coming into his shop one morning. He calculated the following statistics from his data:
mean = 32.4 median = 26 mode = 24
Use these statistics to comment on the skewness of the data.
Here mean > median > mode, which suggests that the data has positive skew
We have mean > median > mode
This suggests that the data has positive skew

Unlock more, it's free!
Join the 100,000+ Students that ❤️ Save My Exams
the (exam) results speak for themselves:

Was this revision note helpful?
