Population Pyramids (Edexcel GCSE Statistics: Foundation): Revision Note
Exam code: 1ST0

Population Pyramids
What is a population pyramid?
A population pyramid is a diagram that shows how a population is distributed between different age groups
It is similar to a bar chart or a stem and leaf diagram
The population is usually divided by gender (female/male) as well
Each horizontal bar represents the part of the population belonging to that age group
The horizontal scale will sometimes show the actual number of people (i.e. the frequency)
But most often it will show the percentage of the population instead
This might be percentage of the total population
Or when split by gender it might only be percentage of the respective female or male populations
Read the question closely to see which percentage is being used
It is possible that you will be given two population pyramids for different populations
In this case you will be expected to make comparisons between the info about the two populations
Examiner Tips and Tricks
Be aware of rounding when answering population pyramid questions
For example rounding all percentages to 1 decimal place might mean the percentages don't add up to exactly 100%
Or a percentage might be given as 0.0% even though there are some people in that group
But if the actual percentage is less than 0.05% it will round to 0.0% to 1 decimal place
Worked Example
The population pyramid gives information about the percentages of the population of the city of Springborough who are male and who are female in each age group in 2023.
Each percentage is given correct to 1 decimal place.
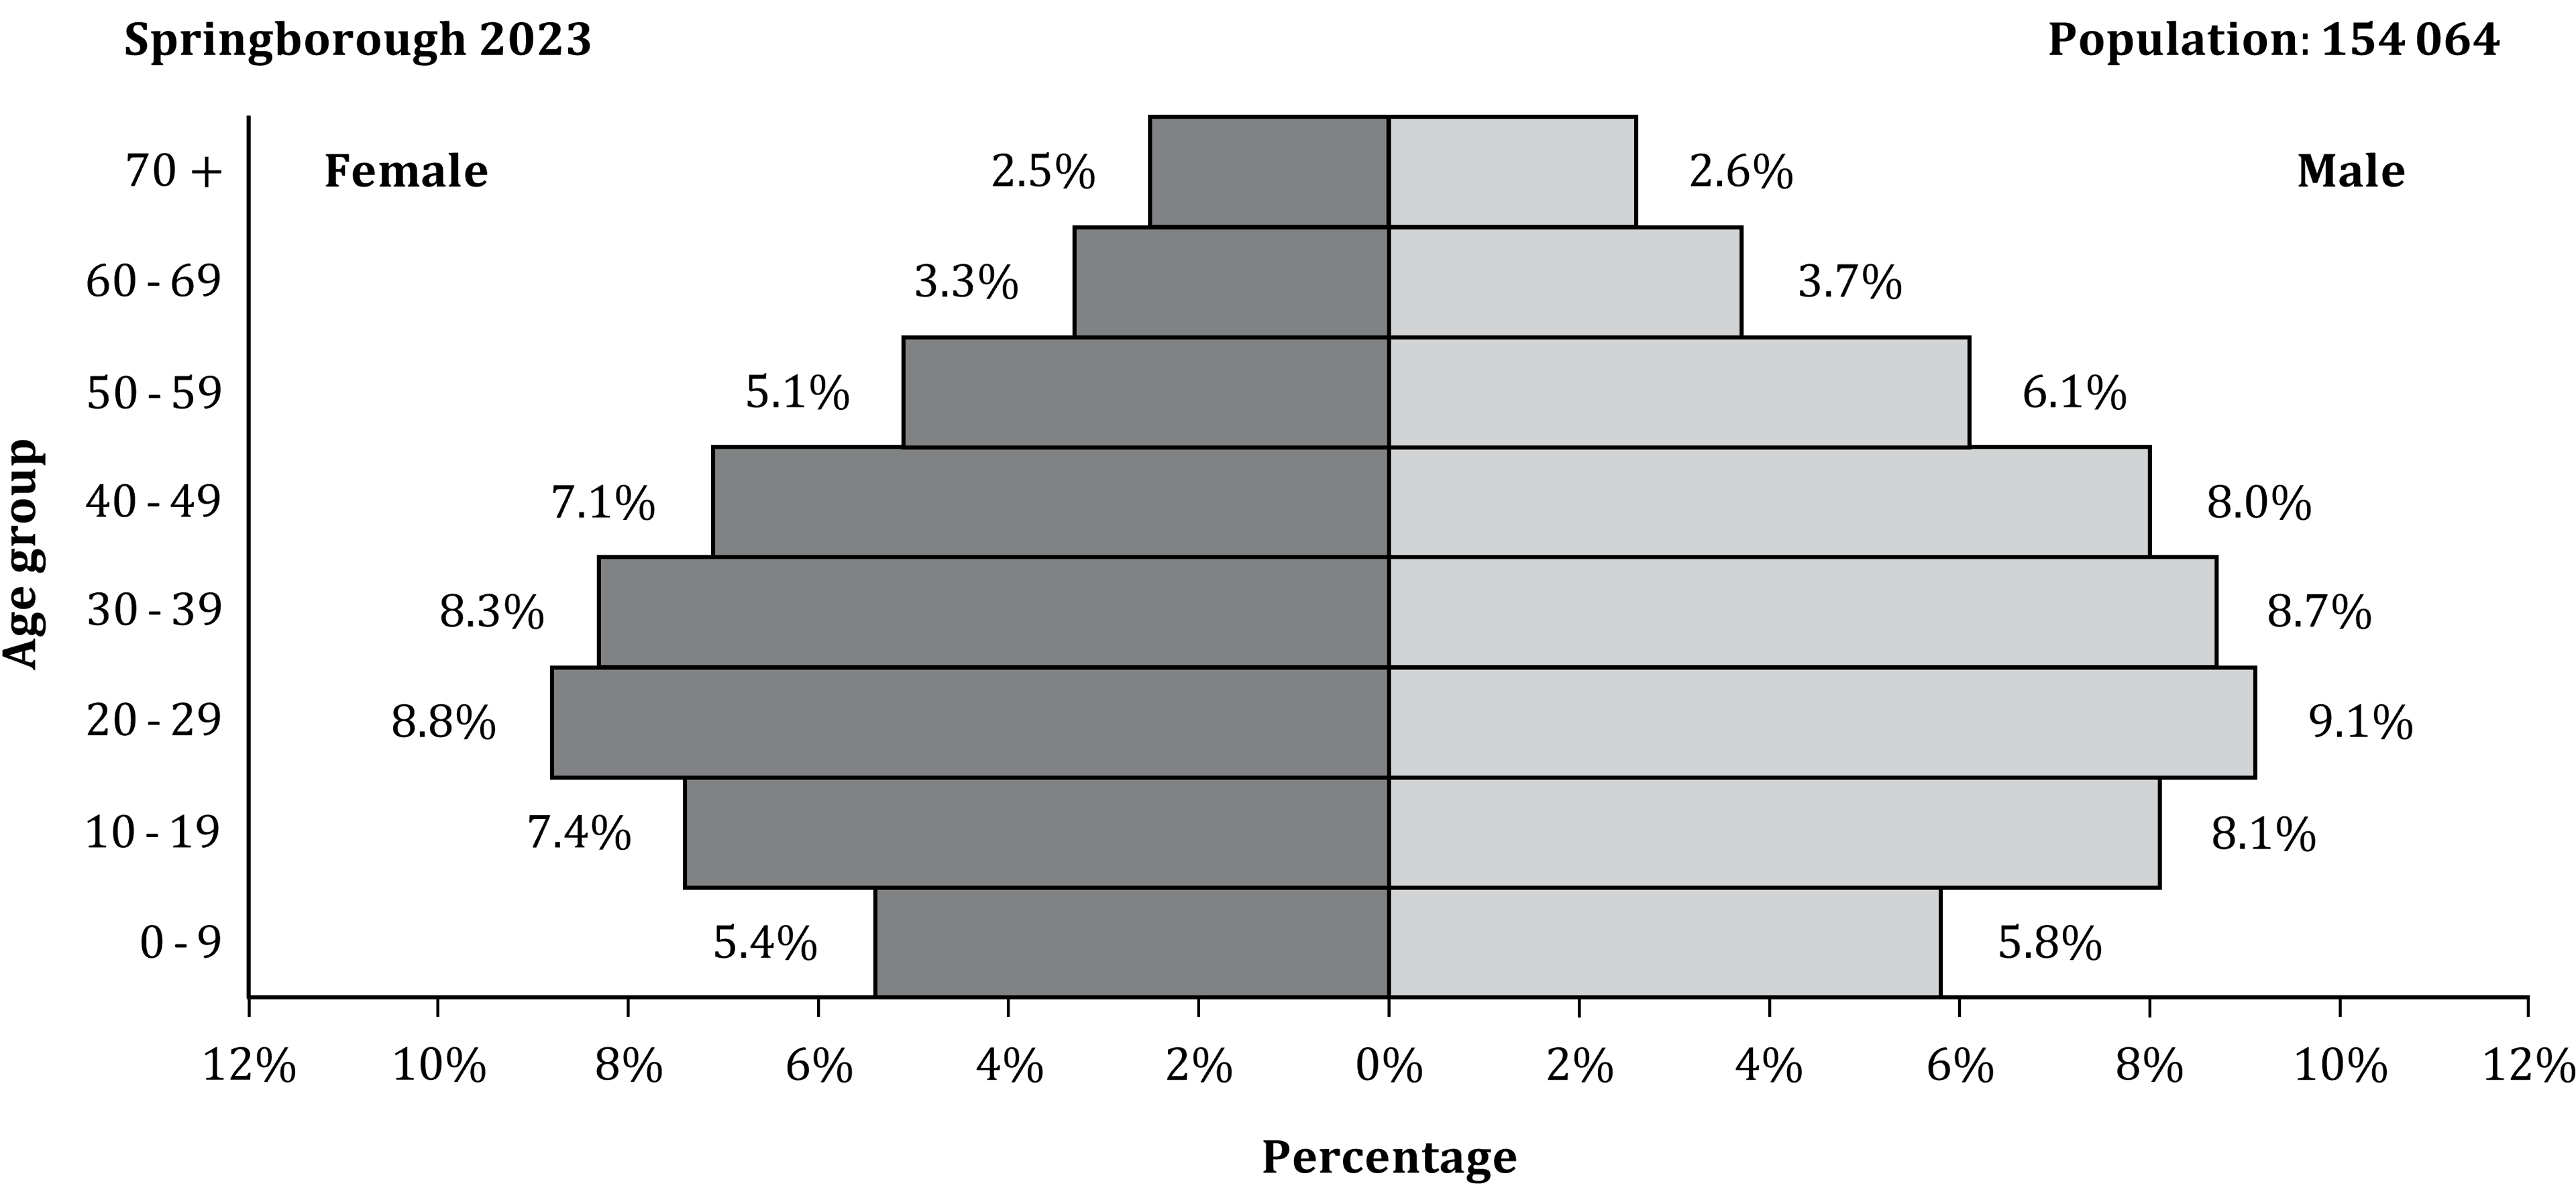
(a) Write down the percentage of the population who are male in the age group 40-49.
This is the '8.0%' bar on the right side of the diagram
8.0%
(b) Work out the percentage of the population who are female in the age group 0-19.
Add together the percentages on the 'female' bars for 0-9 and 10-19
![]()
12.8%
To the nearest whole number, 3.3% of 154064 is 5084.
Bartholomew claims that this must be the number of females in the 60-69 age group in Springborough.
Lisa claims that the exact number might be different from this.
(c) Explain with a reason whether or not Lisa's claim is justified.
The question says that the percentages are rounded to 1 decimal place
Other numbers besides 5084 are probably also equal to 3.3% of 154064 when you round to 1 decimal place
Test another number close to 5084
![]()
This shows that Lisa's claim is justified
Lisa's claim is justified, because other numbers will also be equal to 3.3% of 154064 if you round to 1 decimal place. For example 5090 people would also round to 3.3% to 1 decimal place.
Homer is carrying out research into the ages of people in Springborough. He uses the information in the population pyramid to claim,
"In Springborough in 2023 the number of females who were
40 or older was greater than the number of males who were
40 or older."
(d) Explain whether or not Homer's claim is correct.
The easiest way to show that Homer is incorrect is just to notice that all the bars from 40-49 and upwards are higher for males than for females
Homer's claim is not correct. From the age of 40 upwards, each year group in the population has a greater percentage of males than females, so it it is actually the number of males 40 and over which is greater.
You could also do this by adding up the figures next to the bars to show that 18.0% of the population is female and over 40, but 20.4% of the population is male and over 40

Unlock more, it's free!
Join the 100,000+ Students that ❤️ Save My Exams
the (exam) results speak for themselves:

Was this revision note helpful?
