Graphical Representation of Electric Potential (AQA A Level Physics): Revision Note
Exam code: 7408
Graphical Representation of Electric Potential
An electric field can be described in terms of the variation of electric potential at different points in the field
This is known as the potential gradient
The potential gradient of an electric field is defined as:
The rate of change of electric potential with respect to displacement in the direction of the field
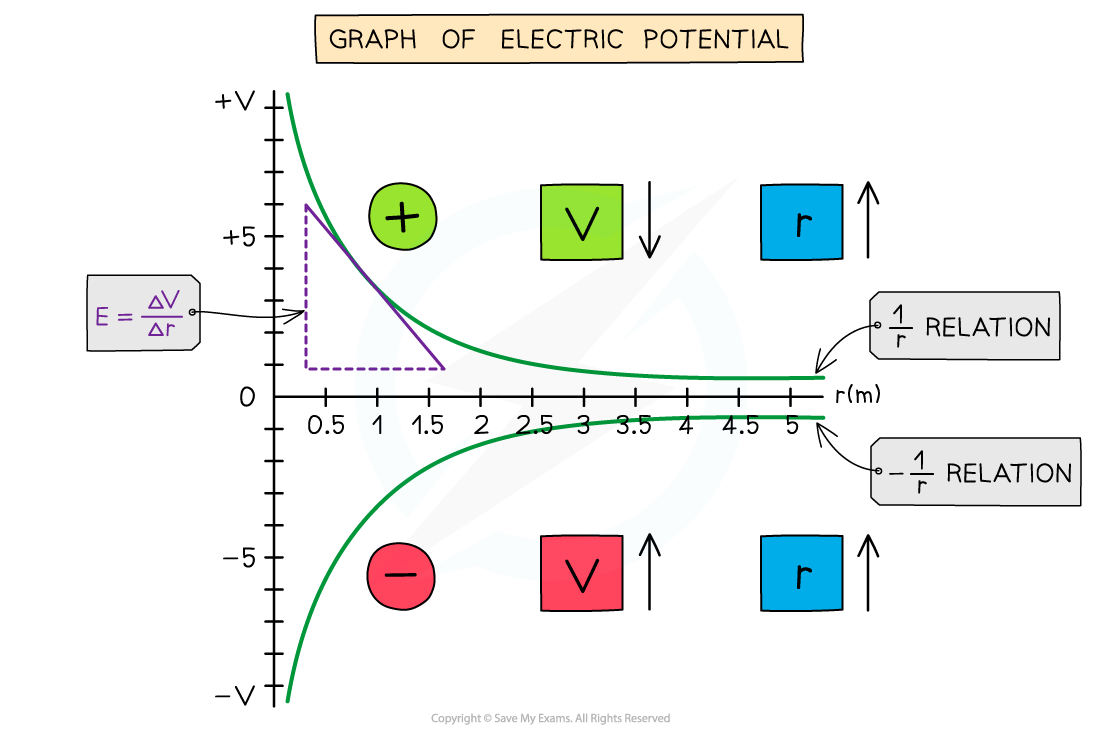
A graph of potential V against distance r can be drawn for a positive or negative charge Q
This is a graphical representation of the equation:
The gradient of the V-r graph at any particular point is equal to the electric field strength E at that point
This can be written mathematically as:
Where:
E = electric field strength (V m−1)
ΔV = potential difference between two points (V)
Δr = displacement in the direction of the field (m)
The negative sign is included to indicate that the direction of the field strength E opposes the direction of increasing potential
Graph of electric potential and distance

The electric potential around a positive charge decreases with distance and increases with distance around a negative charge
The key features of this graph are:
All values of potential are negative for a negative charge
All values of potential are positive for a positive charge
As r increases, V against r follows a 1/r relation for a positive charge and a -1/r relation for a negative charge
The gradient of the graph at any particular point is equal to the field strength E at that point
The curve is shallower than the corresponding E-r graph
Determining potential difference from a field-distance graph
The potential difference due to a charge can also be determined from the area under a field-distance graph
A graph of field strength E against distance r can be drawn for a positive or negative charge Q
This is a graphical representation of the equation:
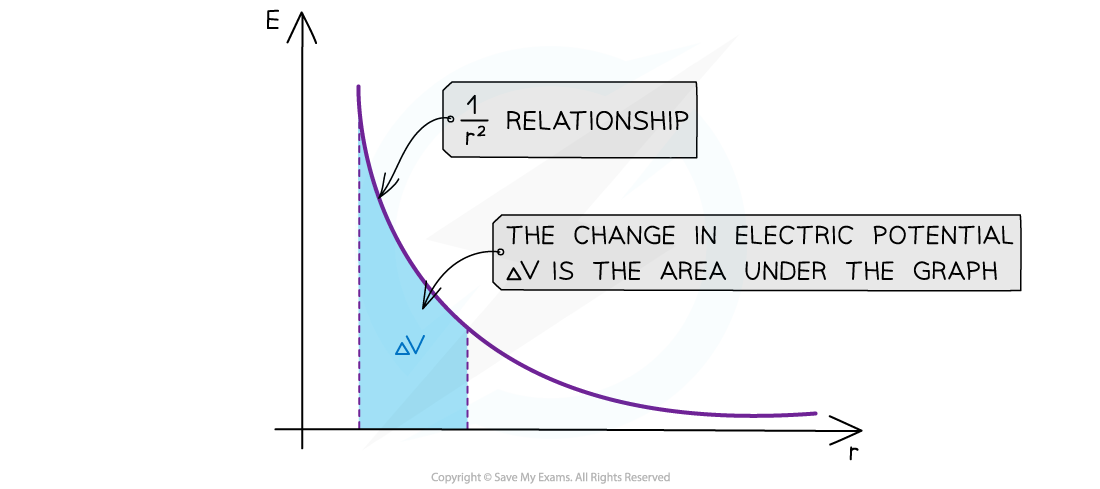
The area under the E-r graph between two points is equal to the potential difference ΔV between those points
Graph of electric field strength and distance

The electric field strength E has a 1/r2 relationship, and the area under the graph represents change in electric potential
The key features of this graph are:
All values of field strength are negative for a negative charge
All values of field strength are positive for a positive charge
As r increases, E against r follows a 1/r2 relation (inverse square law)
The area under this graph is the change in electric potential ΔV
The curve is steeper than the corresponding V-r graph
Examiner Tips and Tricks
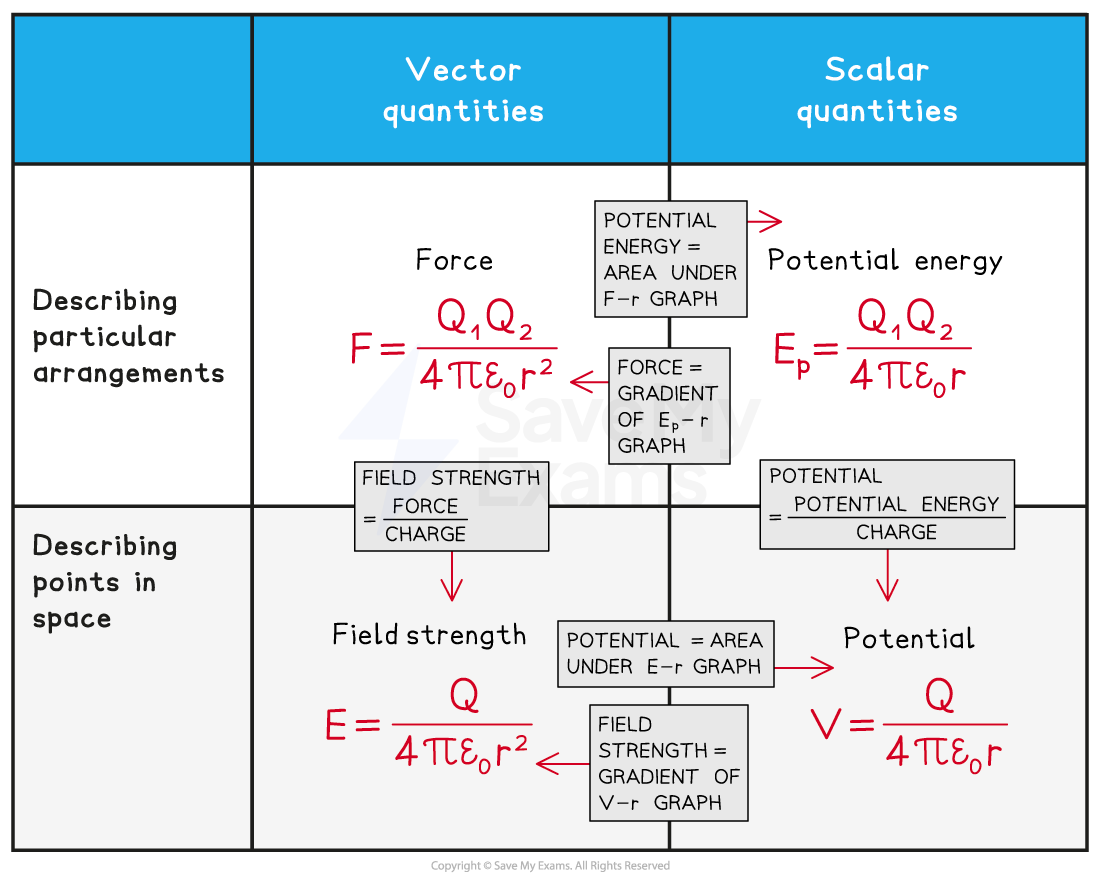
There are many equations and graphs to learn in this topic. A good way to revise these is to find a way of organising the knowledge in a way that resonates with you, here is an example of one possible way to do this:


Unlock more, it's free!
Did this page help you?