Distance-Time Graphs (Cambridge (CIE) O Level Maths): Revision Note
Exam code: 4024

Distance-time graphs
How do I use a distance-time graph?
Distance-time graphs show the distance travelled at different times
Distance is on the vertical axis
Time is on the horizontal axis
The gradient of the graph is the speed
The steeper the line the faster the object is moving
Lines with positive gradients represent objects moving away from the start point
Lines with negative gradients represent objects moving towards the start point
Lines that are horizontal represent rest
The object is stationary (not moving)
How do I work out the overall average speed?
For journeys with multiple parts
the overall average speed for the whole journey is

The total time includes any rests
Examiner Tips and Tricks
These questions often have a lot of parts that depend on each other, so always double check each answer before continuing.
Worked Example
One afternoon, Mary jogged 8 km from her home to her grandfather's house.
Part of the travel graph for her journey is shown.
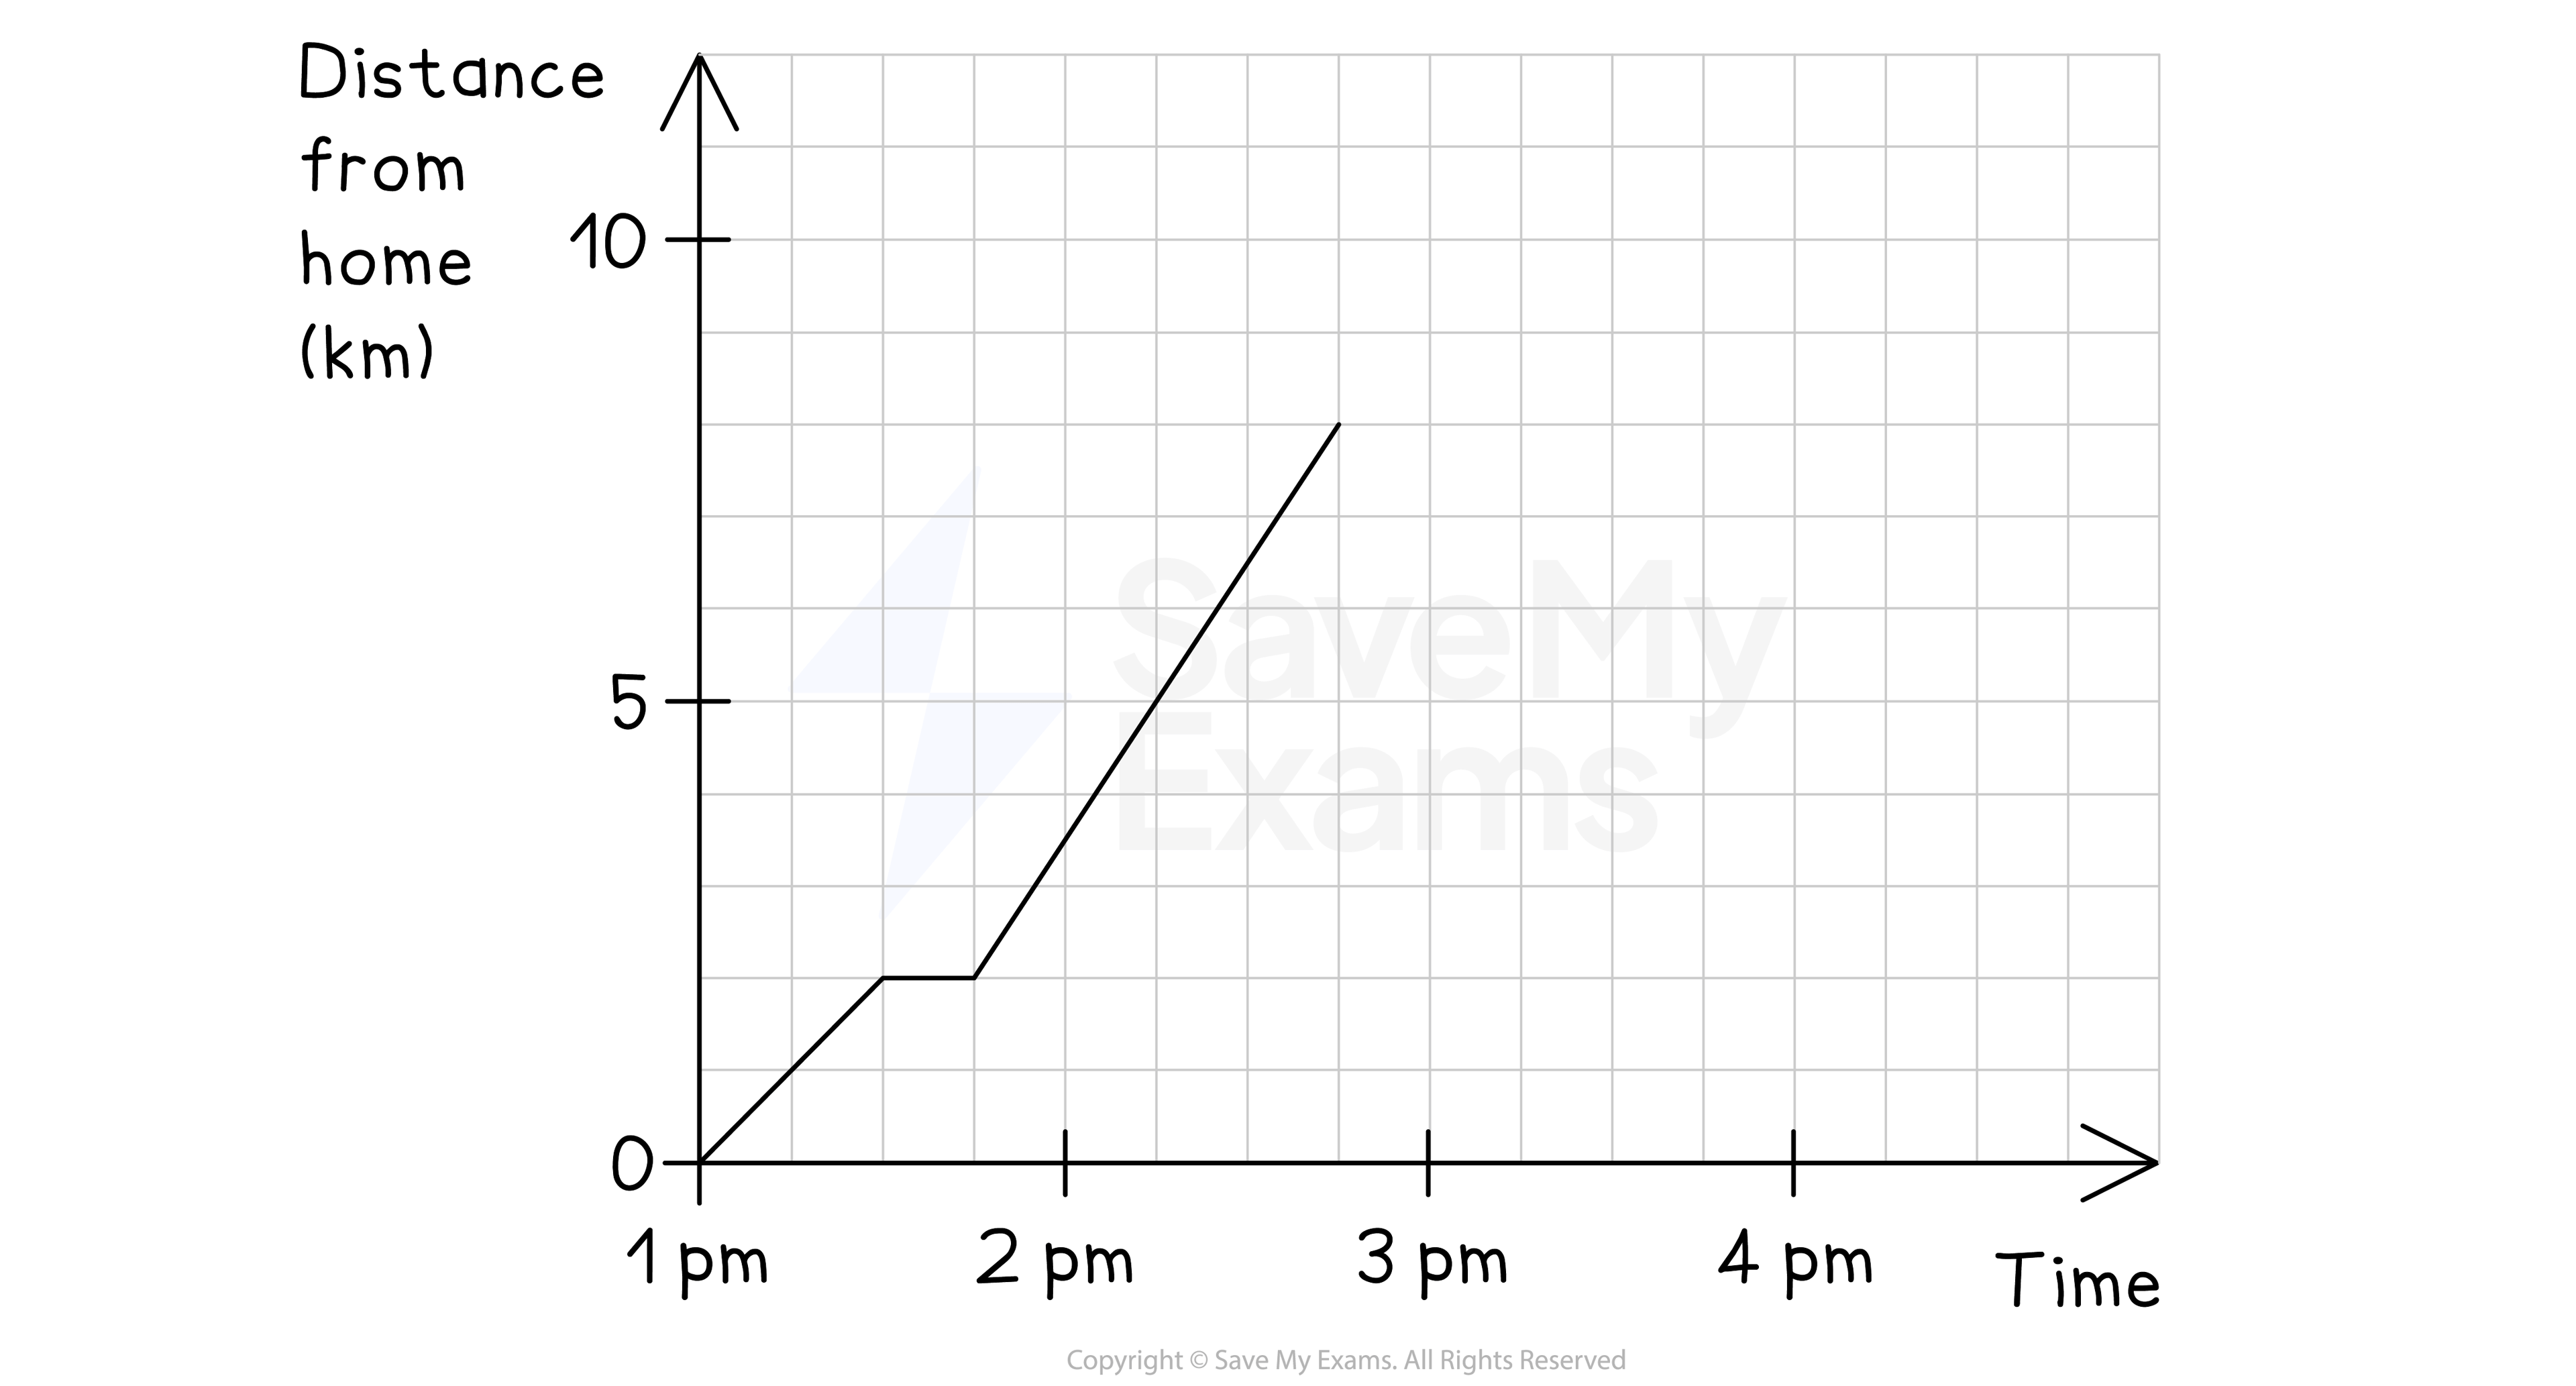
(a) Find Mary's speed at 2 pm.
Answer:
The speed is the gradient of the line at that point
The gradient at 2pm is the same as the gradient for all points between 1:45pm and 2:45pm
It is easiest to use ![]() for that bigger section
for that bigger section
![]()
6 km/h
(b) Calculate, in minutes, how long Mary stopped on the way to her grandfather's house.
Answer:
The horizontal line is where Mary stops
The scale is 1 square = 15 minutes
15 minutes
(c) Calculate Mary's overall average speed from leaving her home to arriving at her grandfather's house, giving your answer correct to 3 significant figures.
Answer:
Overall average speed is ![]()
Total distance travelled is 8 km
Total time (including rests) is 1.75 hours
![]()
Round the answer to 3 significant figures
4.57 km/h (to 3 s.f.)
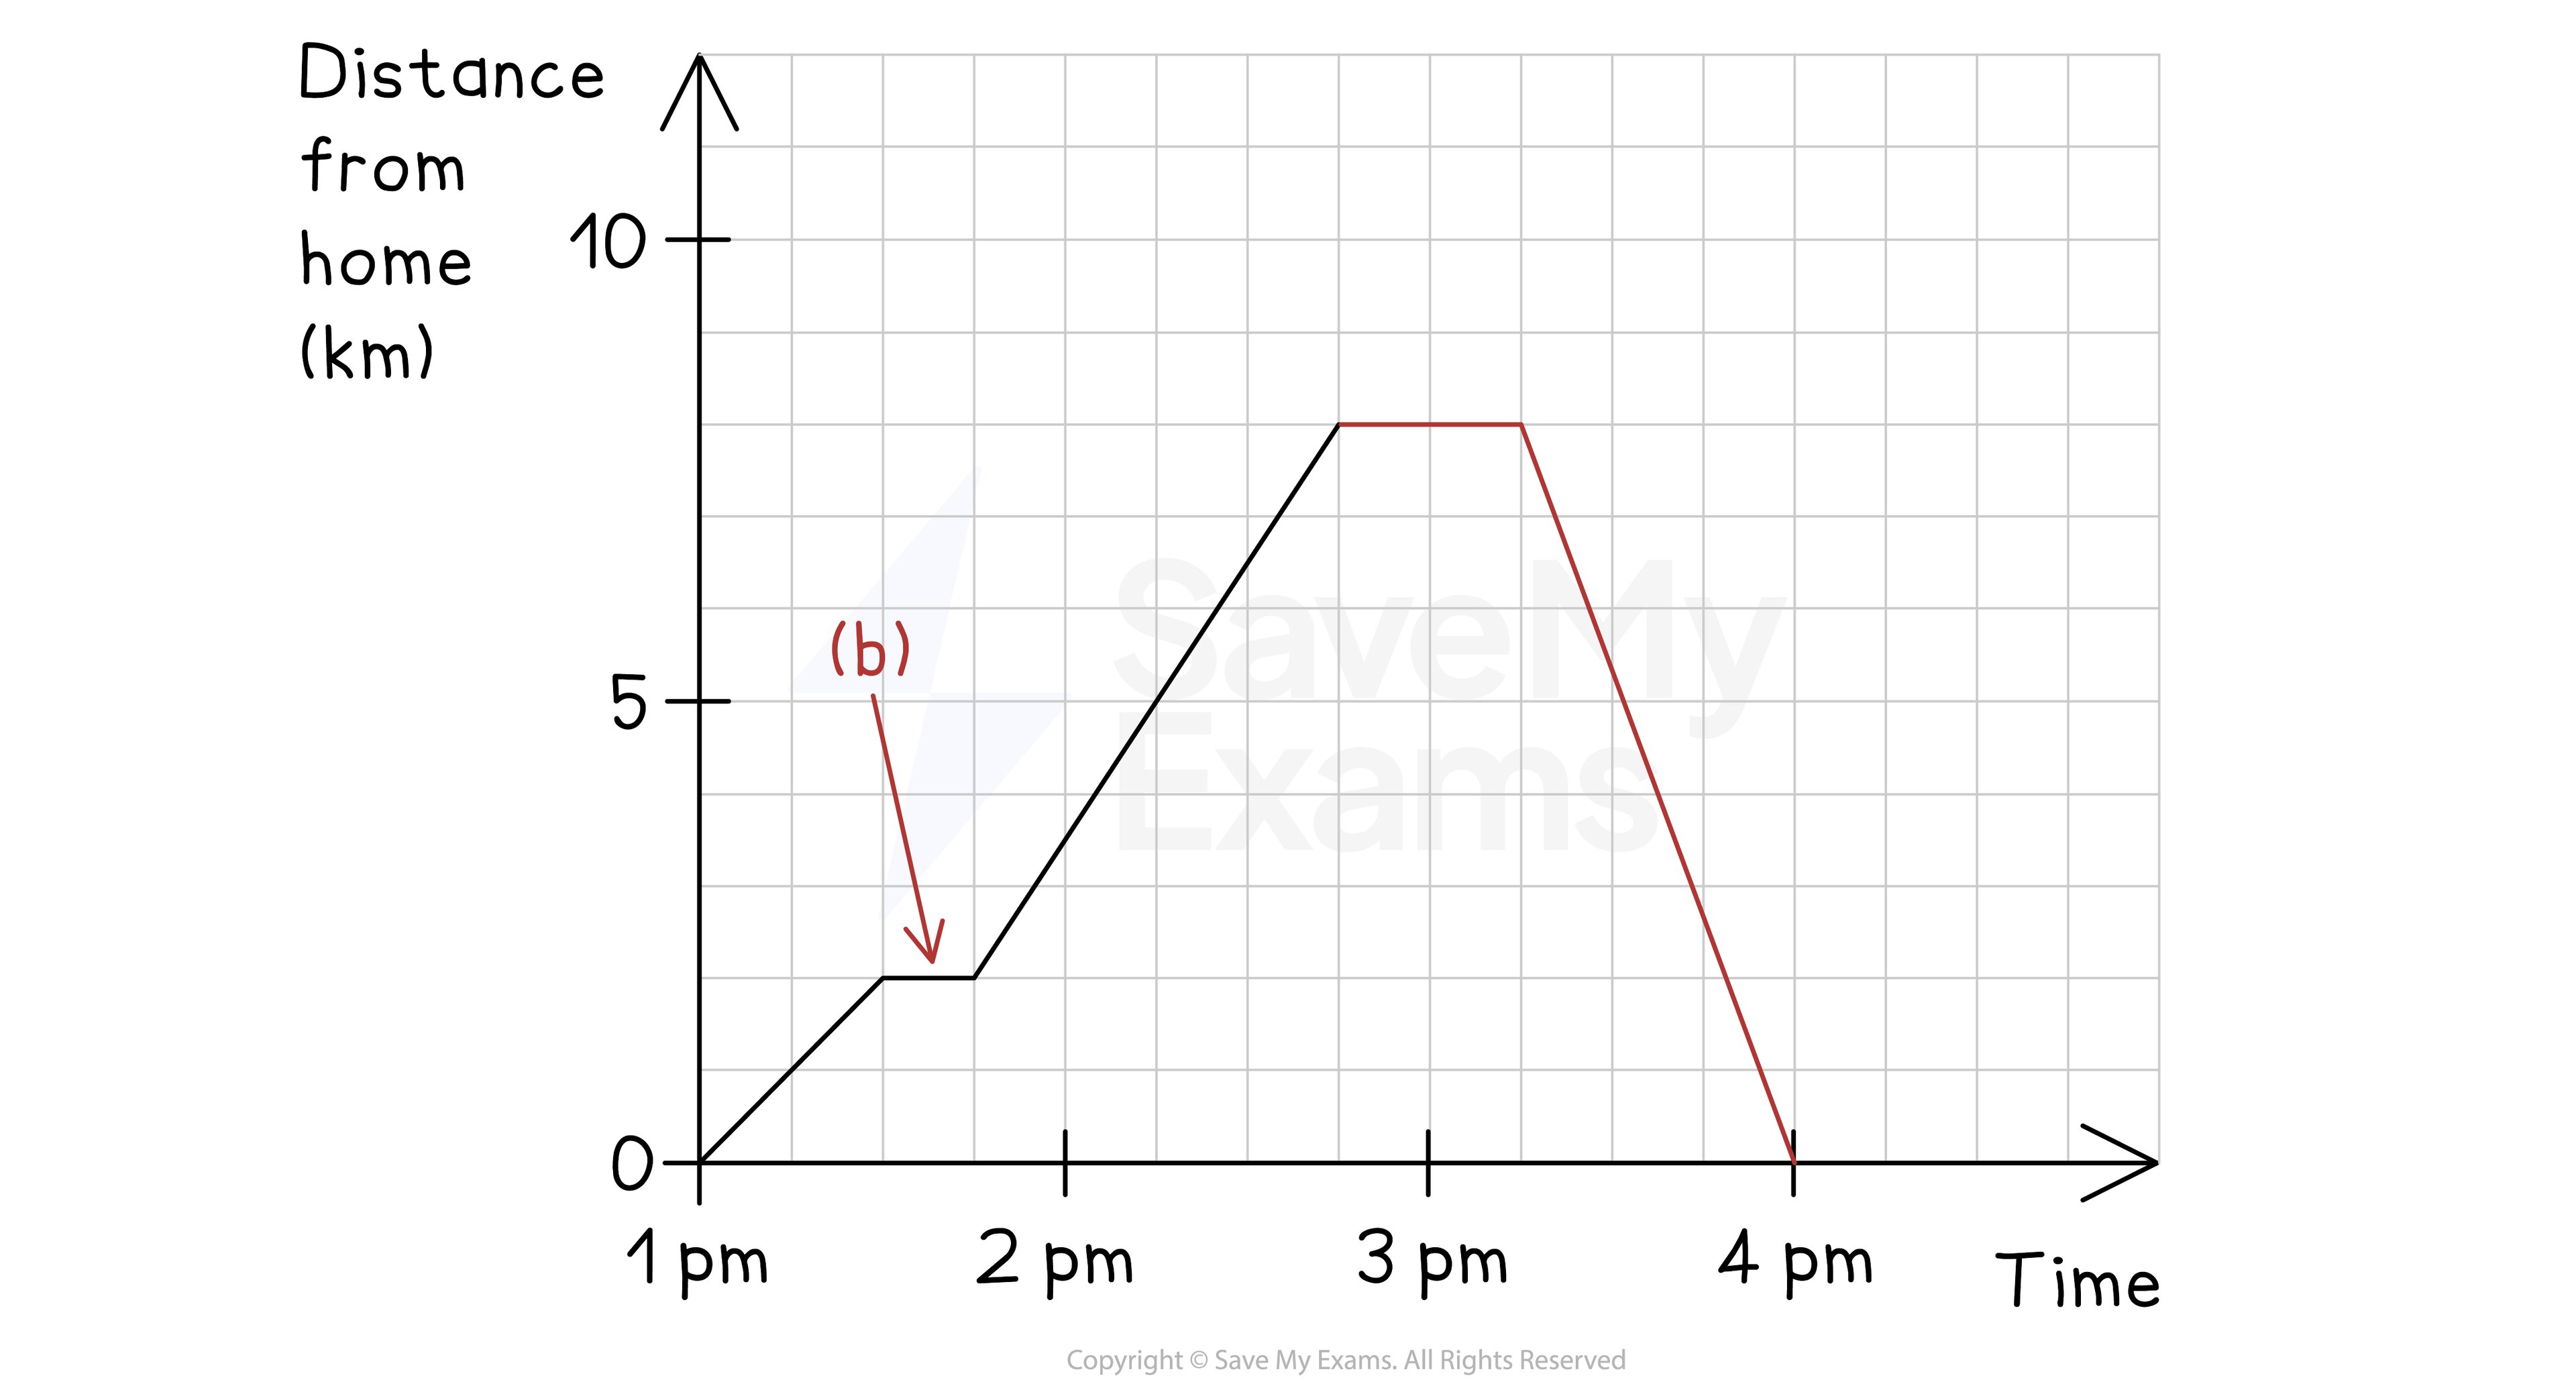
(d) Mary stayed at her grandfather's house for half an hour, then jogged home at a steady speed without stopping, arriving home at 4pm.
Complete the travel graph for Mary's journey.
Answer:
Rest is a horizontal line
Returning home is a straight line with a negative gradient

Unlock more, it's free!
Join the 100,000+ Students that ❤️ Save My Exams
the (exam) results speak for themselves:

Was this revision note helpful?
