1 7 marks
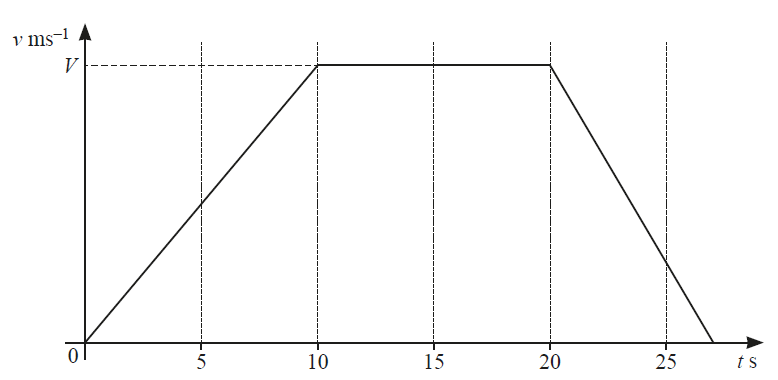
The diagram shows the velocity–time graph for a particle ![]() travelling in a straight line with velocity
travelling in a straight line with velocity ![]() at time
at time ![]() . The particle accelerates at
. The particle accelerates at ![]() for the first 10 s of its motion and then travels at constant velocity,
for the first 10 s of its motion and then travels at constant velocity, ![]() , for
, for ![]() . The particle then decelerates at a constant rate and comes to rest. The distance travelled during the interval
. The particle then decelerates at a constant rate and comes to rest. The distance travelled during the interval ![]() .
.
(i) Find the value of ![]() .
.
[1]
(ii) Find the velocity of ![]() when
when ![]() .
.
[3]
(iii) Find the value of ![]() when
when ![]() comes to rest.
comes to rest.
[3]
Did this page help you?


