Interpreting Data (Cambridge (CIE) O Level Chemistry) : Revision Note
Did this video help you?
Interpreting Data
Data recorded in rate studies is used to plot graphs to calculate the rate of a reaction
Plotting a graph until the completion of the reaction shows how the rate changes with time
Over time the rate of reaction slows as the reactants are being used up so the line becomes less steep and eventually becomes horizontal, indicating the reaction has finished
You can plot more than one run of a variable on the same graph making it easier to see how the variable influences the rate
For example, plotting the effect of concentration on a reaction between the acid and marble chips

The steeper the curve, the faster the rate of the reaction
The curve is steepest initially so the rate is quickest at the beginning of the reaction
As the reaction progresses, the concentration of the reactants decreases and the rate decreases shown by the curve becoming less steep
When one of the reactants is used up, the reaction stops, the rate becomes zero and the curve levels off to a horizontal line
The amount of product formed in a reaction is determined by the limiting reactant:
If the amount of limiting reactant increases, the amount of product formed increases
If the amount of the reactant in excess increases, the amount of product remains the same
Drawing a tangent to the slope allows you to show the gradient at any point on the curve
The steeper the slope, the quicker the rate of reaction
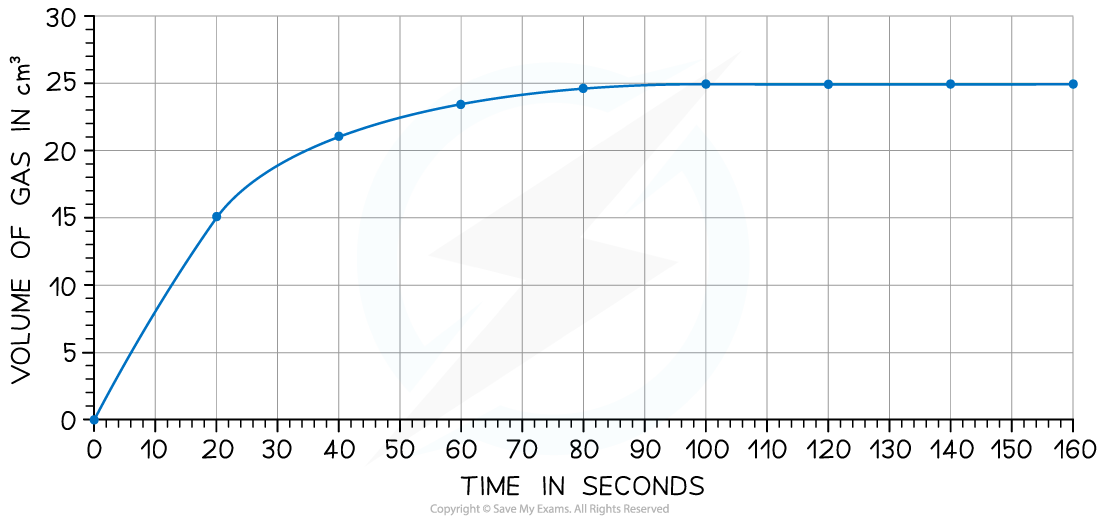
The volume of a gaseous product would increase to a maximum over time, so the line levels out indicating the reaction is over
Since the volume and mass would be proportional, this could also be a graph of the mass of product versus time
Worked Example
0.2 g of manganese(IV) oxide was added to 25 cm3 of 0.1 mol/dm3 hydrogen peroxide solution. The volume of oxygen produced every minute was recorded and the results are shown on the graph.

The experiment was repeated using the same mass of manganese(IV) oxide and at the same temperature but using 25 cm3 of 0.2 mol/dm3 of hydrogen peroxide solution.
Sketch the curve for the results of this experiment on the same grid.
Answer
Step 1 - Deduce how the initial gradient will be different from the original graph
The hydrogen peroxide solution is twice as concentrated so the rate of reaction will be greater and the initial gradient will be steeper
Step 2 - Deduce how much product will be formed compared to the original experiment
The amount of hydrogen peroxide determines the amount of oxygen produced. In the 2nd experiment, there are twice as many hydrogen peroxide molecules in the same volume so the amount of oxygen gas produced will be doubled
Step 3 - Sketch the graph

Calculating the Rate of Reaction at a Particular Point
To do this you need to find the gradient of the curve at that point
To do this a tangent is drawn to the curve and then the gradient of the tangent calculated
Worked Example
Iodine and methanoic acid react in aqueous solution.
I2 (aq) + HCOOH (aq) → 2I− (aq) + 2H+ (aq) + CO2 (g)
The rate of reaction can be found by measuring the volume of carbon dioxide produced per unit time and plotting a graph as shown:

Calculate the rate of reaction at 20 seconds.
Answer
Draw a tangent to the curve at 20 seconds:

Complete the triangle and read off the values of x and y
Determine the gradient of the line using change in y / change in x
Rate of reaction = 24 ÷ 40 = 0.60 cm3/s
Examiner Tips and Tricks
If the amount of reactant used up is being monitored, then the graph will fall with the steepest gradient at the start, becoming less steep until it levels off to a horizontal line.

You've read 0 of your 5 free revision notes this week
Sign up now. It’s free!
Did this page help you?
