Modulus Functions (Cambridge (CIE) O Level Additional Maths): Revision Note
Exam code: 4037
Sketching modulus graphs
What is a modulus function?
The modulus function makes any ‘input’ positive
This is sometimes called the absolute value (of the input)
The modulus function is indicated by a pair of vertical lines being written around the input
Similar to how brackets are used
e.g.
What types of modulus graphs will I need to sketch?
Modulus graphs required will be of linear, or quadratic form
Linear form will be
Quadratic form will be
Often, there will be two graphs to sketch as this helps with solving equations involving modulus functions
In linear form, equations could be of the form
One side of the equation may not involve the modulus
One side may have a constant term only (i.e.
and/or
In quadratic form, equations could be of the form
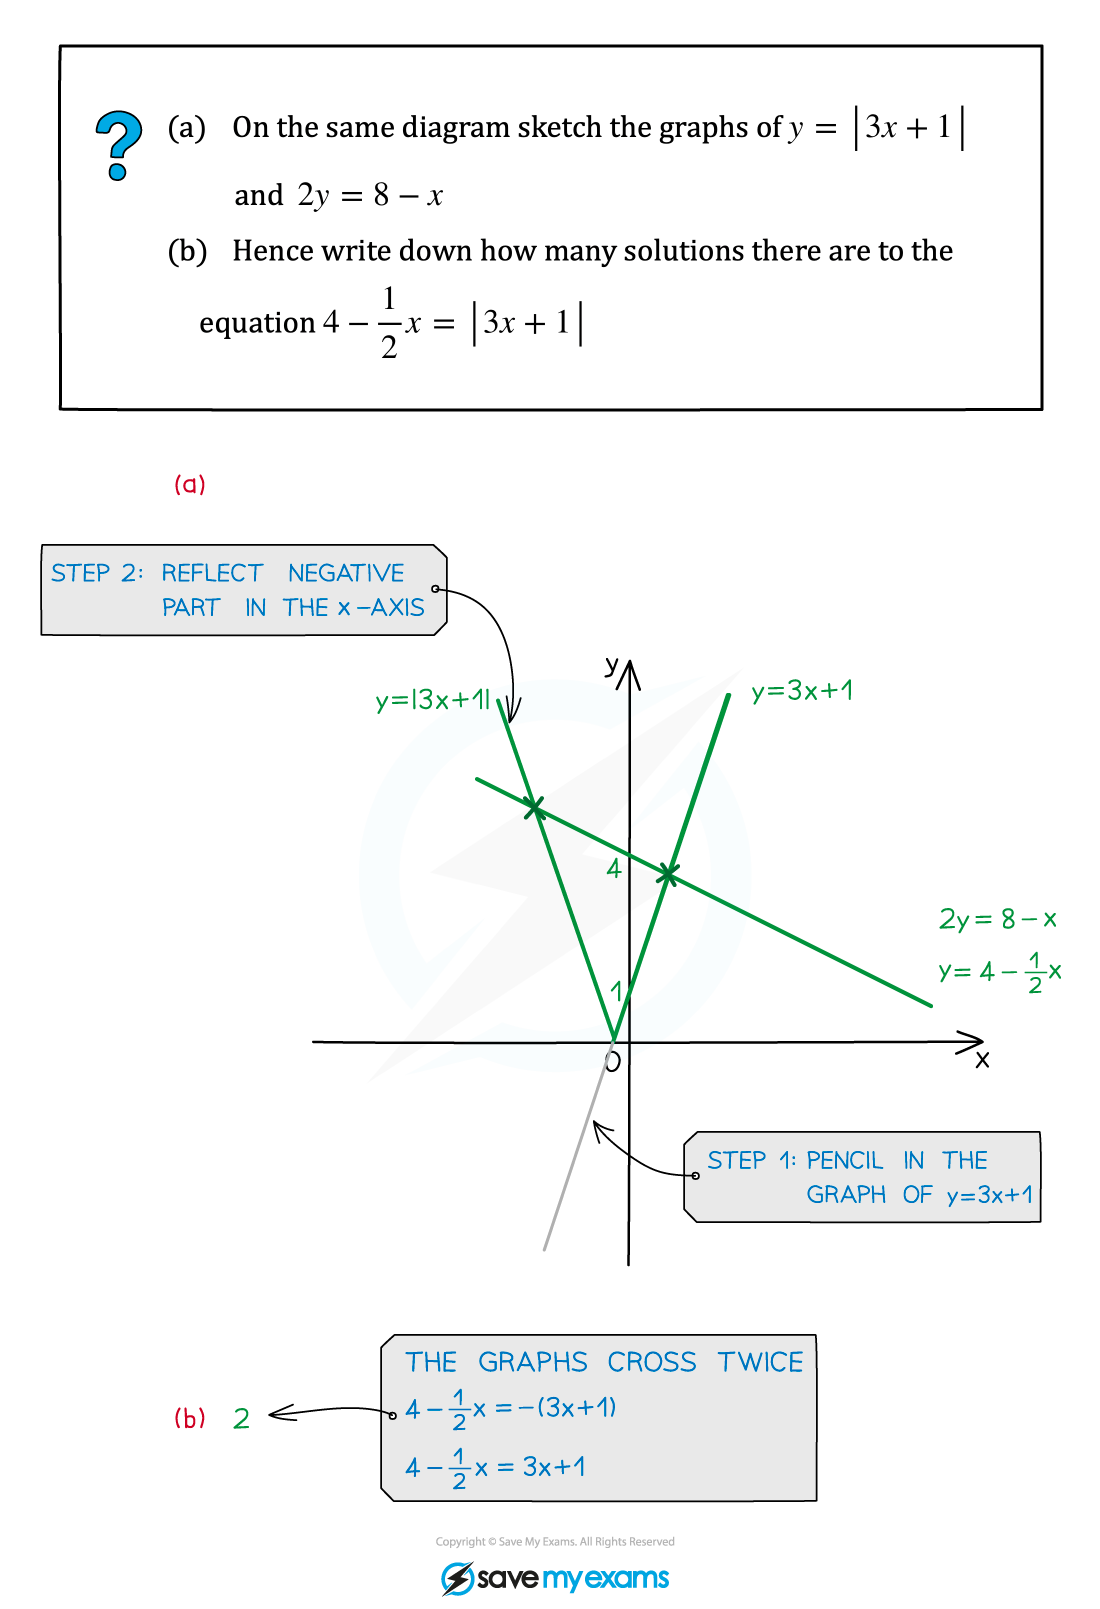
In both cases, graphs of the left hand side and right hand side drawn on the same diagram will reveal the number of intersections of the graphs (and so the number of solutions to the equation)

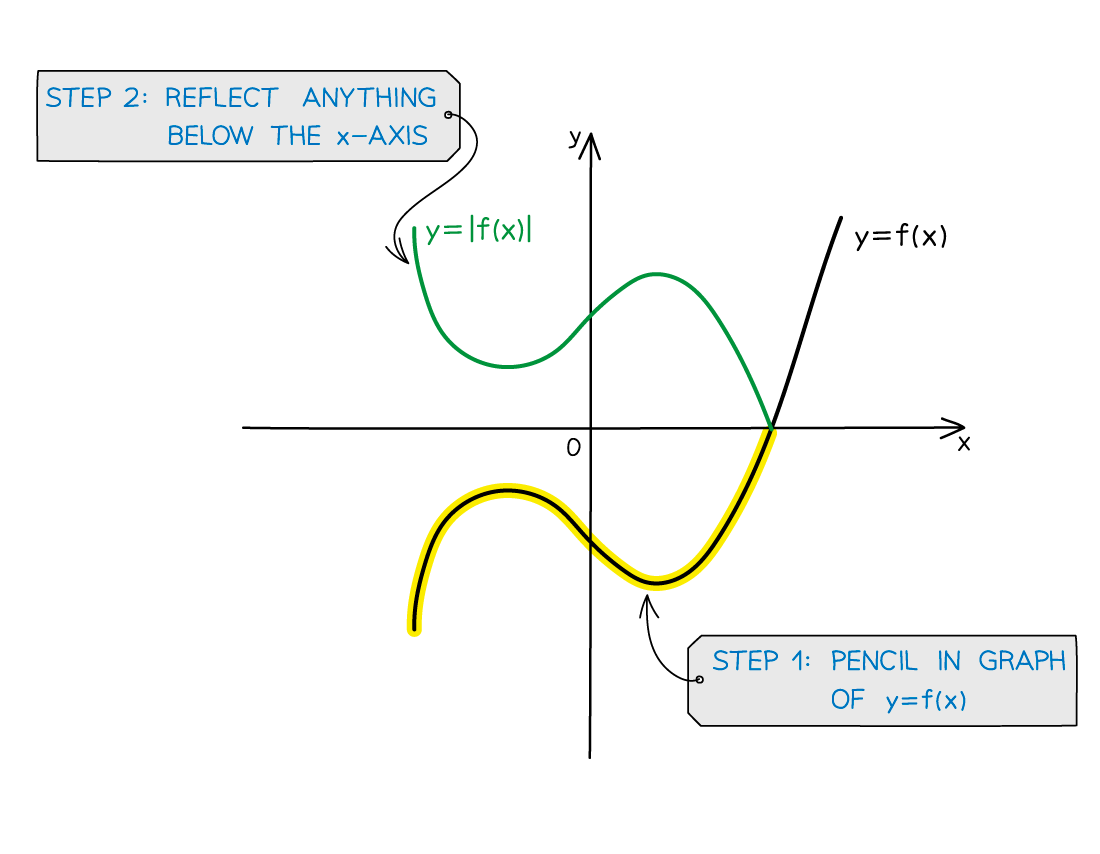
How do I sketch the graph of the modulus of a function: y = |f(x)|?
STEP 1
Pencil in the graph of y = f(x)
STEP 2
Reflect anything below the x-axis, in the x-axis, to get y = |f(x)|

Note in particular that the
-axis intercept, if negative on the graph of
will be positive on the graph of
At the
-axis intercepts, the graph will have a sharp
-shape
this is not a smooth curve like with a turning point
if the graph is of the form
then the graph would be wholly negative and the
-axis intercepts would have a sharp
-shape
Worked Example

Did this video help you?
Solving modulus equations
Why are graphs needed to solve modulus equations?
Sketching the graphs of two modulus function(s) on the same diagram quickly reveals
the number of solutions there are to the equation
which parts of the graph (equation) - either the 'normal' part or the 'reflected' part - will be needed to solve equations
For example, two non-parallel linear graphs would intersect
the solution to the linear functions being equal to each other would have one solution
if a modulus is involved there could be more than one intersection/solution

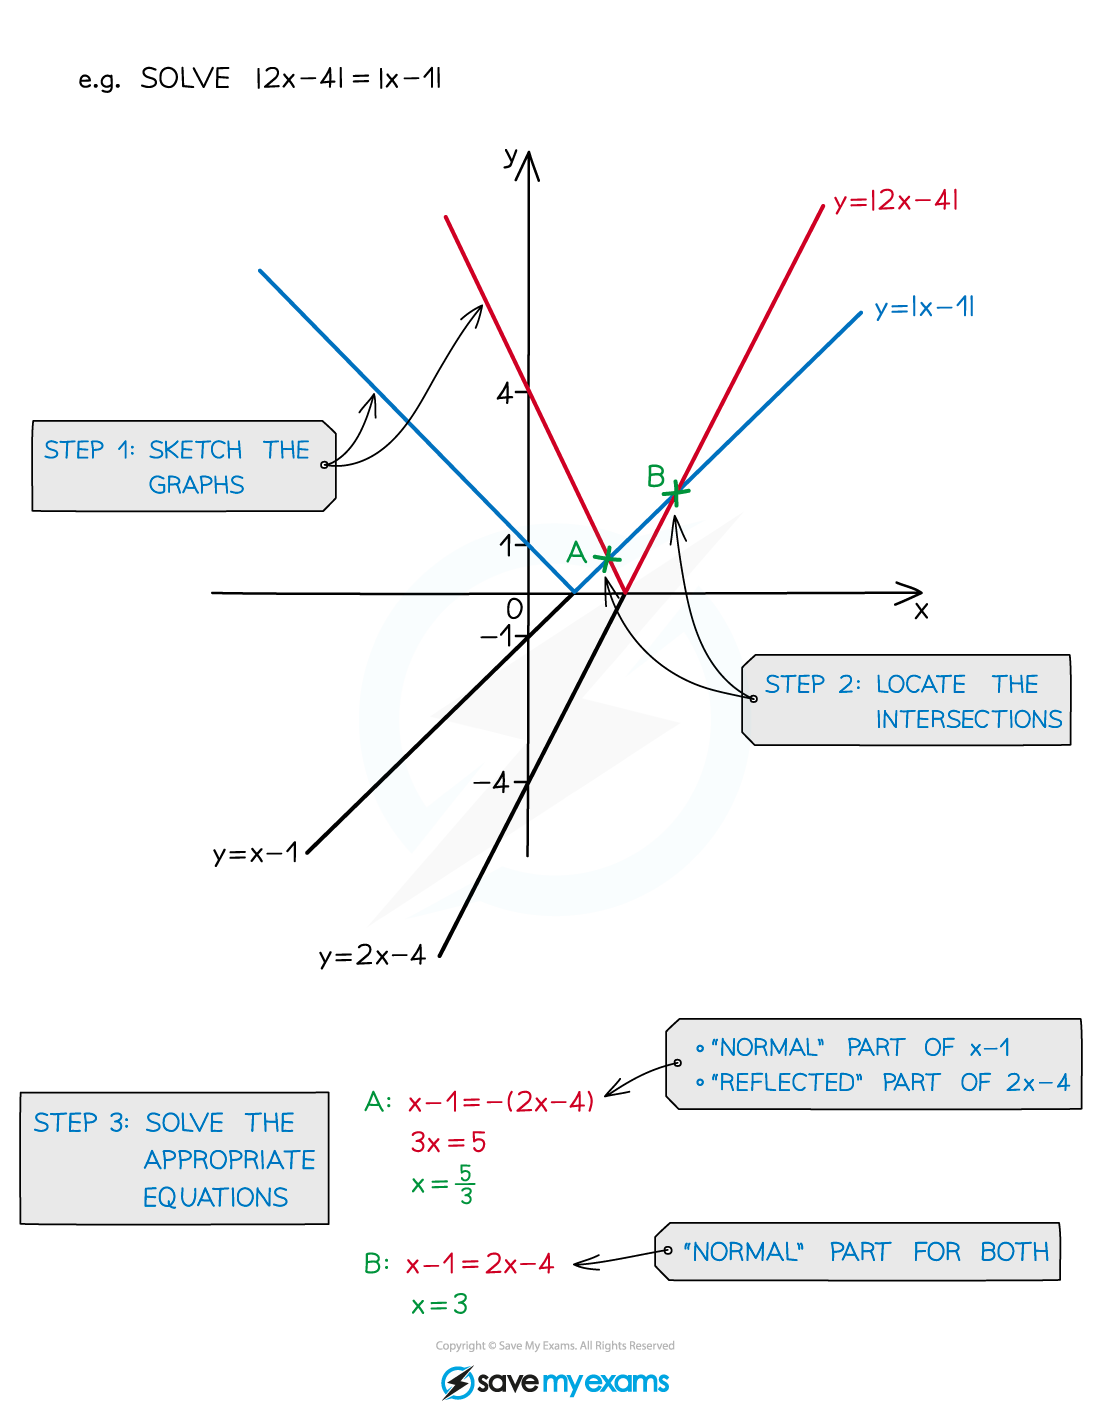
How do I solve modulus equations?
STEP 1 Sketch the graphs including any modulus (reflected) parts
STEP 2 Locate the graph intersections
STEP 3
Determine which part of each graph ('normal' or 'reflected' part) is needed to solve the equation Solve the appropriate equation(s)

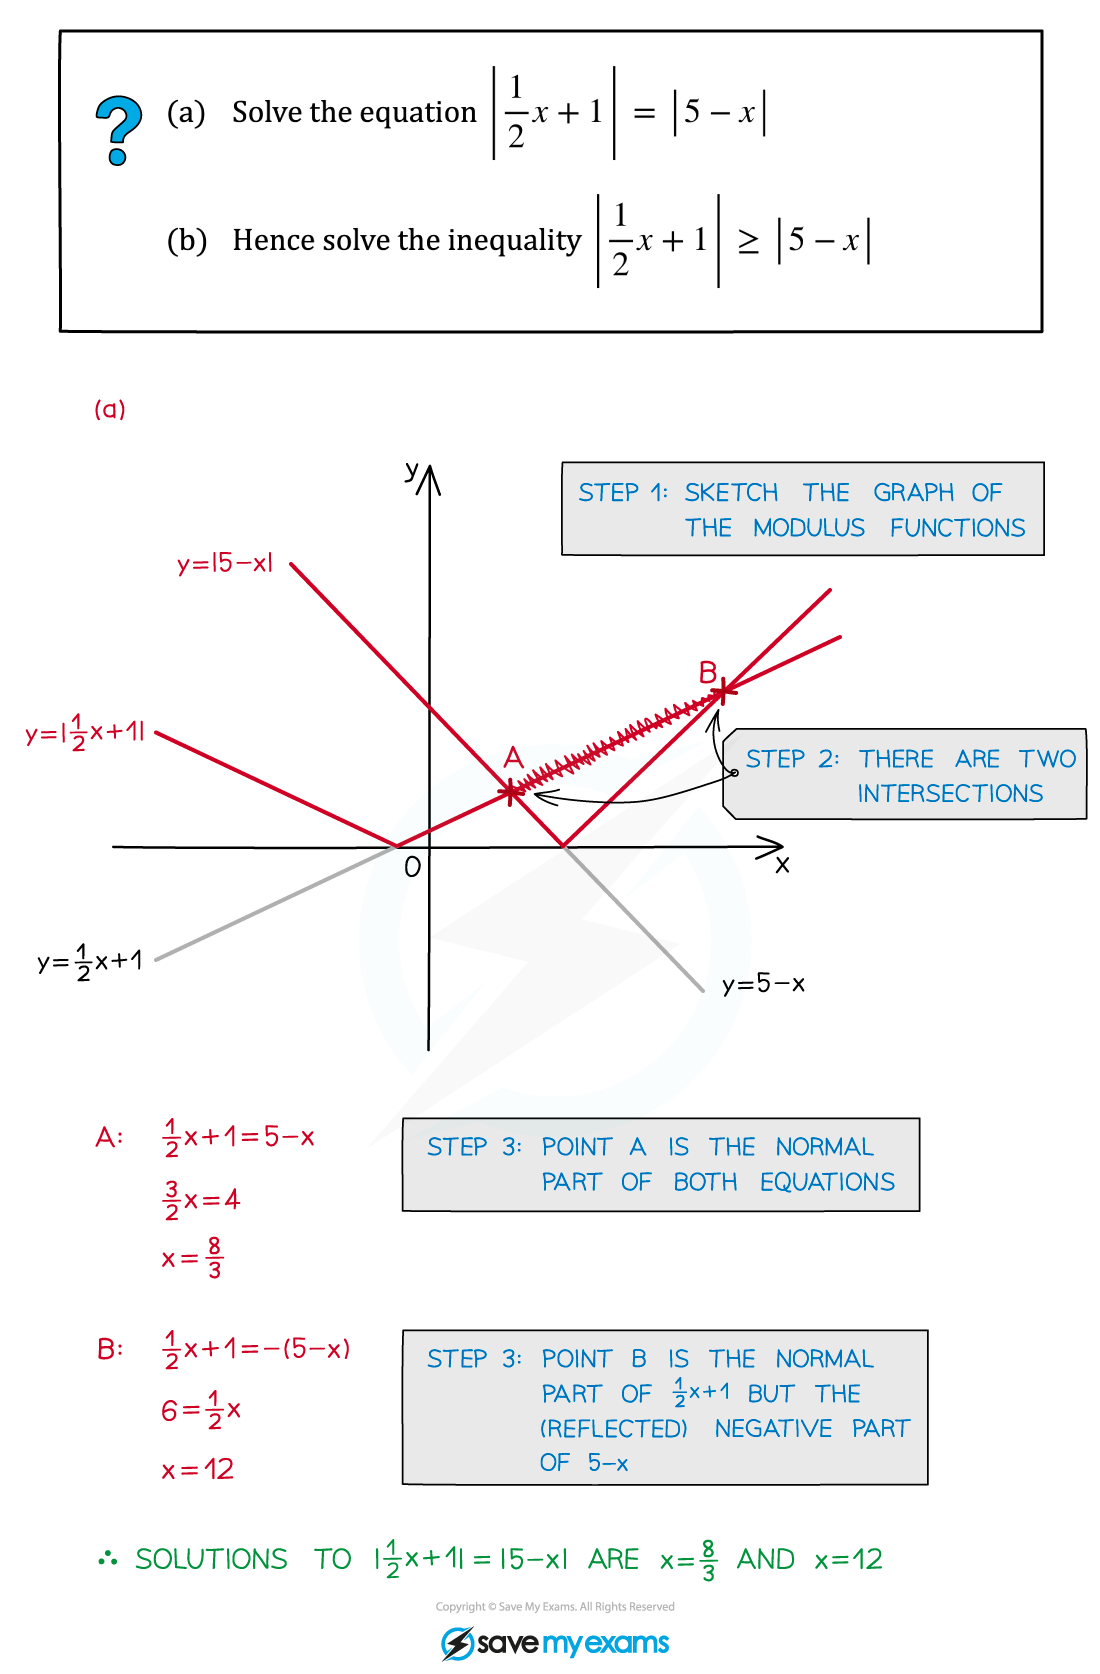
How do I solve modulus inequalities?
The process is very similar to that as solving equations - with the graph sketching being essential
STEP 1 Sketch the graph(s) including any modulus (reflected) parts
STEP 2 Locate the graph intersections (or -axis intercepts if zero on one side)
STEP 3 Determine which part(s) of the graph(s) satisfy the inequality (highlight any on the graph) Find the intersections (by solving equation(s))
STEP 4 Write the final answer(s) down, being careful with the use of <, >, ≤ and/or ≥

Examiner Tips and Tricks
Sketching the graphs is important as solving algebraically can lead to invalid solutions
For example, x = 1 is a solution to
but
is not a solution to
(substitute x = 1 into both sides and see why it does not work)
Worked Example


You've read 0 of your 5 free revision notes this week
Unlock more, it's free!
Did this page help you?