
One of the most challenging statistics topics in GCSE Maths is histograms. In my experience, students tend to overcomplicate histograms by trying to memorise different formulas. Let’s look at what histograms are and help you master this topic.
Introduction to histograms
A histogram is a statistical diagram that is used to visualise grouped, continuous data. Histograms look similar to bar charts, and this is where some misconceptions can creep in. The variable for the data is represented on the horizontal axis for both a bar chart and a histogram. The differences between the two types of diagrams are summarised below.
Bar charts | Histograms |
|---|---|
Used for discrete data | Used for grouped, continuous data |
Gaps between the bars | There are no gaps between the bars |
Frequency is the height of a bar | Frequency is the area of a bar |
The vertical axis represents the frequency | The vertical axis represents the frequency density |
Understanding frequency in histograms
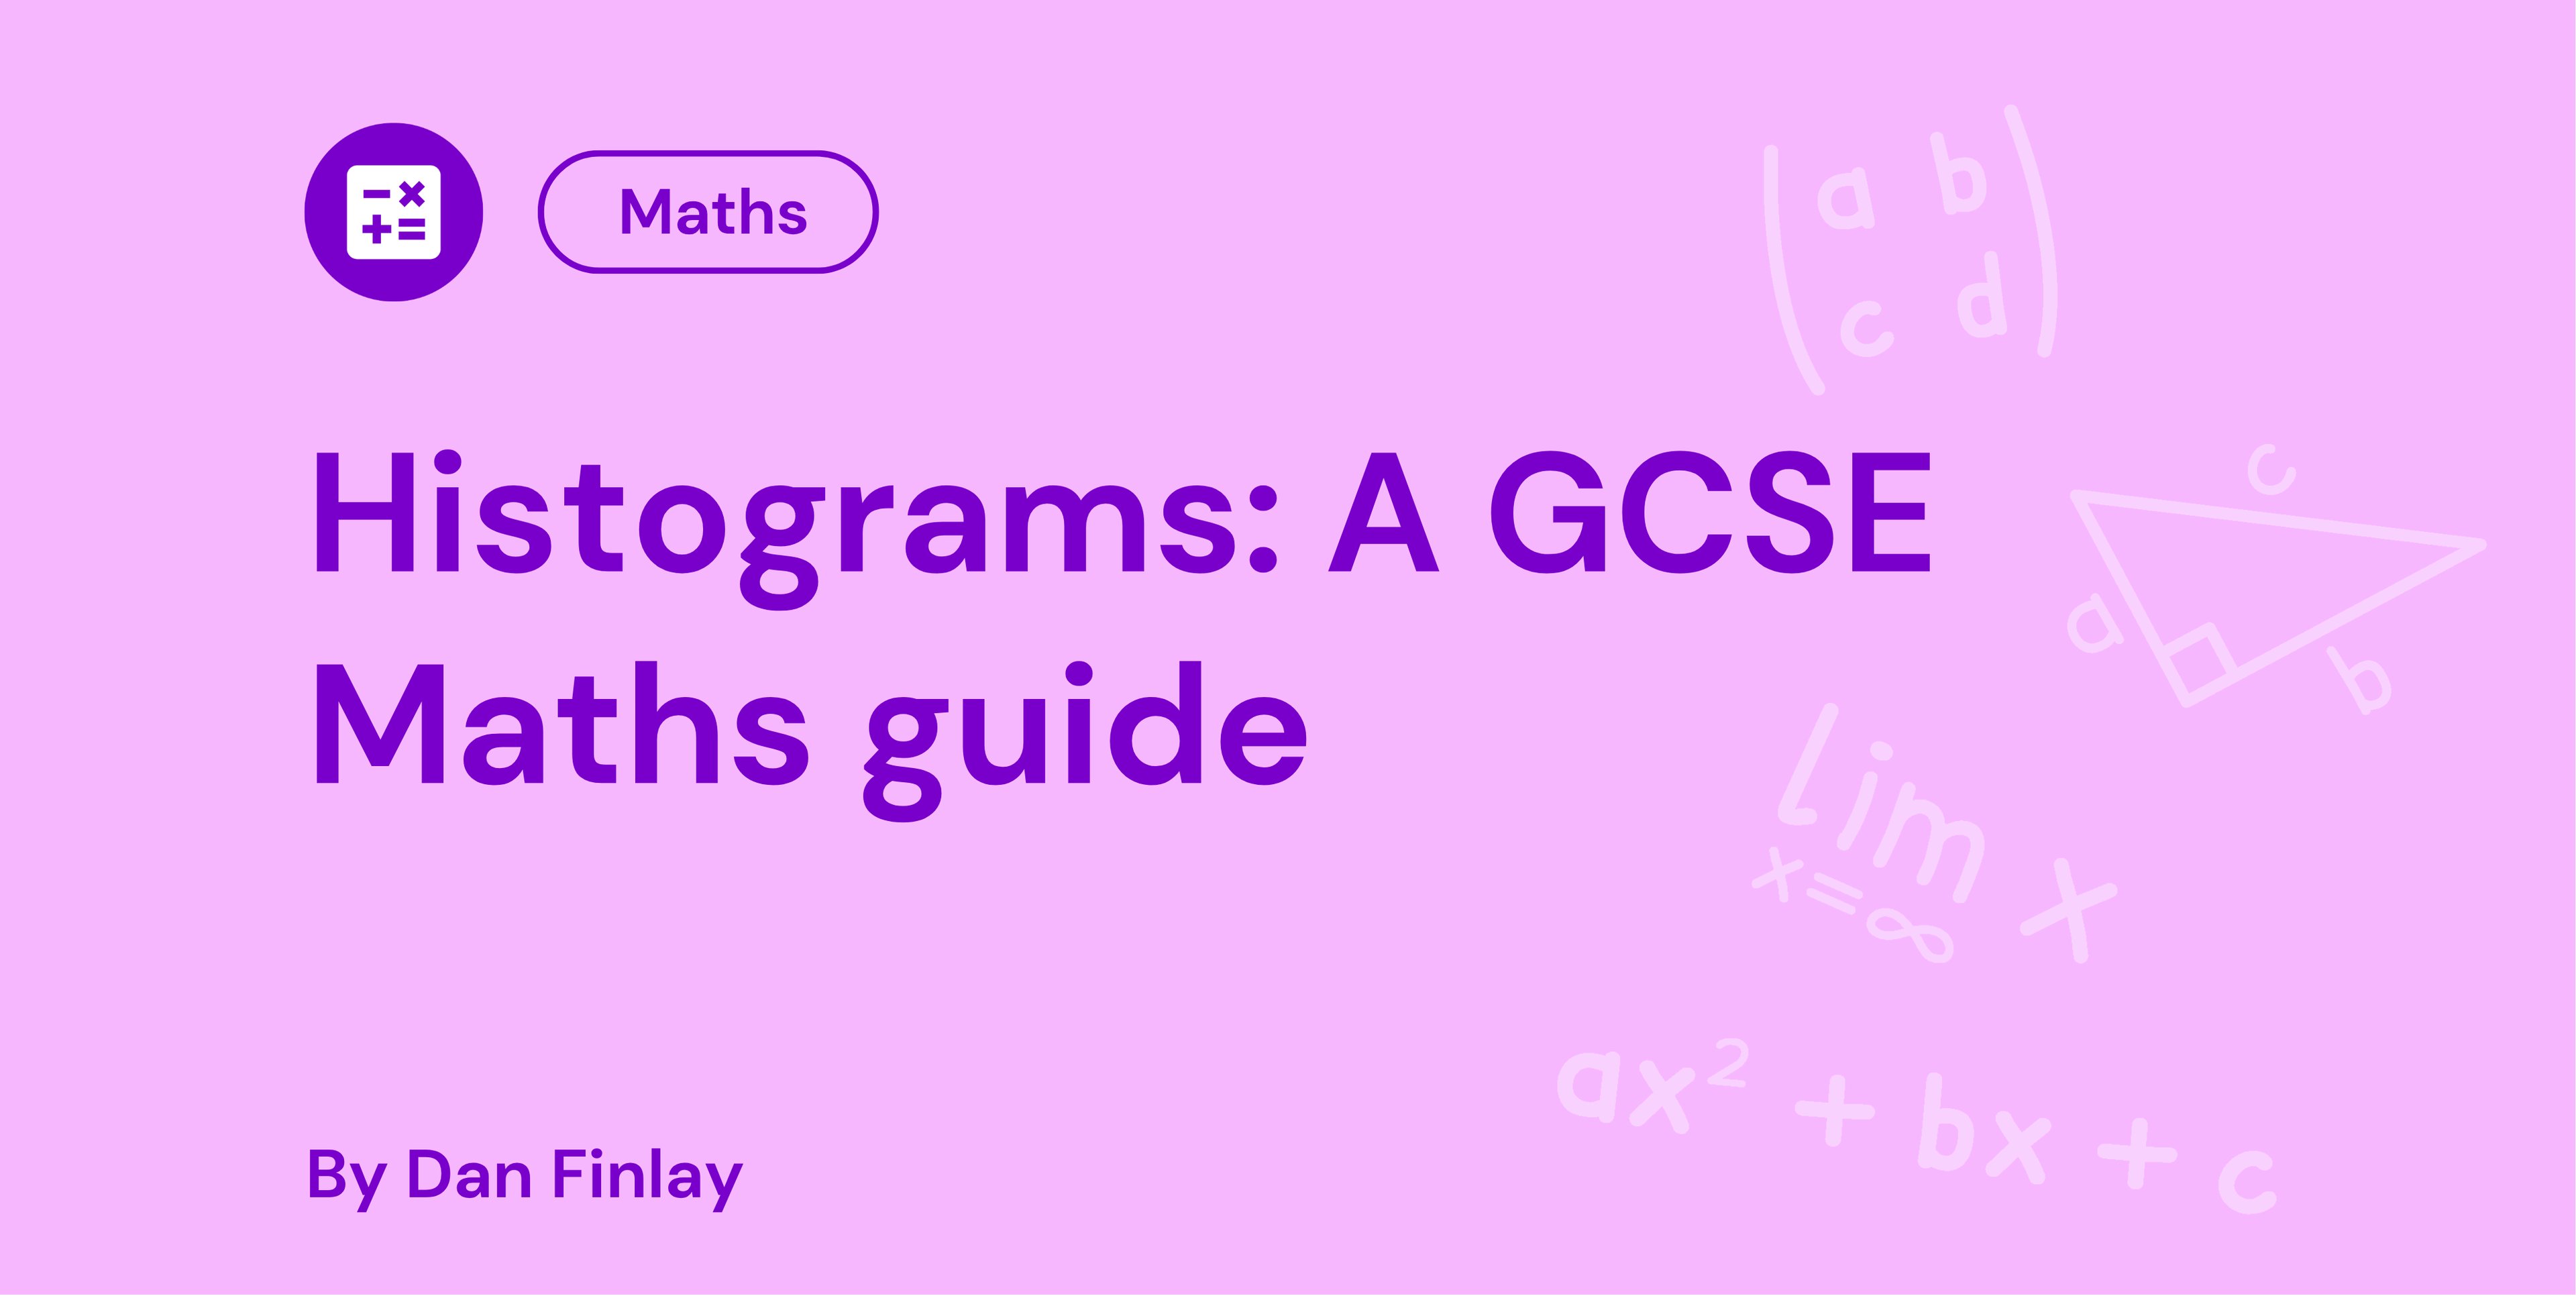
You might wonder why we do not use the frequency for the height of the bars on a histogram. Let’s consider an example to illustrate why this would cause histograms to look misleading. Suppose we have the following data for the speeds of cars as they pass a traffic camera.
Speed (s mph) | Frequency |
|---|---|
0 ≤ s < 10 | 10 |
10 ≤ s < 40 | 15 |
Let’s see how this looks when we use the frequency for the vertical axis.
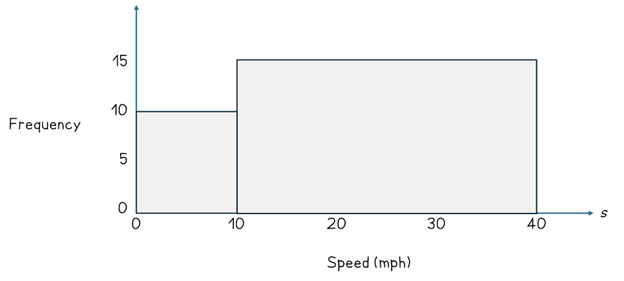
You might not spot why it is misleading straightaway. The issue is because the widths of the groups (also known as classes) are not equal. The first one has a width of 10 and the second has a width of 30. Consider what might happen if we split the second class into three equal intervals of width 10. There might be exactly 5 cars in each of the three new groups.
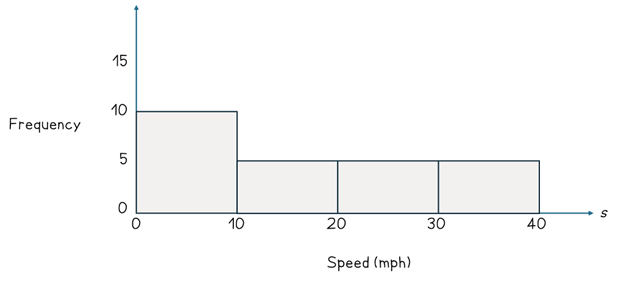
You can already see that this has changed the appearance of the diagram. We do not know for sure that the 15 cars will be shared equally into the three groups. Therefore, we cannot label the frequency as 5. Instead, we let the area of the bar represent the frequency. We call the height of the bar the frequency density, this just means the expected frequency per one unit if the data were distributed equally across each interval. You can calculate the frequency density by dividing the frequency of a class by the width of the class. When we draw the histogram using the frequency density, we can see a more suitable distribution.
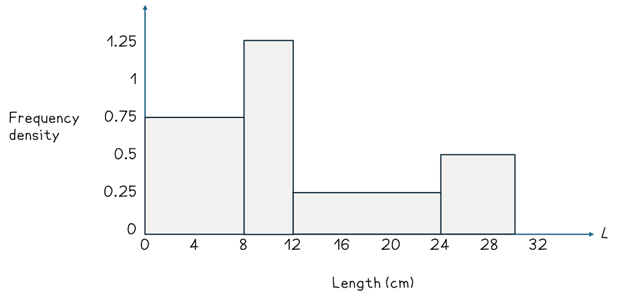
How to construct a histogram
In an exam, you could be given a frequency table of grouped data and be asked to draw a histogram. When I have marked mock exams, I have seen students rush and not read the word histogram. This resulted in them drawing a hybrid between a bar chart and a histogram. To get full marks on a question like this, follow the trusted steps below. I will use the steps to draw a histogram for the following data.
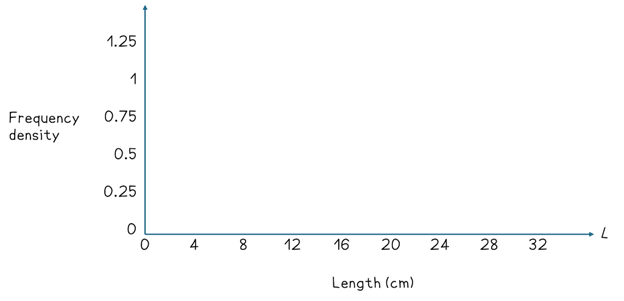
Length (L cm) | Frequency |
|---|---|
0 ≤ L < 8 | 6 |
8 ≤ L < 12 | 5 |
12 ≤ L < 24 | 3 |
24 ≤ L < 30 | 3 |
Step 1: Find the class width for each interval.
Length (L cm) | Frequency | Class width |
|---|---|---|
0 ≤ L < 8 | 6 | 8 - 0 = 8 |
8 ≤ L < 12 | 5 | 12 - 8 = 4 |
12 ≤ L < 24 | 3 | 24 - 12 = 12 |
24 ≤ L < 30 | 3 | 30 - 24 = 6 |
Step 2: Divide the frequency by the class width to find the frequency density for each interval.
Length (L cm) | Frequency | Class width | Frequency density |
|---|---|---|---|
0 ≤ L < 8 | 6 | 8 | 6 ÷ 8 = 0.75 |
8 ≤ L < 12 | 5 | 4 | 5 ÷ 4 = 1.25 |
12 ≤ L < 24 | 3 | 12 | 3 ÷ 12 = 0.25 |
24 ≤ L < 30 | 3 | 6 | 3 ÷ 6 = 0.5 |
Step 3: Choose appropriate equal scales for the variable on the horizontal axis and the frequency density on the vertical axis.
Step 4: Draw a rectangle for each class using the frequency density for the height.
Interpreting histogram data
Alternatively, you might be given a histogram and asked to complete a frequency table. I have seen students get confused when trying to rearrange the formula for frequency density. Therefore, my best tip here is to remember that the frequency is equal to the area. This might appear as a challenging topic; however, this type of question simply wants you to find the areas of rectangles. Suppose we are given the following histogram.
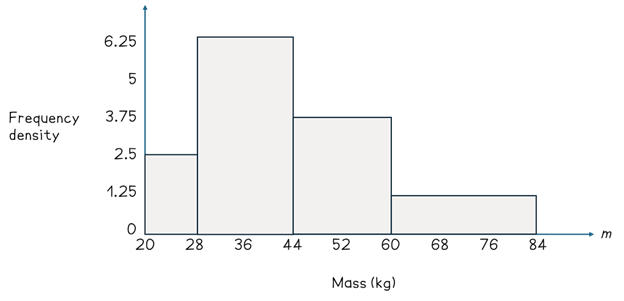
Step 1: Find the class width for each interval.
Mass (m kg) | Class width |
|---|---|
20 ≤ L < 28 | 28 - 20 = 8 |
28 ≤ L < 44 | 44 - 28 = 16 |
44 ≤ L < 60 | 60 - 44 = 16 |
60 ≤ L < 84 | 84 - 60 = 24 |
Step 2: Identify the frequency density of each class by finding the height of each bar.
Mass (m kg) | Class width | Frequency density |
|---|---|---|
20 ≤ L < 28 | 8 | 2.5 |
28 ≤ L < 44 | 16 | 6.25 |
44 ≤ L < 60 | 16 | 3.75 |
60 ≤ L < 84 | 24 | 1.25 |
Step 3: Multiply the class width by the frequency density to find the frequency (area).
Mass (m kg) | Class width | Frequency density | Frequency |
|---|---|---|---|
20 ≤ L < 28 | 8 | 2.5 | 8 × 2.5 = 20 |
28 ≤ L < 44 | 16 | 6.25 | 16 × 6.25 = 100 |
44 ≤ L < 60 | 16 | 3.75 | 16 × 3.75 = 60 |
60 ≤ L < 84 | 24 | 1.25 | 24 × 1.25 = 30 |
GCSE Maths practice questions on histograms
Let’s look at some common types of questions that are related to histograms.
AQA GCSE Mathematics November 2017 Paper 2 Higher Tier
Question 23 (opens in a new tab)
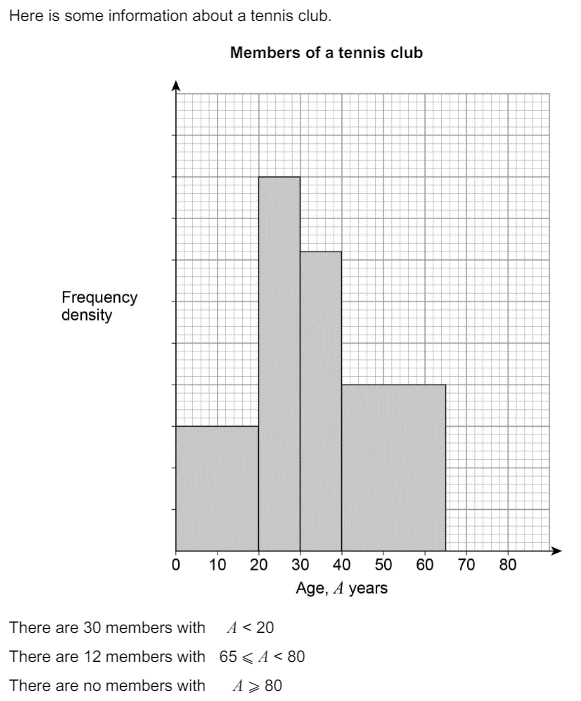
This question gives us an incomplete histogram with limited information about frequencies. Part (a) asks us to complete the histogram and part (b) asks you to find the total frequency. We are given that the first bar represents 30 members. The only formula that we need to remember is the area of a rectangle because the area is the frequency. The width is 20 and the area is 30, therefore the height must be 1.5 because 1.5 × 20 = 30. The bar goes up 3 big squares on the vertical axis, therefore each square must represent 0.5. We can now complete the scale on the vertical axis.
Once we have the scale, we can find the frequency or frequency density for the other classes.
Multiply the class width with the frequency density to find the frequency.
This is equivalent to finding the area of a rectangle.
Divide the frequency by the class width to find the frequency density.
This is equivalent to finding the height of a rectangle.
Age, A years | Class width | Frequency | Frequency density |
|---|---|---|---|
A < 20 | 20 | 30 | 1.5 |
20 ≤ A < 30 | 30 - 20 = 10 | 10 × 4.5 = 45 | 4.5 |
30 ≤ A < 40 | 40 - 30 = 10 | 10 × 3.5 = 35 | 3.5 |
40 ≤ A < 65 | 65 - 40 = 25 | 25 × 2 = 50 | 2 |
65 ≤ A < 80 | 80 - 65 = 15 | 12 | 12 ÷ 15 = 0.8 |
AQA GCSE Mathematics June 2018 Paper 3 Higher Tier
Question 26 (opens in a new tab)
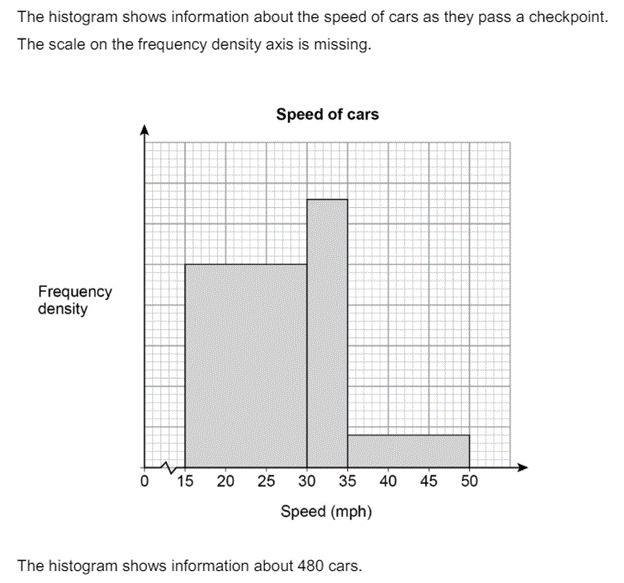
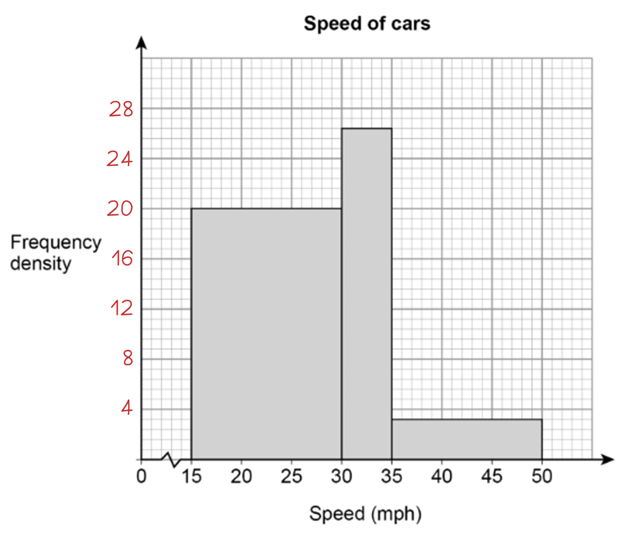
In harder questions, the total frequency might be given rather than the frequency of one class. The question asks us to find the frequency of the first class. However, let’s focus on finding the frequency density because once we have this information, the question simply wants us to find the frequency given a complete histogram.
I remember discussing this question with a tutee and they were confused about how to start it. My general advice is always if something we need is unknown then we should use algebra. If we let each small square represent k units then we can have a temporary scale.
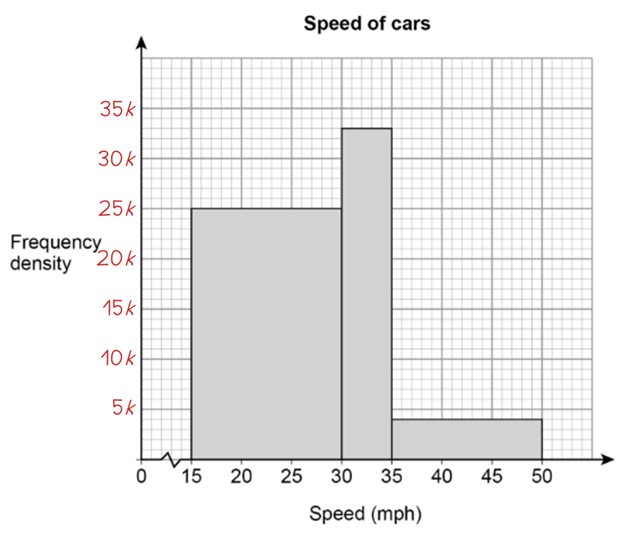
We can then work out the total area in terms of k.
(30 - 15) × 25k + (35 - 30) × 33k + (50 - 35) × 4k = 600k
However, the question gives us the total frequency, which we know is equal to the total area. Therefore we can form an equation and solve it to find the value of k.
600k = 480
k = 0.8
We can now substitute this value into the scale to get the actual frequency density.
Edexcel GCSE Mathematics November 2018 Paper 3 Higher Tier
Question 17 (opens in a new tab)
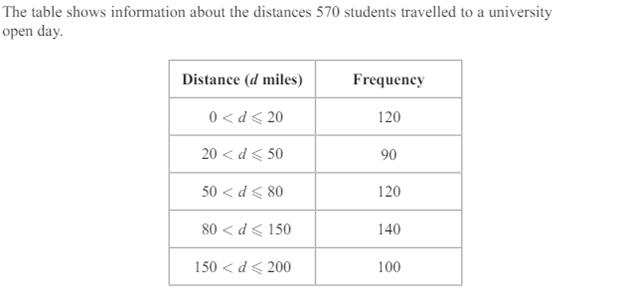
A question could first ask us to estimate the median using a histogram. Part (a) asks us to draw the histogram and part (b) asks us to estimate the median. I am confident that you can get full marks on part (a) so let’s focus on part (b).
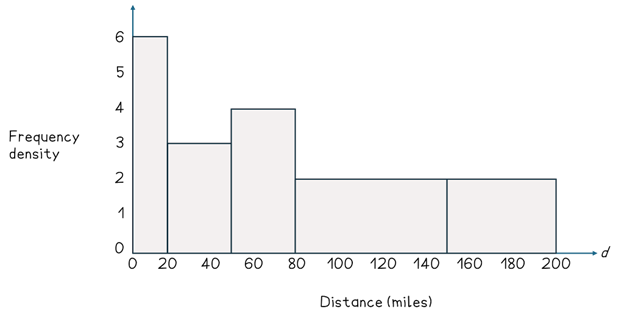
Remember that the median is the value that splits the data into two equal halves. The data is grouped so we cannot find the exact median, therefore we have to estimate the median. We can halve the total frequency (570) to get 285. Remember that the frequency is equal to the area, this means we want to draw a vertical line that splits the histogram into two halves where each has an area of 285.
The total area of the first two bars is 210 (120 + 90) and the total area of the first three bars is 330 (120 + 90 + 120). Therefore, the median is somewhere in the third bar.
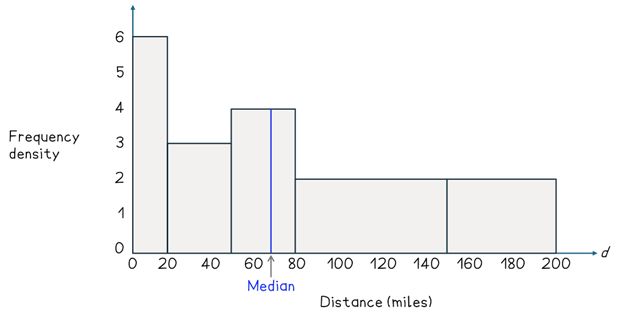
The total area to the left of the median is 285. The total area of the first two bars is 210, therefore an extra area of 75 is needed to reach the median. The height of the third bar is 4, we can use this to find the width of the rectangle that ends at the median, 18.75 (75 ÷ 4). To find an estimate of the median we simply add this width to the starting point of the interval (50) to get 68.75 miles.
A similar method can be used to estimate quartiles which then allows us to estimate the interquartile range.
Edexcel GCSE Mathematics June 2022 Paper 3 Higher Tier
Question 17b (opens in a new tab)
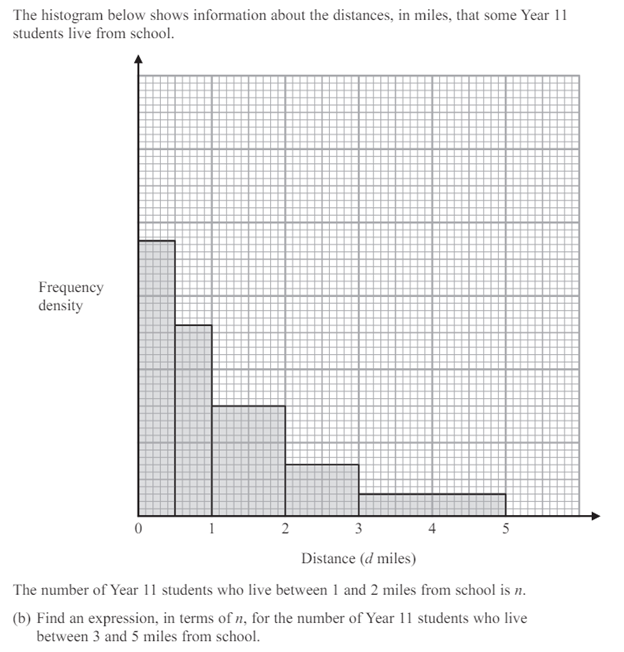
This question is a perfect example of where histogram questions look trickier than they are. In particular, this question is not really testing our histogram knowledge. The only histogram fact that we need to know is that the area is equal to the frequency. Assume each small represents one unit and find the areas of the relevant bars.
Distance | Area | Frequency |
|---|---|---|
Between 1 and 2 miles | (2 - 1) × 15 = 15 | n |
Between 3 and 5 miles | (5 - 3) × 3 = 6 | ? |
The rest of the question relies on our knowledge of ratio and proportion. We need to multiply the first area by 0.4 (6 ÷ 15) to get the area of the second bar. Therefore, we need to do the same to the frequencies. We simply multiply n by 0.4 to get that the required frequency is 0.4n.
Understand histograms for GCSE Maths success
You can master any question on histograms as long as you remember that the area of a bar is equal to the frequency of that class. The frequency density is the height of the bar and the class width is the width of the bar. If you get a challenging question, it is always good to start by calculating the area of any rectangles.
Here at Save My Exams, we develop high-quality, affordable revision resources; consider signing up for a Save my Exams subscription to help you get the most out of your revision. We support over 1.5 million students each month in preparing for their exams and achieving successful results, we’d love to help you too.
Sign up for articles sent directly to your inbox
Receive news, articles and guides directly from our team of experts.

Share this article

 written revision resources that improve your