Identifying Graphical Relationships (Edexcel International AS Physics) : Revision Note
Identifying Graphical Relationships
Graphs are used to visualise the relationship between two sets of data from two different variables
Common relationships are:
Directly proportional
Inversely proportional
A direct proportionality relationship is where as one amount increases, another amount increases at the same rate
This is represented by a straight-line graph with a positive gradient
For two variables, y and x this looks like:
y ∝ x
An inverse proportionality relationship is where as one amount increases, another amount decreases at the same rate
This is represented by a curved graph with a decreasing gradient
For two variables, y and x this looks like:
y ∝

Sketched graphs show relationships between variables
In the first sketch graph, above you can see that the relationship is a straight line going through the origin
This means as you double one variable the other variable also doubles so we say the independent variable is directly proportional to the dependent variable
The second sketched graph shows a shallow curve
This is the characteristic shape when two variables have an inversely proportional relationship
The third sketched graph shows a straight horizontal line,
This means as the independent variable (x-axis) increases the dependent variable does not change or is constant
Worked Example
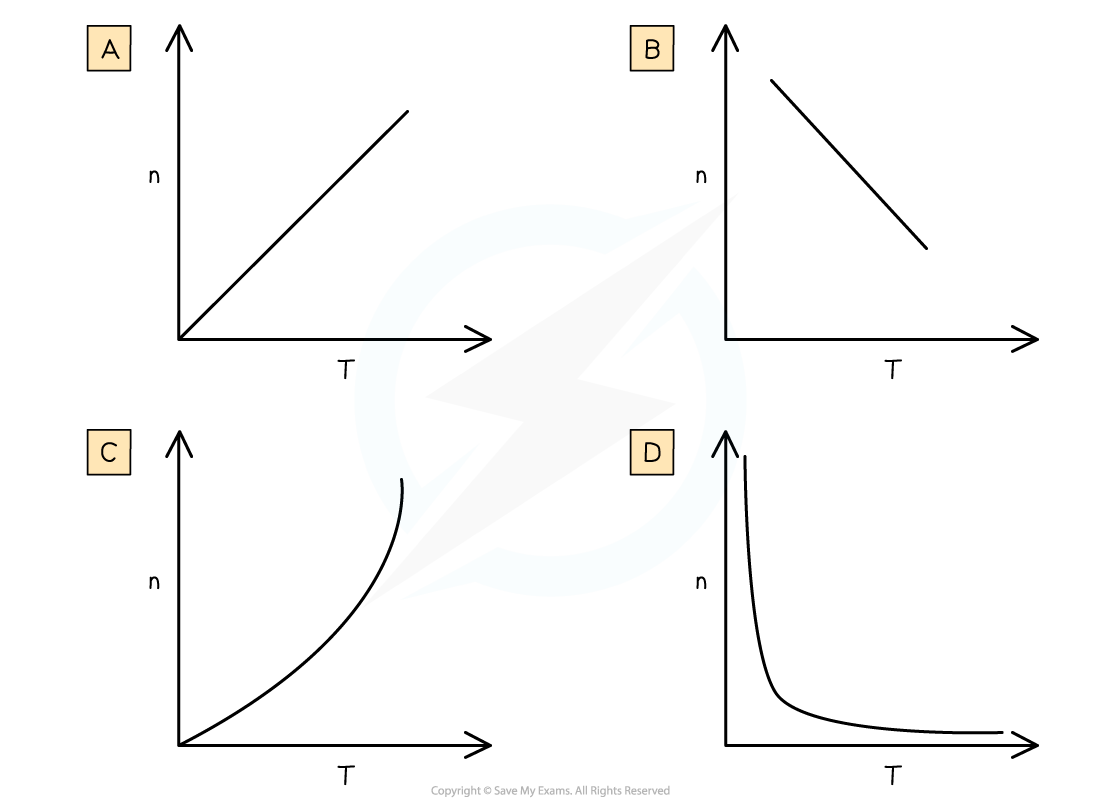
Which graph shows the correct relationship between the number of moles of a gas, n, and the temperature, T, at constant pressure and volume?

Answer: D
The Ideal Gas Equation is PV= nRT
If P, V and R are constant then
= nT = a constant
n must be inversely proportional to T
This is graph D
Examiner Tips and Tricks
The best way to know the relationship between two variables is by looking at an equation that links them together, and check that the other variables are constant if one of the variable changes.
Try and use the terms 'directly proportional' or 'inversely proportional' when describing the relationships in exam answer instead of 'as variable x increases then variable y also increases'.

You've read 1 of your 5 free revision notes this week
Unlock more, it's free!
Did this page help you?


