Stress-Strain Graphs (Edexcel International AS Physics) : Revision Note
Stress-Strain Graphs
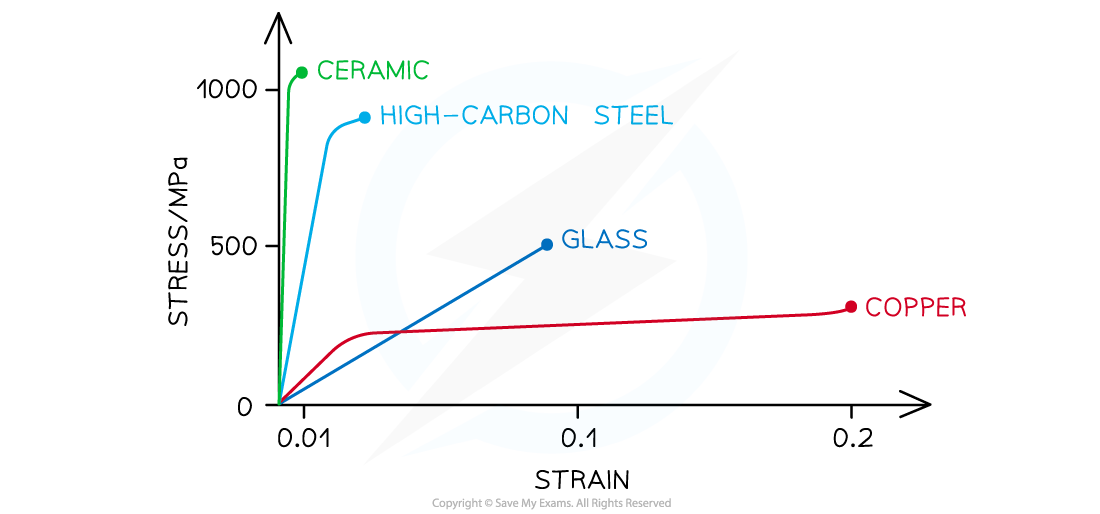
Stress-strain curves give an indication of the properties of materials such as
Up to what stress and strain they obey Hooke's Law
Whether they exhibit elastic and/or plastic behaviour
The value of their Young Modulus
The value of their breaking stress
Each material has a unique stress-strain curve

Stress-strain graph for different materials up to their breaking stress
Comparing Force-Extension to Stress-Strain Graphs
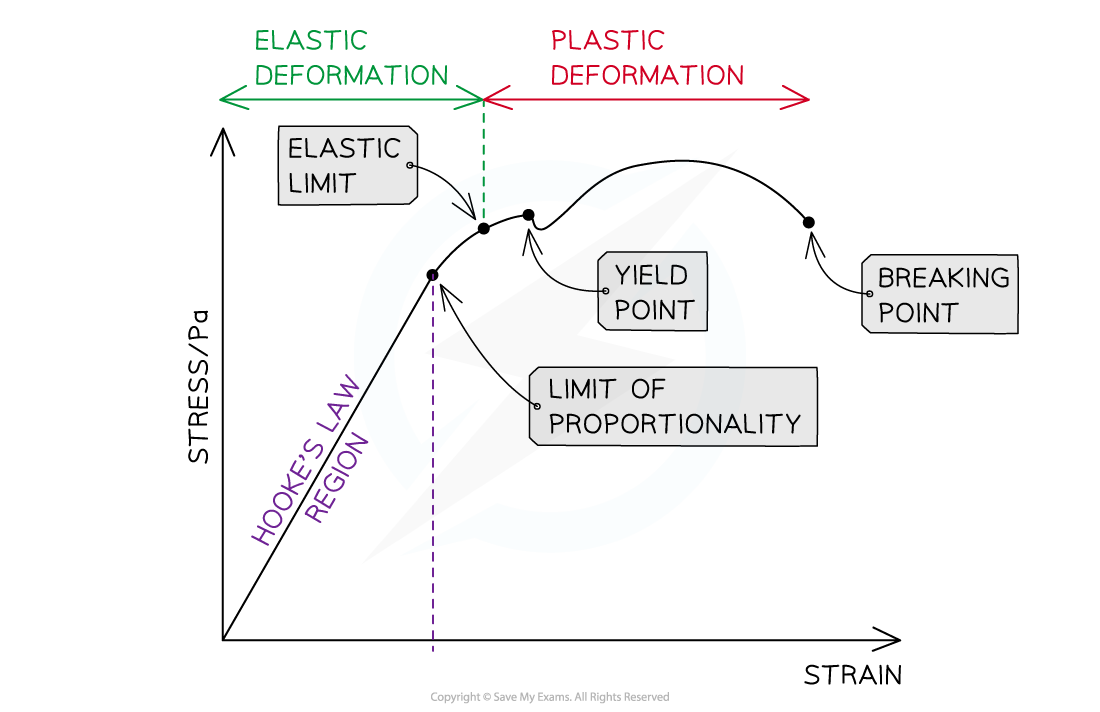
The key features of the graph which are also on the force-extension graph are:
Limit of proportionality, beyond which Hooke's law no longer applies
The elastic limit, before which a material returns to its original length or shape when the deforming force is removed
The yield point beyond which the material continues to stretch (more strain is seen) even though no extra force is being applied to it (without additional stress)
Elastic deformation where the material will return to its original shape when the load is removed
Plastic deformation where the material will not return to its original shape when the load is removed

The important points shown on a stress-strain graph
The stress-strain graph is also used to find;
The Young Modulus is found from the gradient of the straight part of the graph
Breaking stress (also called fracture stress) is the stress at the point where the material breaks
At the yield point the atoms in the material had started to move relative to each other, at the breaking stress they separate completely
Breaking stress is not the same as ultimate tensile stress which is marked on many graphs
Worked Example
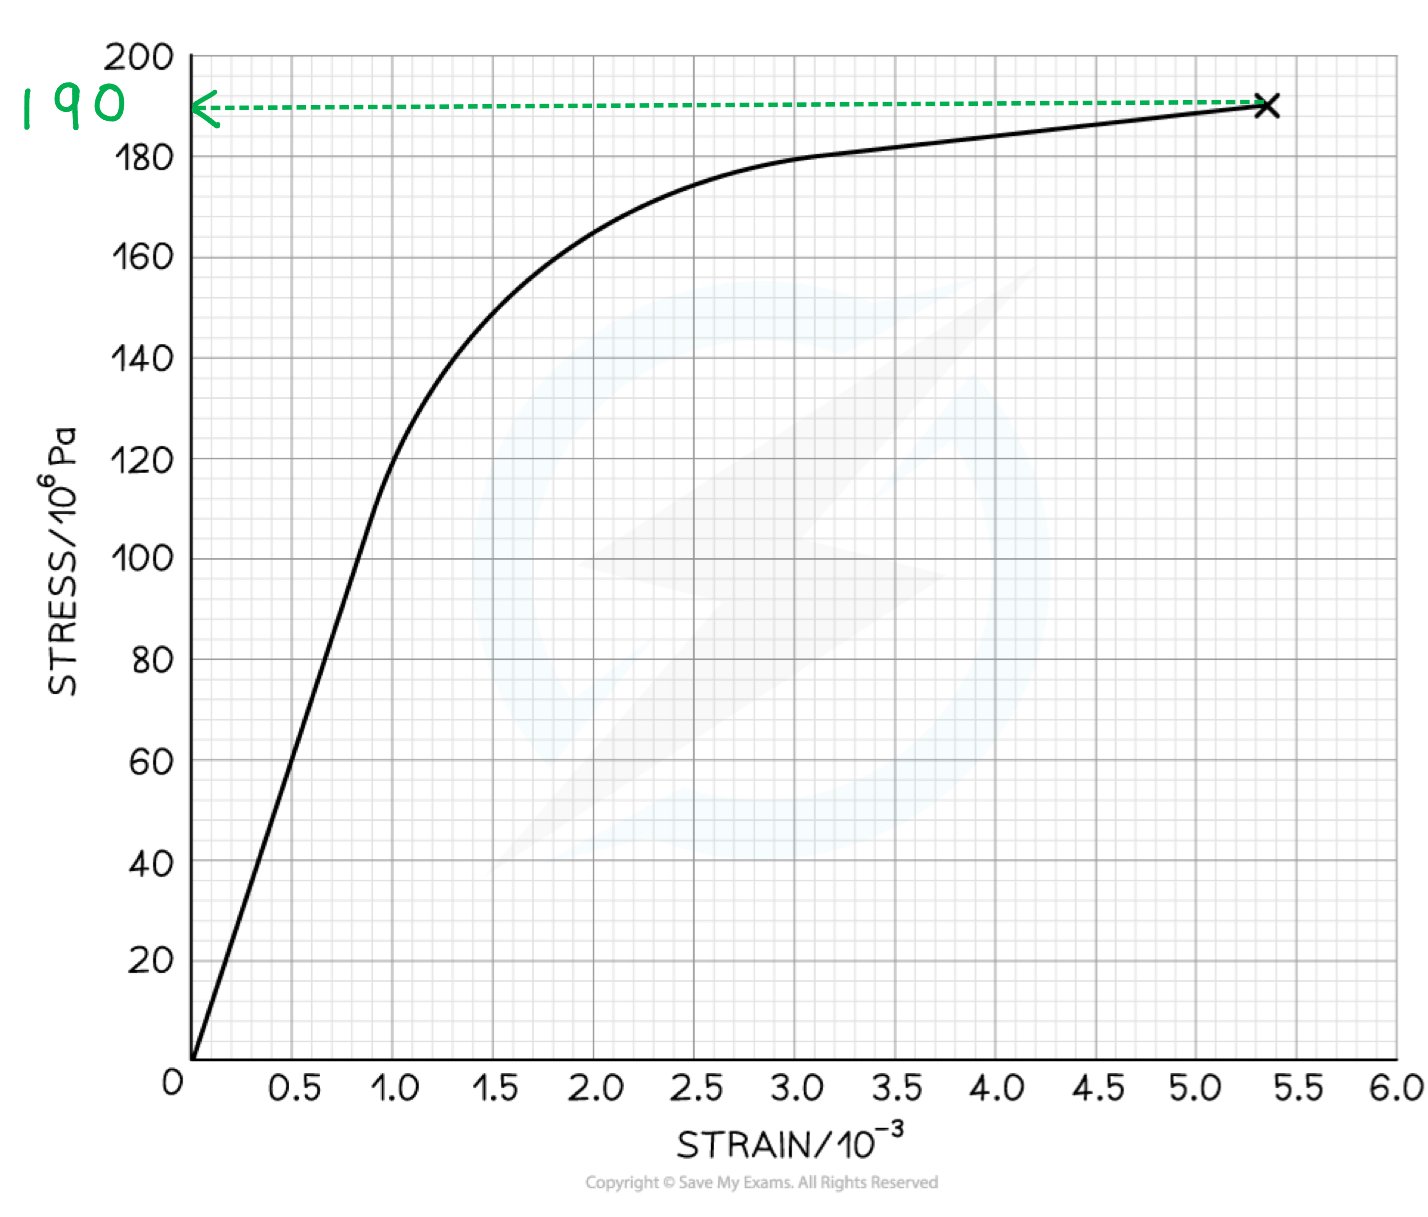
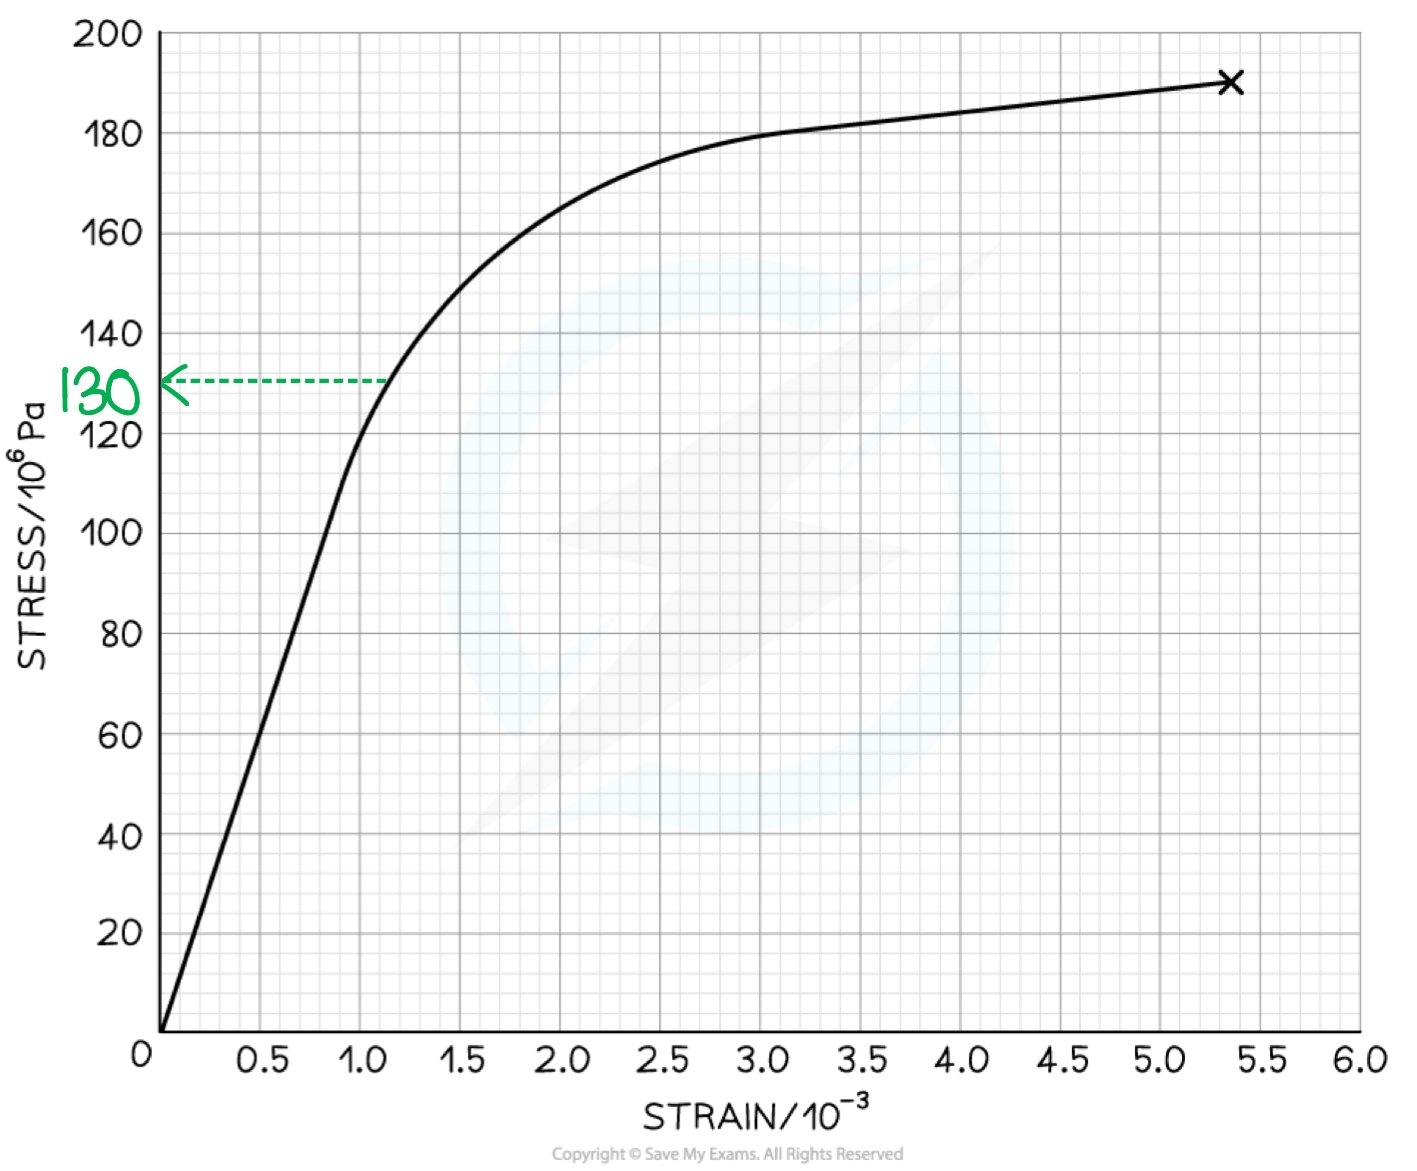
The graph below shows a stress-strain curve for a copper wire.

From the graph, state the value of:
(a) The breaking stress
(b) The stress at which plastic deformation begins
Answer:
Part (a)
Step 1: Define breaking stress
The breaking stress is the maximum stress a material can stand before it fractures. This is the stress at the final point on the graph
Step 2: Determine breaking stress from the graph
Draw a line to the y axis at the point of fracture

The breaking stress is 190 MPa
Part (b)
Step 1: Define plastic deformation
Plastic deformation is when the material is deformed permanently and will not return to its original shape once the applied force is removed
This is shown on the graph where it is curved
Step 2: Determine the stress of where plastic deformation beings on the graph
Draw a line to the y axis at the point where the graph starts to curve

Plastic deformation begins at a stress of 130 MPa
Examiner Tips and Tricks
It is a very common exam question to be asked to define some of the key points on this graph, or to identify them from a graph.
Make sure you have cleared up exactly what the differences are between the limit of proportionality, elastic limit and yield point. It's easy to get confused between them so practice sketching the graph, and labelling the points with their definitions.

You've read 0 of your 5 free revision notes this week
Sign up now. It’s free!
Did this page help you?
