Anomalous Readings (Edexcel International A Level (IAL) Physics) : Revision Note
Anomalous Readings
Experimental errors (also known as operator errors or ‘one off’ errors) will affect the results of an experiment and can produce anomalies
These anomalies should be identified during the evaluation of results and before drawing conclusions
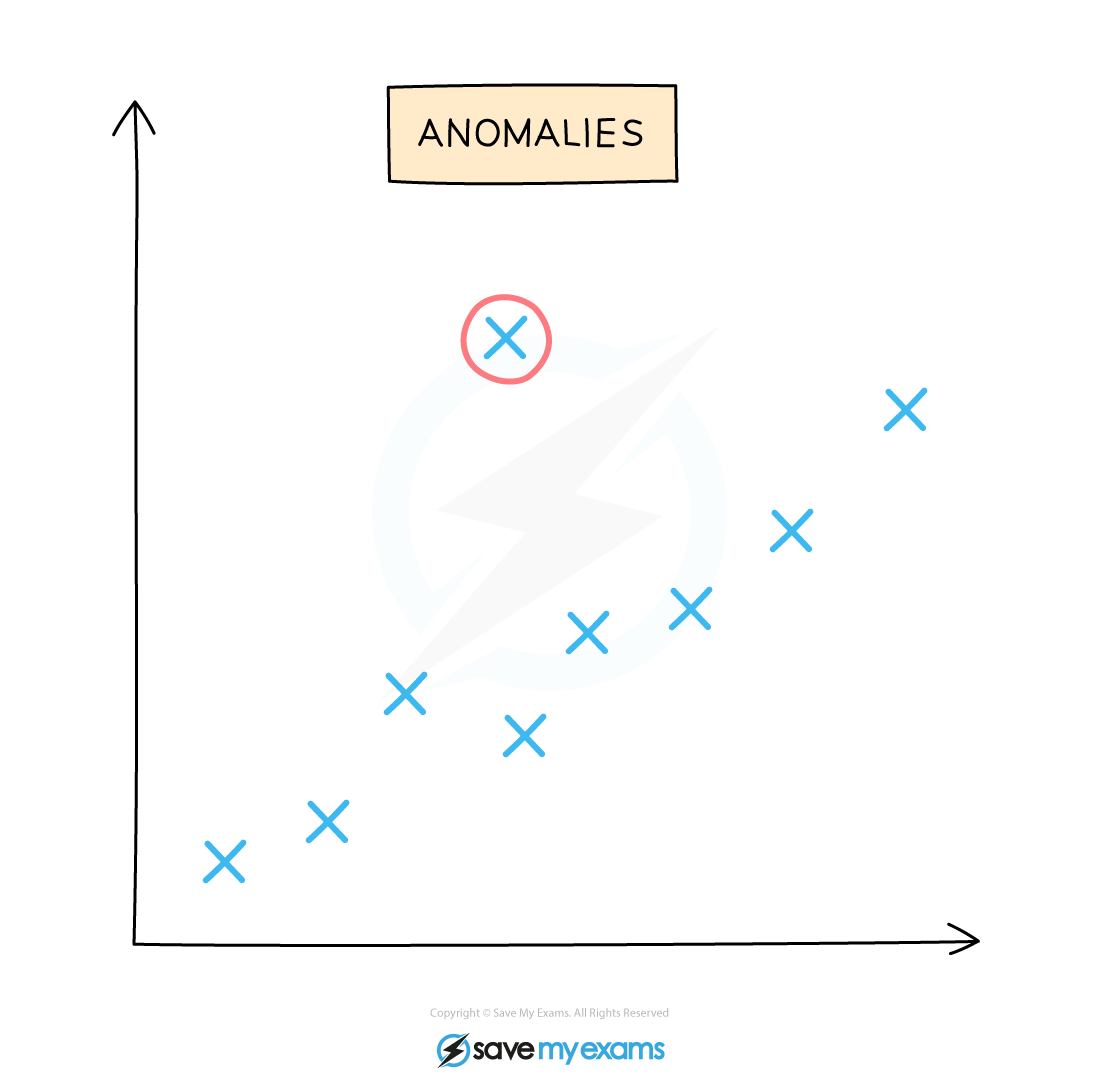
Anomalies can be identified by looking for results or data points on a graph that do not fit with the trend or with other repeat readings carried out during the experiment
These anomalous results will show a larger difference from the mean than the rest of the results (a result is often taken to be anomalous if it differs from the mean result by more than 10%)
The results or ‘data’ collected from an experiment can be made more reliable if the experiment is repeated several times and anomalies are removed
This, in turn, allows more valid conclusions to be drawn
Anomalous results are always inconsistent with other readings e.g., a point that is not on the line of best fit of a graph

Identifying an anomalous result from a graph
If an anomaly occurs in the experiment:
Ignore this value when calculating the mean
Repeat this measurement
Worked Example
A student achieves a set of repeat readings for the current through a bulb.
2.5 mA | 2.8 mA | 6.1 mA | 2.0 mA | 2.3 mA |
Calculate the mean current through the bulb.
Answer:
Step 1: Identify the anomalous result
The only result that doesn't fit with the rest of the data is 6.1 mA
This can be ignored when calculating the mean
Step 2: Calculate the mean current
Mean current = = 2.4 mA
Examiner Tips and Tricks
When calculating the mean of some repeat readings for data given in your practical paper, always ignore any anomalous readings that are inconsistent when calculating the mean.

You've read 0 of your 5 free revision notes this week
Sign up now. It’s free!
Did this page help you?
