Resonance Graphs (Edexcel International A Level (IAL) Physics): Revision Note
Exam code: YPH11
Resonance Graphs
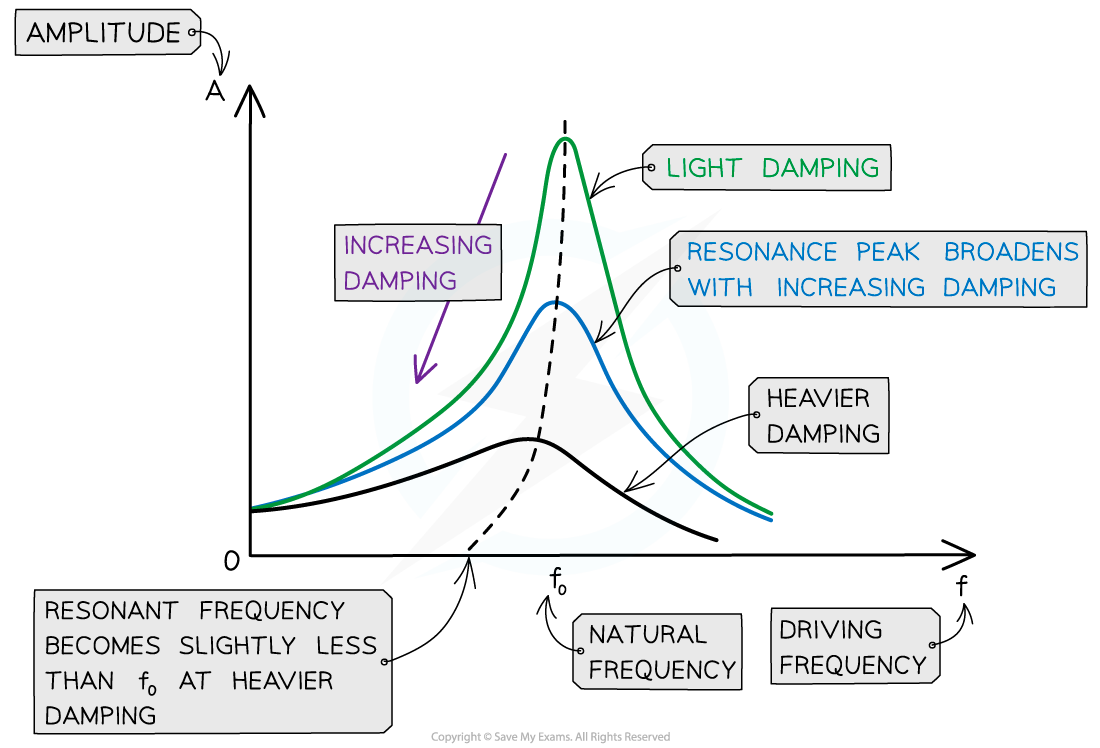
A graph of driving frequency f against amplitude A of oscillations is called a resonance curve. It has the following key features:
When f < f0, the amplitude of oscillations increases
At the peak where f = f0, the amplitude is at its maximum. This is resonance
When f > f0, the amplitude of oscillations starts to decrease

The maximum amplitude of the oscillations occurs when the driving frequency is equal to the natural frequency of the oscillator
Damping & Resonance
Damping reduces the amplitude of resonance vibrations
The height and shape of the resonance curve will therefore change slightly depending on the degree of damping
Note: the natural frequency f0 of the oscillator will remain the same
As the degree of damping is increased, the resonance graph is altered in the following ways:
The amplitude of resonance vibrations decrease, meaning the peak of the curve lowers
The resonance peak broadens
The resonance peak moves slightly to the left of the natural frequency when heavily damped
Therefore, damping reduced the sharpness of resonance and reduces the amplitude at resonant frequency

As damping is increased, resonance peak lowers, the curve broadens and moves slightly to the left

Unlock more, it's free!
Did this page help you?