Charge & Discharge Curves (Edexcel International A Level (IAL) Physics) : Revision Note
Charge & Discharge Curves
Charging Curves
Capacitors are charged by a power supply (e.g. a battery)
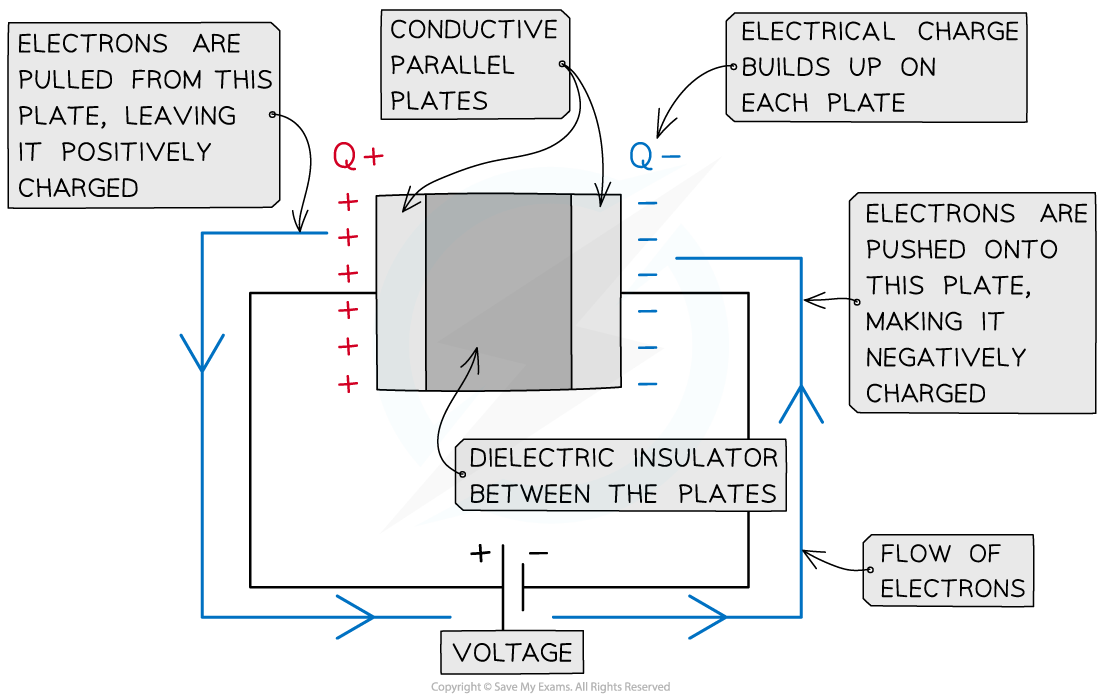
When charging, electrons are 'pulled' from the plate connected to the positive terminal of the power supply
Hence the plate nearest the positive terminal is positively charged
Oppositely, electrons are 'pushed' onto the plate connected to the negative terminal
Hence the plate nearest the negative terminal is negatively charged
As the negative charge builds up, fewer electrons are pushed onto the plate due to electrostatic repulsion from the electrons already on the plate
When no more electrons can be pushed onto the negative plate, the charging stops

A parallel plate capacitor is made up of two conductive plates with opposite charges building up on each plate
At the start of charging, the current is large and gradually falls to zero as the electrons stop flowing through the circuit
The current decreases exponentially
This means the rate at which the charge decreases is proportional to the amount of charge it has left
Since an equal but opposite charge builds up on each plate, the potential difference between the plates slowly increases until it is the same as that of the power supply
Therefore, the charge stored on the capacitor plates increases until the potential difference across the plates matches that of the power supply

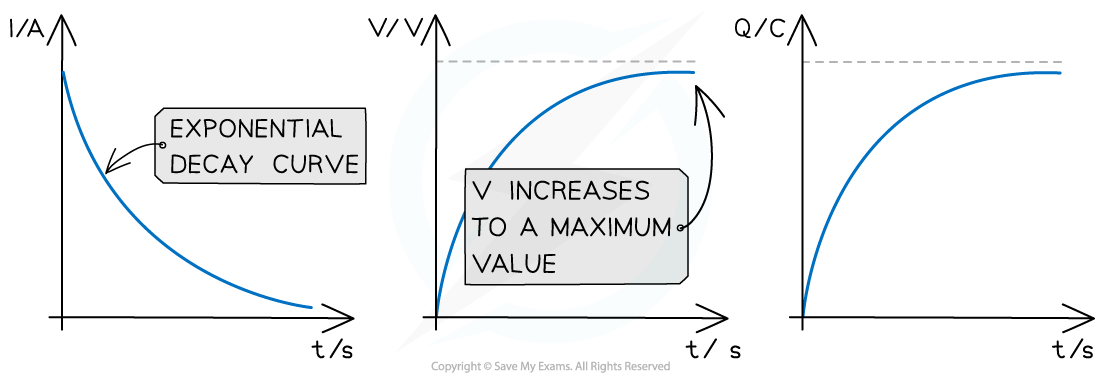
Graphs of variation of current, p.d and charge with time for a capacitor charging through a battery
The key features of the charging graphs are:
The shapes of the p.d. and charge against time graphs are identical
The current against time graph is an exponential decay curve
The initial value of the current starts on the y axis and decreases exponentially
The initial value of the p.d and charge starts at 0 up to a maximum value
Discharging Curves
Capacitors are discharged through a resistor with no power supply present
The electrons now flow back from the negative plate to the positive terminal of the power supply until there is no potential difference across the capacitor plates
Charging and discharging is commonly achieved by moving a switch that connects the capacitor between a power supply and a resistor

The capacitor charges when connected to terminal P and discharges when connected to terminal Q
At the start of discharge, the current is large (but in the opposite direction to when it was charging) and gradually falls to zero
As a capacitor discharges, the current, p.d and charge all decrease exponentially
This means the rate at which the current, p.d or charge decreases is proportional to the amount of current, p.d or charge it has left
The graphs of the variation with time of current, p.d and charge are all identical and follow a pattern of exponential decay

Graphs of variation of current, p.d and charge with time for a capacitor discharging through a resistor
The key features of the discharge graphs are:
The shape of the current, p.d. and charge against time graphs are identical
Each graph shows exponential decay curves with decreasing gradient
The initial values (typically called I0, V0 and Q0 respectively) start on the y axis and decrease exponentially
The rate at which a capacitor discharges depends on the resistance of the circuit
If the resistance is high, the current will decrease more slowly and charge will flow from the capacitor plates more slowly, meaning the capacitor will take longer to discharge
If the resistance is low, the current will decrease quickly and charge will flow from the capacitor plates quickly, meaning the capacitor will discharge faster
Examiner Tips and Tricks
Make sure you're comfortable with sketching and interpreting charging and discharging graphs, as these are common exam questions. A quick summary to help you remember:
Discharging curves are all identical
Current decreases for the Charging curve (but increases for potential difference and charge stored!)
The Time Constant
The time constant of a capacitor discharging through a resistor is a measure of how long it takes for the capacitor to discharge
The definition of the time constant for a discharging capacitor is:
The time taken for the charge, current or potential difference of a discharging capacitor to decrease to 37% of its original value
Alternatively, for a charging capacitor:
The time taken for the charge or potential difference of a charging capacitor to rise to 63% of its maximum value
37% is 0.37 or 1 / e (where e is the exponential function) multiplied by the original value (I0, Q0 or V0)
This is represented by the Greek letter tau,
, and measured in units of seconds (s)
The time constant provides an easy way to compare the rate of change of similar quantities eg. charge, current and p.d.
It is defined by the equation:
= RC
Where:
= time constant (s)
R = resistance of the resistor (Ω)
C = capacitance of the capacitor (F)
For example, to find the time constant for a discharging capacitor:
Calculate 0.37V0, where V0 is the initial potential difference across it
Determine the corresponding time taken for the potential difference to decrease to that value
To find the time constant for a charging capacitor:
Calculate 0.63V0, where V0 is the maximum potential difference across it
Determine the corresponding time taken for the potential difference to rise to that value

The time constant shown on a charging and discharging capacitor
Worked Example
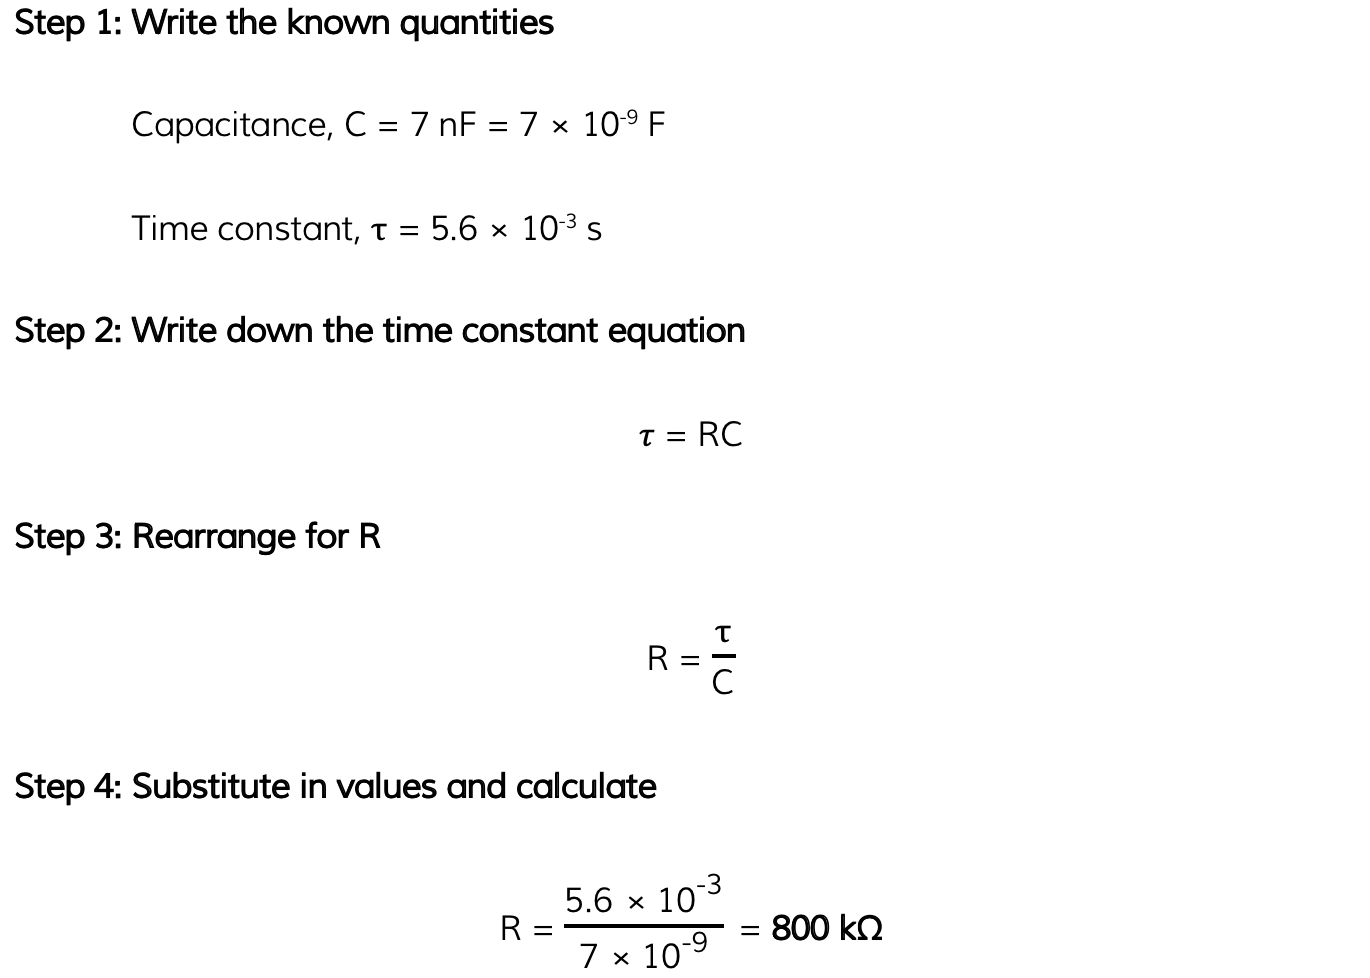
A capacitor of 7 nF is discharged through a resistor of resistance R. The time constant of the discharge is 5.6 × 10⁻³ s.
Calculate the value of R.
Answer:

Examiner Tips and Tricks
Remember to check the context of an exam question, i.e., whether the capacitor is charging or discharging. The definition of the time constant depends on it!
For a charging capacitor, the time constant refers to the time taken to reach 63% of its maximum potential difference or charge stored
For a discharging capacitor, the time constant refers to the time take to discharge to 37% of its initial potential difference or charge stored

You've read 0 of your 5 free revision notes this week
Sign up now. It’s free!
Did this page help you?
