Uncertainty & Systematic Errors (Edexcel International A Level (IAL) Physics) : Revision Note
Predicting Uncertainty & Systematic Errors
Predicting Uncertainties
The uncertainty is an estimate of the difference between a measurement reading and the true value
In other words, it is the interval within which the true value can be considered to lie with a given level of confidence or probability
Any measurement will have some uncertainty about the result, this will come from variation in the data obtained and be subject to systematic or random effects
In reality, it is impossible to obtain the true value of any quantity as there will always be a degree of uncertainty
This can be seen when you repeat a measurement and you often get different results
Uncertainties are not the same as errors
An error is the difference between the measurement result and the true value if a true value is thought to exist
This is not a mistake in the measurement
The error can be due to both systematic and random effects and an error of unknown size is a source of uncertainty.
They can be thought of as issues with equipment or methodology that cause a reading to be different from the true value
The uncertainty is a range of values around a measurement within which the true value is expected to lie, and is an estimate
For example, if the true value of the mass of a box is 950 g, but a systematic error with a balance gives an actual reading of 952 g, the uncertainty is ±2 g
The most common ways to reduce uncertainties are:
Take repeat readings (about 3 – 5) and calculate the mean of a value
For a wire, measure the diameter in different places, to make sure it's fully uniform
Use the appropriate piece of apparatus for the measurement e.g., do not use a ruler for a very small distance of a few mm, a micrometer or vernier scale would be better for this
Systematic errors
Systematic errors arise from the use of faulty instruments or from flaws in the experimental method
This type of error is repeated consistently every time the instrument is used or the method is followed, which affects the accuracy of all readings obtained
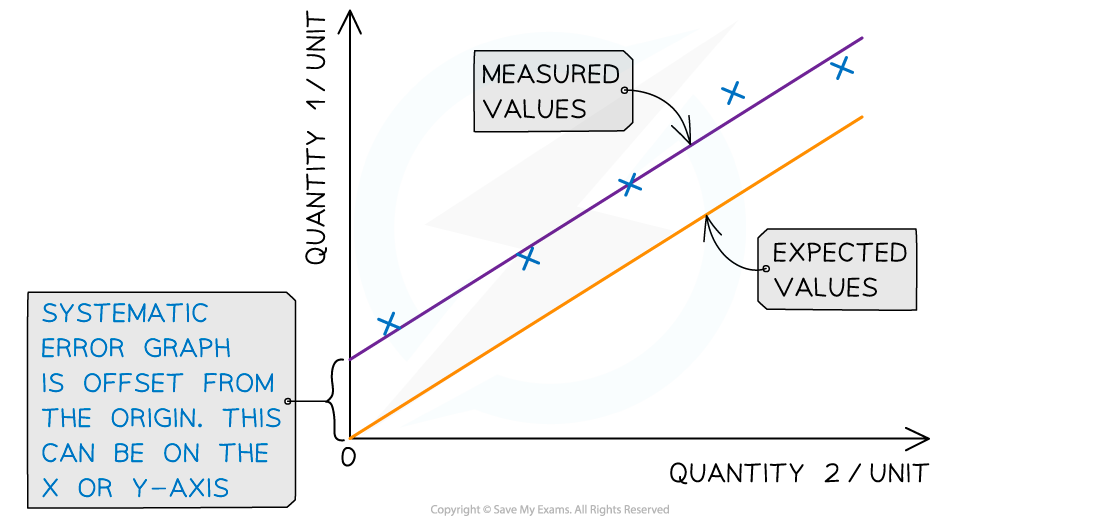
Systematic errors can clearly be seen on graphs
If the line of best fit of a straight-line graph is expected to go through the origin (0,0) but the results collected actually pass through the y or x axis instead, then all the points are offset by the same amount
The amount they are offset by is the amount of systematic errors

Systematic errors on graphs are shown by the offset of the line from the origin
To reduce systematic errors:
Instruments should be recalibrated, or different instruments should be used
Corrections or adjustments should be made to the technique
An example of a systematic error is a zero error
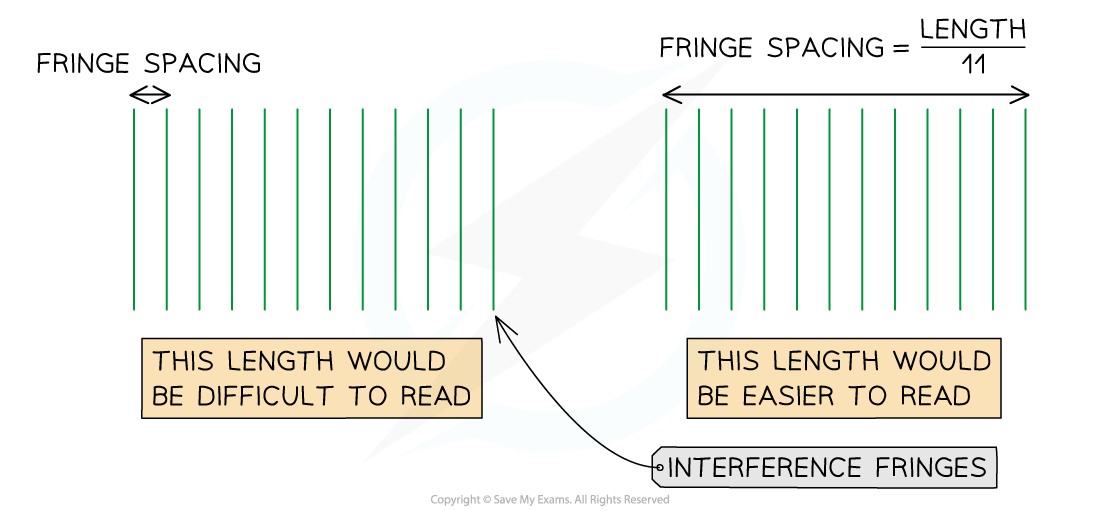
A common method for measuring small distances, such as the fringe spacing on an interference pattern, is measuring a larger distance (multiple fringe spacings) and divide by the number of fringe spacings
A fringe spacing is a very small measurement and it is often difficult to see the middle of each bright fringe (the maxima can be broad)
The same can be done for oscillations
Measuring the time for 10 oscillations, then dividing by 10 is more accurate than just timing 1 oscillation

Measuring the distance between multiple fringes reduces the uncertainty in the fringe spacing
Examiner Tips and Tricks
Extremely small or large measurements tend to have the largest uncertainties. When evaluating an experiment, think of which measurements are the most subjective, as these will provide the largest uncertainties e.g. trying to distinguish between two lines of a diffraction pattern when it is blurry or, the instrument used that has the worst resolution

You've read 0 of your 5 free revision notes this week
Sign up now. It’s free!
Did this page help you?
