Formation of Coloured Ions (Oxford AQA International A Level (IAL) Chemistry): Revision Note
Exam code: 9622
Colour in Transition Metal Ions
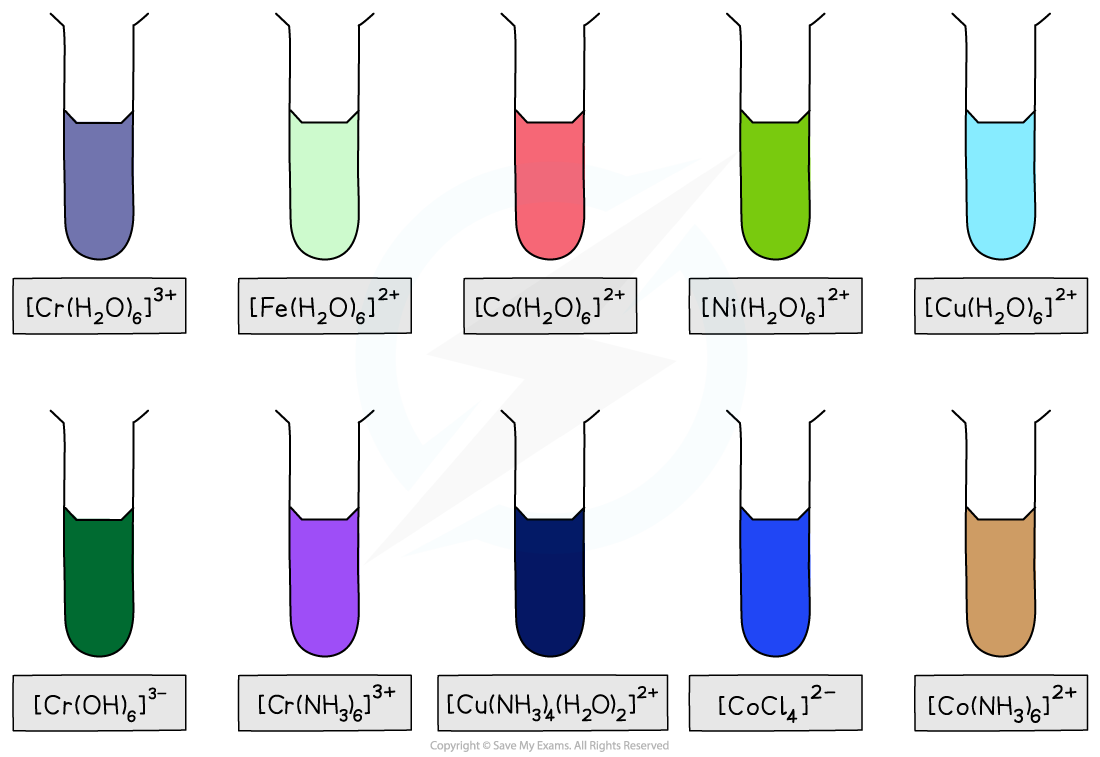
Most transition element complexes are coloured
Often, the transition metal ions can be identified by their colour
Colours of transition metal complexes

A transition element complex solution which is coloured, absorbs wavelengths of light in the visible light region of the electromagnetic spectrum
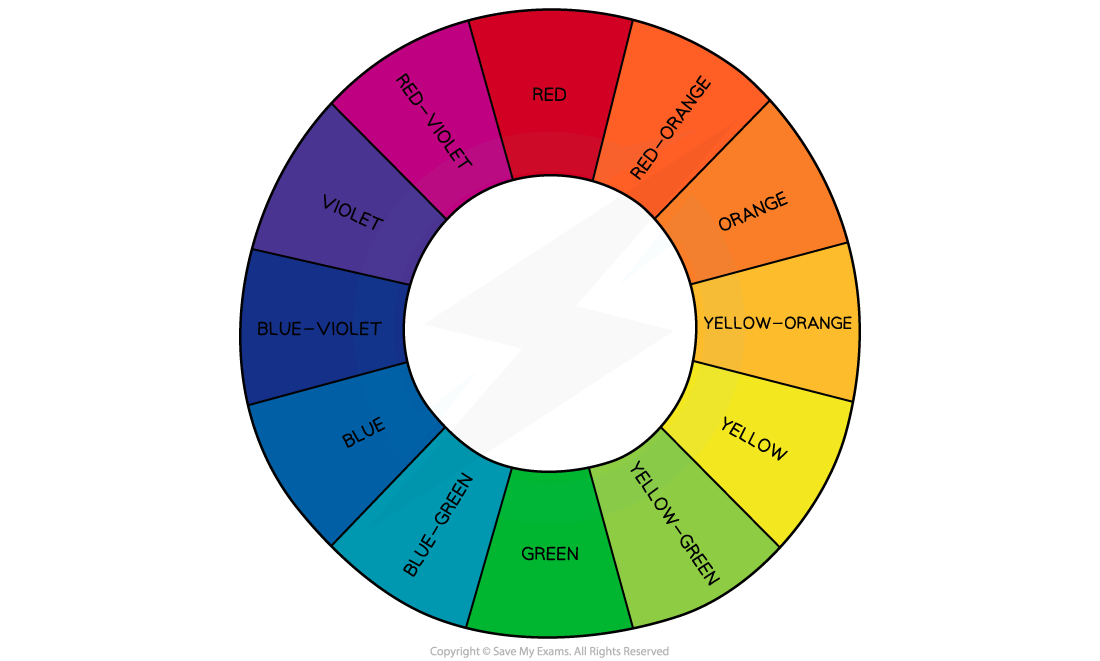
The observed colour is the complementary colour which is made up of wavelengths of light that are transmitted or reflected
For example, copper(II) ions absorb light from the red / orange end of the spectrum
The complementary colour observed is therefore blue-green (cyan)
Complementary colour wheel

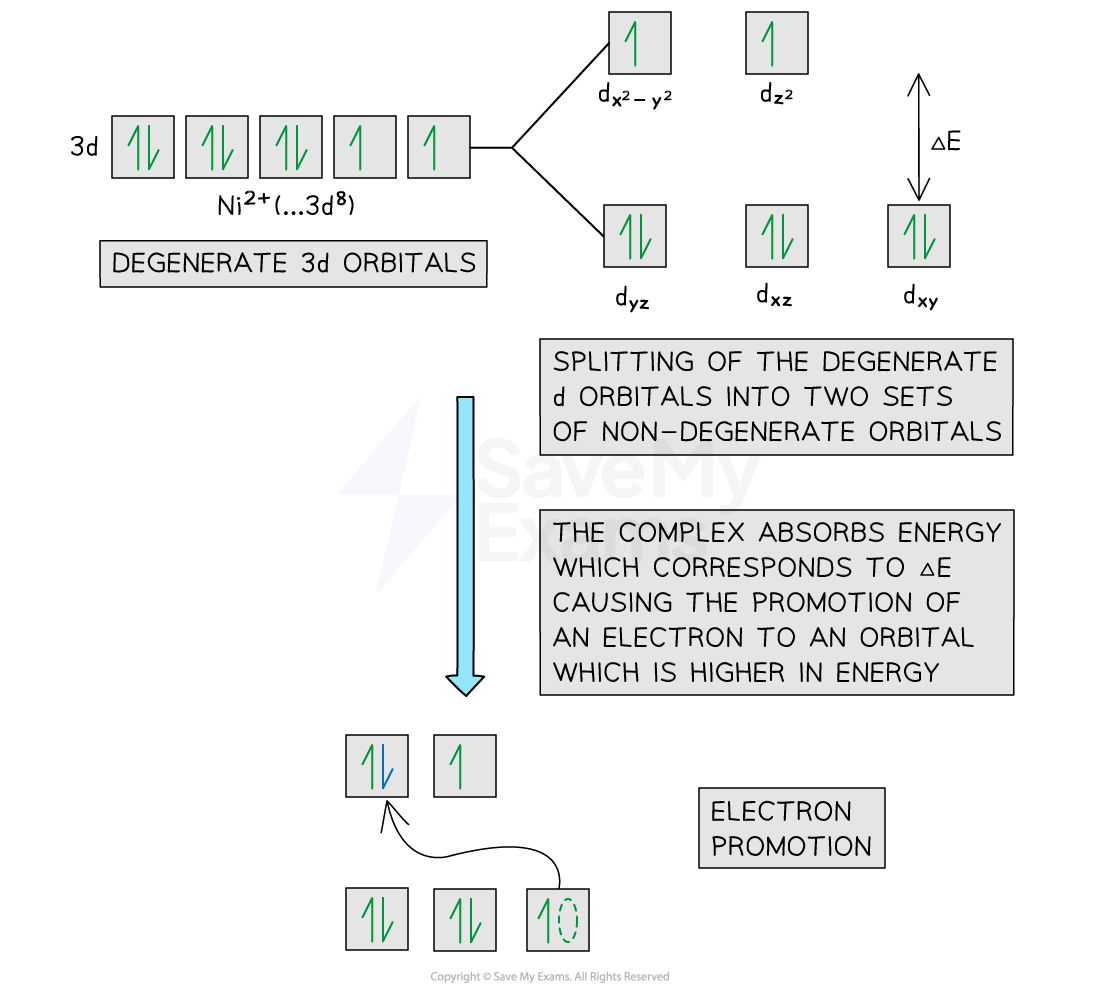
Electron promotion
An isolated transition element is one which is not bonded to any ligands
In an isolated transition element ion, all of the 3d orbitals are degenerate
This means that they are equal in energy
When ligands bond co-ordinately to the central metal ion, the 3d orbitals are split into two sets of non-degenerate orbitals
The difference in energy between these two sets of non-degenerate orbitals is ΔE
This amount of energy absorbed can be worked out from:
h = Planck's constant (6.626 x 10⁻³⁴ m2 kg s-1)
v = frequency (Hertz, Hz or s-1)
The equation for this relationship is:
ΔE = h x v
If the frequency is not known, then the amount of energy absorbed can be worked out from:
h = Planck's constant (6.626 x 10⁻³⁴ m2 kg s-1)
c = velocity of light
= wavelength (cm-1)
The equation for this relationship is:
ΔE = h x c
An electron starts in the ground state, which is a lower energy 3d non-degenerate orbital
When light shines on a solution containing a transition element complex, an electron will absorb a specific amount of energy, ΔE
The electron is now in the excited state, which is a higher energy 3d orbital
This process is electron promotion
Electron promotion in an octahedral Ni2+ complex

The amount of energy absorbed is linked to frequencies of light
The frequencies of light which are not absorbed combine to make the complementary colour
Changes in Colour
Transition element complexes absorb the frequency of light which corresponds to the exact energy difference (ΔE) between their non-degenerate d orbitals
The frequencies of light which are not absorbed combine to make the complementary colour of the complex
It is the complementary colour which is transmitted and observed
However, the exact energy difference (ΔE) is affected by factors such as
the type of ligand
the coordination number
the oxidation state of the transition metal ion
Type of ligand
The nature of the ligand influences the strength of the interaction between ligand and central metal ion
Ligands vary in their charge density
The greater the charge density; the more strongly the ligand interacts with the metal ion
This causes greater splitting of the d-orbitals and means that more energy is required to promote an electron
As a result, a different colour of light is absorbed by the complex solution and a different complementary colour is observed
This means that complexes with the same transition element ions, but different ligands can have different colours:
[Cu(H2O)6]2+ complex has a light blue colour
[Cu(NH3)4 (H2O)2]2+ has a dark blue colour
However, the copper(II) ion has an oxidation state of +2 in both complexes
This is evidence that the ligands surrounding the complex ion affect the colour of the complex
Coordination number
The change of colour in a complex is also partly due to the change in coordination number and geometry of the complex ion
The splitting energy, ΔE, of the d-orbitals is affected by the relative orientation of the ligand as well as the d-orbitals
Changing the coordination number generally involves changing the ligand as well, so it is a combination of these factors that alters the strength of the interactions
Oxidation State
The strength of the attraction between the transition metal ion and the electrons pairs in the dative covalent bonds can vary depending on the effective nuclear charge of the metal ion
Manganese(II) and iron(III) have the same electronic configuration, 1s2 2s2 2p6 3s2 3p6 3d5
Aqueous [Mn(H2O)6]2+
This absorbs energy in the green region of the spectrum
Therefore, it appears pink, following the principle of complementary colours
Aqueous [Fe(H2O)6]3+
It has a higher effective nuclear charge
This means it has a stronger interaction with the ligands
So, it absorbs in the blue (higher energy) region of the spectrum
Therefore, it appears orange
When the same metal is in a higher oxidation state that will also create a stronger interaction with the ligands
Aqueous [Fe(H2O)6]2+
This absorbs energy in the red region of the spectrum
Therefore, it appears green
Aqueous [Fe(H2O)6]3+
It has a higher effective nuclear charge and stronger interactions with the ligands
So, it absorbs in the blue (higher energy) region of the spectrum and appears orange

Examiner Tips and Tricks
You should know the factors that change the colour of transition metal complex ions and be able to write equations to give examples of those changes.
Visible Light Spectroscopy
Spectroscopy uses the absorption of visible light to find the concentration of coloured transition metal ion solutions
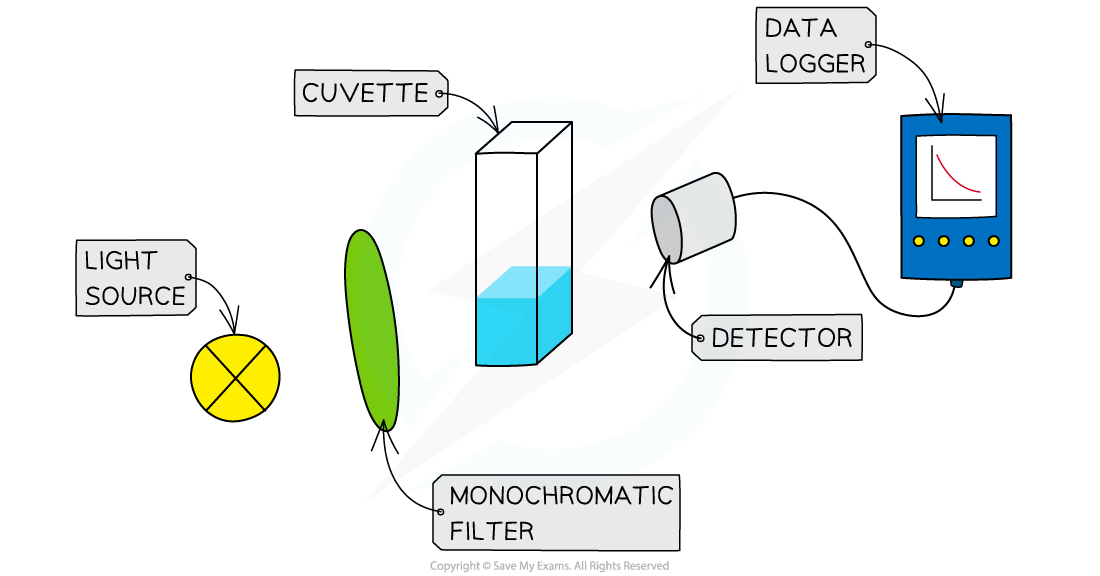
The colorimeter passes different frequencies of light through a sample of the solution
The frequency absorbed is determined by the use of coloured filters and a detector
A filter is chosen matching the part of the spectrum where the absorption is strongest
This means choosing a filter that is the complementary colour to the colour of the solution
For example, a blue solution will absorb red, and therefore a red filter is used, so that only red light passes through the solution and maximum absorption occurs
Some of the light is absorbed by the solution and the rest passes through to the detector
Overview of visible light spectroscopy

To determine the concentration of a coloured solution first a calibration curve has to be made
This involves measuring the absorption of a set of standard solutions whose concentration is known
The values are then plotted on a graph of absorption against concentration
Example calibration curve

At lower concentrations the absorbance is directly proportional to the concentration of the coloured species so a straight line graph is obtained; this is known as the Beer-Lambert Law
Once the calibration curve is plotted then the absorbance of any unknown solution of the same complex ion can be measured
You can then deduce the concentration of the unknown sample by extrapolating from the absorbance to the calibration curve and down to the concentration

Unlock more, it's free!
Did this page help you?