The Bacterial Growth Curve (Edexcel International A Level (IAL) Biology) : Revision Note

The Bacterial Growth Curve
Bacteria divide using the process of binary fission during which one cell will divide into two identical cells
The process is as follows
The single, circular DNA molecule undergoes DNA replication
Any plasmids present undergo DNA replication
The parent cell divides into two cells, with the cytoplasm roughly halved between the two daughter cells
The two daughter cells each contain a single copy of the circular DNA molecule and a variable number of plasmids
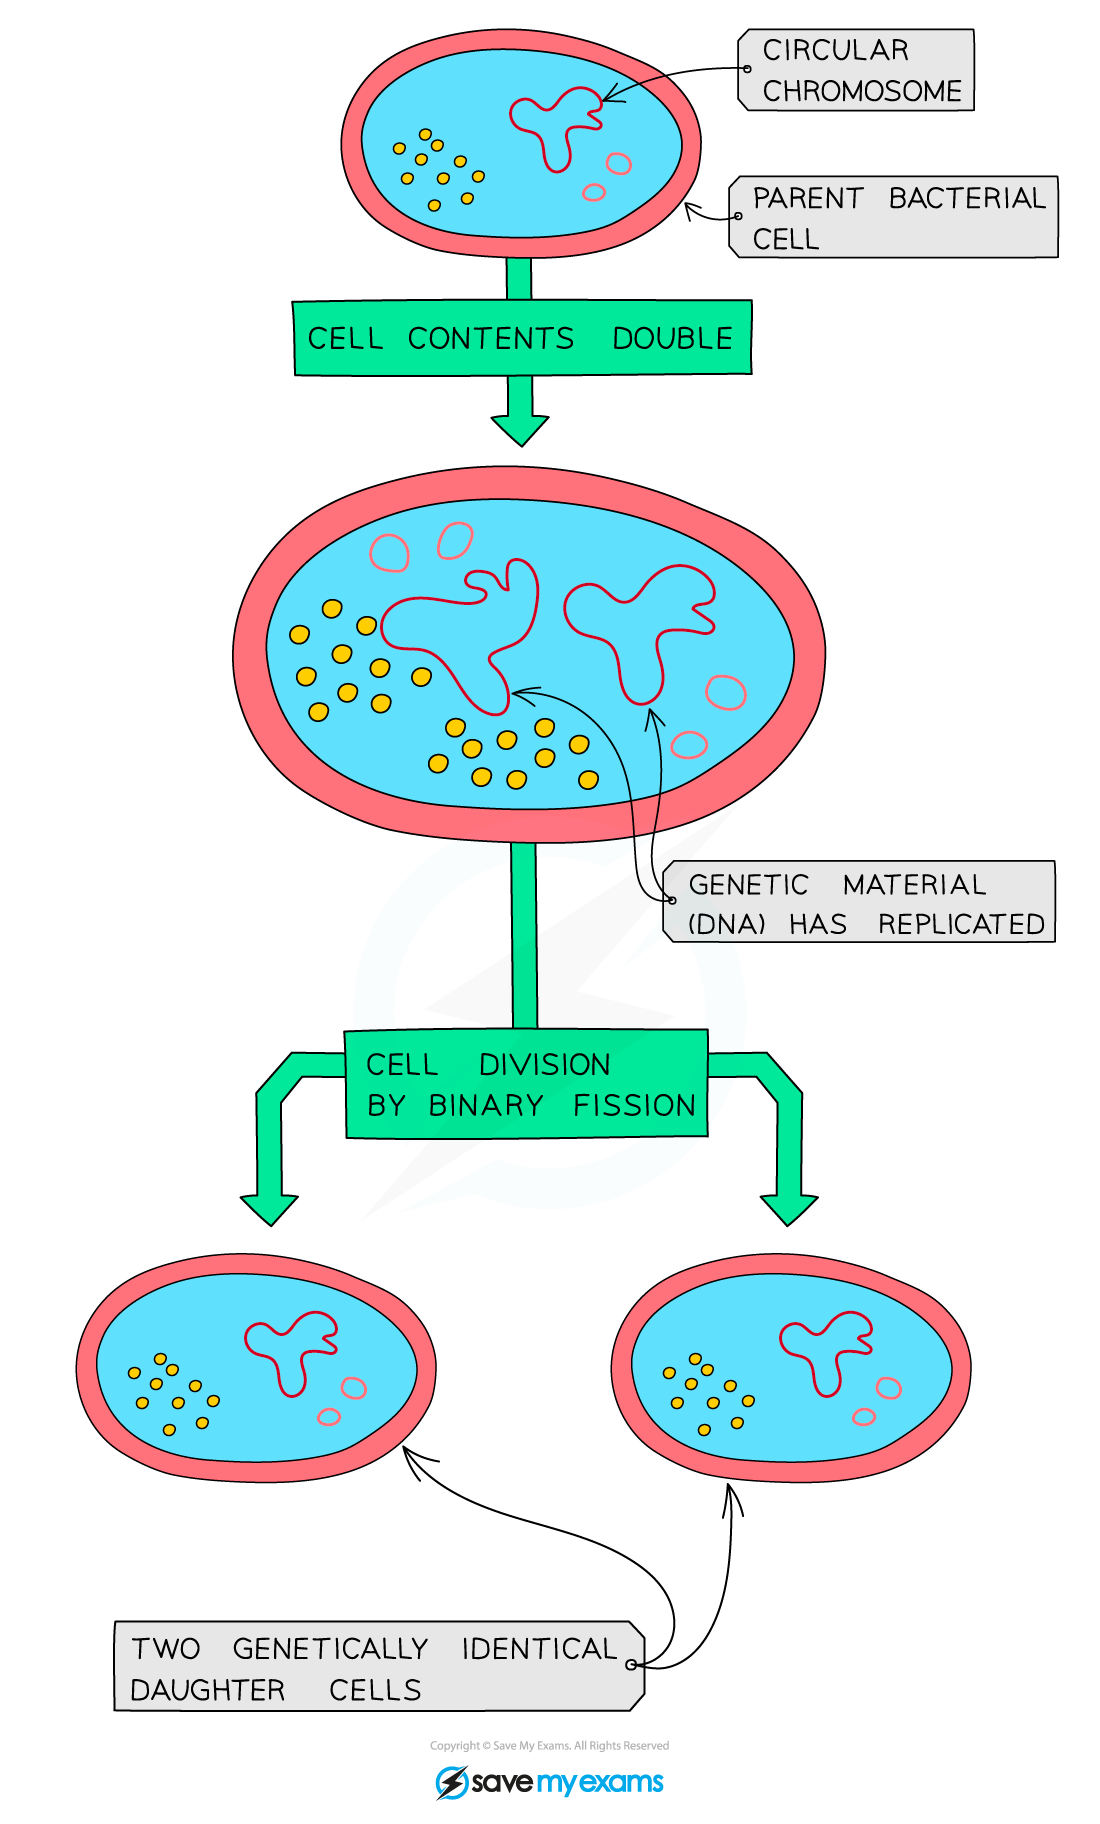
The process of binary fission produces two identical daughter cells
Bacterial growth curve
The growth of a bacterial population follows a specific pattern over time; this is known as a growth curve
There are 4 phases in the population growth curve of a microorganism population
Lag phase
The population size increases slowly as the microorganism population adjusts to its new environment and gradually starts to reproduce
Exponential phase
With high availability of nutrients and plenty of space, the population moves into exponential growth; this means that the population doubles with each division
This phase is also known as the log phase
Stationary phase
The population reaches its maximum as it is limited by its environment, e.g. a lack of resources and toxic waste products.
During this phase the number of microorganisms dying equals the number being produced by binary fission and the growth curve levels off
Death phase
Due to lack of nutrients and a build up of toxic waste build up, death rate exceeds rate of reproduction and the population starts to decline
This phase is also known as the decline phase

There are four phases in the standard growth curve of a microorganism
Using logarithms in growth curves
During the exponential growth phase bacterial colonies can grow at rapid rates with very large numbers of bacteria produced within hours
Dealing with experimental data relating to large numbers of bacteria can be difficult when using traditional linear scales
There can be a wide range of numbers reaching from single figures into millions
This makes it hard to work out a suitable scale for the axes of graphs
Logarithmic scales can be very useful when investigating bacteria or other microorganisms
The numbers in a logarithmic scale represents logarithms, or powers, of a base number
If using a log10 scale, in which the base number is 10, the numbers on the y-axis represent a power of 10, e.g. 1=101 (10), 2=102 (100), 3=103 (1000) etc.
Logarithmic scales allow for a wide range of values to be displayed on a single graph
For example, if yeast cells were grown in culture over several hours the number of cells would increase very rapidly from the original number of cells present
The results from such an experiment are shown in the graph below using a log scale
The number of yeast cells present at each time interval was converted to a logarithm before being plotted on the graph
This can be done using a log function on a calculator
The log scale is easily identifiable as there are not equal intervals between the numbers on the y-axis
The wide range of cell numbers fit easily onto the same scale

When a log10 scale is used, the scale increases by a factor of 10 each time; this allows large increases in numbers to be shown on a single graph
Examiner Tips and Tricks
You won’t be expected to convert values into logarithms or create a log scale graph in the exam. Instead you might be asked to interpret results that use logarithmic scales or explain the benefit of using one! Remember that graphs with a logarithmic scale have uneven intervals between values on one or more axes.
Exponential growth rate constants
To calculate the number of bacteria in a population the following formula can be used
![]()
Where
Nt = the number of organisms at time t
N0 = the number of organisms at time 0
k = the exponential growth rate constant
t = the time for which the colony has been growing
To use this equation the exponential growth rate constant k must be calculated
This refers to the number of times the population doubles in a given time period
The following formula can be used to calculate the exponential growth rate constant
format('truetype')%3Bfont-weight%3Anormal%3Bfont-style%3Anormal%3B%7D%3C%2Fstyle%3E%3C%2Fdefs%3E%3Ctext%20font-family%3D%22Arial%22%20font-size%3D%2218%22%20font-style%3D%22italic%22%20text-anchor%3D%22middle%22%20x%3D%224.5%22%20y%3D%2236%22%3Ek%3C%2Ftext%3E%3Ctext%20font-family%3D%22math143f4d31b04031e49f5eb18baba%22%20font-size%3D%2218%22%20text-anchor%3D%22middle%22%20x%3D%2224.5%22%20y%3D%2236%22%3E%3D%3C%2Ftext%3E%3Cline%20stroke%3D%22%23000%22%20stroke-linecap%3D%22square%22%20stroke-width%3D%221%22%20x1%3D%2241.5%22%20x2%3D%22200.5%22%20y1%3D%2229.5%22%20y2%3D%2229.5%22%2F%3E%3Ctext%20font-family%3D%22Arial%22%20font-size%3D%2218%22%20text-anchor%3D%22middle%22%20x%3D%2255.5%22%20y%3D%2218%22%3Elog%3C%2Ftext%3E%3Ctext%20font-family%3D%22Arial%22%20font-size%3D%2213%22%20text-anchor%3D%22middle%22%20x%3D%2274.5%22%20y%3D%2223%22%3E10%3C%2Ftext%3E%3Ctext%20font-family%3D%22Arial%22%20font-size%3D%2218%22%20font-style%3D%22italic%22%20text-anchor%3D%22middle%22%20x%3D%2292.5%22%20y%3D%2218%22%3EN%3C%2Ftext%3E%3Ctext%20font-family%3D%22Arial%22%20font-size%3D%2213%22%20font-style%3D%22italic%22%20text-anchor%3D%22middle%22%20x%3D%22102.5%22%20y%3D%2224%22%3Et%3C%2Ftext%3E%3Ctext%20font-family%3D%22math143f4d31b04031e49f5eb18baba%22%20font-size%3D%2218%22%20font-style%3D%22italic%22%20text-anchor%3D%22middle%22%20x%3D%22118.5%22%20y%3D%2218%22%3E%26%23x2212%3B%3C%2Ftext%3E%3Ctext%20font-family%3D%22Arial%22%20font-size%3D%2218%22%20text-anchor%3D%22middle%22%20x%3D%22146.5%22%20y%3D%2218%22%3Elog%3C%2Ftext%3E%3Ctext%20font-family%3D%22Arial%22%20font-size%3D%2213%22%20font-style%3D%22italic%22%20text-anchor%3D%22middle%22%20x%3D%22165.5%22%20y%3D%2224%22%3E10%3C%2Ftext%3E%3Ctext%20font-family%3D%22Arial%22%20font-size%3D%2218%22%20font-style%3D%22italic%22%20text-anchor%3D%22middle%22%20x%3D%22183.5%22%20y%3D%2218%22%3EN%3C%2Ftext%3E%3Ctext%20font-family%3D%22Arial%22%20font-size%3D%2213%22%20font-style%3D%22italic%22%20text-anchor%3D%22middle%22%20x%3D%22194.5%22%20y%3D%2223%22%3E0%3C%2Ftext%3E%3Ctext%20font-family%3D%22Arial%22%20font-size%3D%2218%22%20text-anchor%3D%22middle%22%20x%3D%2297.5%22%20y%3D%2249%22%3Elog%3C%2Ftext%3E%3Ctext%20font-family%3D%22Arial%22%20font-size%3D%2213%22%20text-anchor%3D%22middle%22%20x%3D%22116.5%22%20y%3D%2254%22%3E10%3C%2Ftext%3E%3Ctext%20font-family%3D%22Arial%22%20font-size%3D%2218%22%20text-anchor%3D%22middle%22%20x%3D%22128.5%22%20y%3D%2249%22%3E2%3C%2Ftext%3E%3Ctext%20font-family%3D%22Arial%22%20font-size%3D%2218%22%20text-anchor%3D%22middle%22%20x%3D%22142.5%22%20y%3D%2249%22%3Ex%3C%2Ftext%3E%3Ctext%20font-family%3D%22Arial%22%20font-size%3D%2218%22%20font-style%3D%22italic%22%20text-anchor%3D%22middle%22%20x%3D%22154.5%22%20y%3D%2249%22%3Et%3C%2Ftext%3E%3C%2Fsvg%3E)
Worked Example
A bacterial colony started with 2 individuals and after 3 hours of growing there were 926 bacteria in the colony.
1. Calculate the exponential growth rate constant of this colony
2. Calculate the number of bacteria in the colony after 5 hours
Answer:
Step 1: Calculate the exponential growth rate constant
format('truetype')%3Bfont-weight%3Anormal%3Bfont-style%3Anormal%3B%7D%3C%2Fstyle%3E%3C%2Fdefs%3E%3Ctext%20font-family%3D%22Arial%22%20font-size%3D%2218%22%20font-style%3D%22italic%22%20text-anchor%3D%22middle%22%20x%3D%224.5%22%20y%3D%2236%22%3Ek%3C%2Ftext%3E%3Ctext%20font-family%3D%22math143f4d31b04031e49f5eb18baba%22%20font-size%3D%2218%22%20text-anchor%3D%22middle%22%20x%3D%2224.5%22%20y%3D%2236%22%3E%3D%3C%2Ftext%3E%3Cline%20stroke%3D%22%23000%22%20stroke-linecap%3D%22square%22%20stroke-width%3D%221%22%20x1%3D%2241.5%22%20x2%3D%22200.5%22%20y1%3D%2229.5%22%20y2%3D%2229.5%22%2F%3E%3Ctext%20font-family%3D%22Arial%22%20font-size%3D%2218%22%20text-anchor%3D%22middle%22%20x%3D%2255.5%22%20y%3D%2218%22%3Elog%3C%2Ftext%3E%3Ctext%20font-family%3D%22Arial%22%20font-size%3D%2213%22%20text-anchor%3D%22middle%22%20x%3D%2274.5%22%20y%3D%2224%22%3E10%3C%2Ftext%3E%3Ctext%20font-family%3D%22Arial%22%20font-size%3D%2218%22%20font-style%3D%22italic%22%20text-anchor%3D%22middle%22%20x%3D%2291.5%22%20y%3D%2218%22%3EN%3C%2Ftext%3E%3Ctext%20font-family%3D%22Arial%22%20font-size%3D%2213%22%20font-style%3D%22italic%22%20text-anchor%3D%22middle%22%20x%3D%22101.5%22%20y%3D%2224%22%3Et%3C%2Ftext%3E%3Ctext%20font-family%3D%22math143f4d31b04031e49f5eb18baba%22%20font-size%3D%2218%22%20font-style%3D%22italic%22%20text-anchor%3D%22middle%22%20x%3D%22117.5%22%20y%3D%2218%22%3E%26%23x2212%3B%3C%2Ftext%3E%3Ctext%20font-family%3D%22Arial%22%20font-size%3D%2218%22%20text-anchor%3D%22middle%22%20x%3D%22145.5%22%20y%3D%2218%22%3Elog%3C%2Ftext%3E%3Ctext%20font-family%3D%22Arial%22%20font-size%3D%2213%22%20font-style%3D%22italic%22%20text-anchor%3D%22middle%22%20x%3D%22164.5%22%20y%3D%2223%22%3E10%3C%2Ftext%3E%3Ctext%20font-family%3D%22Arial%22%20font-size%3D%2218%22%20font-style%3D%22italic%22%20text-anchor%3D%22middle%22%20x%3D%22183.5%22%20y%3D%2218%22%3EN%3C%2Ftext%3E%3Ctext%20font-family%3D%22Arial%22%20font-size%3D%2213%22%20font-style%3D%22italic%22%20text-anchor%3D%22middle%22%20x%3D%22194.5%22%20y%3D%2223%22%3E0%3C%2Ftext%3E%3Ctext%20font-family%3D%22Arial%22%20font-size%3D%2218%22%20text-anchor%3D%22middle%22%20x%3D%2297.5%22%20y%3D%2249%22%3Elog%3C%2Ftext%3E%3Ctext%20font-family%3D%22Arial%22%20font-size%3D%2213%22%20text-anchor%3D%22middle%22%20x%3D%22116.5%22%20y%3D%2254%22%3E10%3C%2Ftext%3E%3Ctext%20font-family%3D%22Arial%22%20font-size%3D%2218%22%20text-anchor%3D%22middle%22%20x%3D%22128.5%22%20y%3D%2249%22%3E2%3C%2Ftext%3E%3Ctext%20font-family%3D%22Arial%22%20font-size%3D%2218%22%20text-anchor%3D%22middle%22%20x%3D%22142.5%22%20y%3D%2249%22%3Ex%3C%2Ftext%3E%3Ctext%20font-family%3D%22Arial%22%20font-size%3D%2218%22%20font-style%3D%22italic%22%20text-anchor%3D%22middle%22%20x%3D%22154.5%22%20y%3D%2249%22%3Et%3C%2Ftext%3E%3C%2Fsvg%3E)
%3C%2Fmo%3E%3Cmo%3E%26%23xA0%3B%3C%2Fmo%3E%3Cmo%3E-%3C%2Fmo%3E%3Cmo%3E%26%23xA0%3B%3C%2Fmo%3E%3Cmsub%3E%3Cmi%3Elog%3C%2Fmi%3E%3Cmn%3E10%3C%2Fmn%3E%3C%2Fmsub%3E%3Cmo%3E(%3C%2Fmo%3E%3Cmn%3E2%3C%2Fmn%3E%3Cmo%3E)%3C%2Fmo%3E%3C%2Fmrow%3E%3Cmrow%3E%3Cmsub%3E%3Cmi%3Elog%3C%2Fmi%3E%3Cmn%3E10%3C%2Fmn%3E%3C%2Fmsub%3E%3Cmn%3E2%3C%2Fmn%3E%3Cmo%3E%26%23xA0%3B%3C%2Fmo%3E%3Cmi%20mathvariant%3D%22normal%22%3Ex%3C%2Fmi%3E%3Cmo%3E%26%23xA0%3B%3C%2Fmo%3E%3Cmn%3E3%3C%2Fmn%3E%3C%2Fmrow%3E%3C%2Fmfrac%3E%3C%2Fmath%3E--%3E%3Cdefs%3E%3Cstyle%20type%3D%22text%2Fcss%22%3E%40font-face%7Bfont-family%3A'math143f4d31b04031e49f5eb18baba'%3Bsrc%3Aurl(data%3Afont%2Ftruetype%3Bcharset%3Dutf-8%3Bbase64%2CAAEAAAAMAIAAAwBAT1MvMi7iBBMAAADMAAAATmNtYXDEvmKUAAABHAAAADxjdnQgDVUNBwAAAVgAAAA6Z2x5ZoPi2VsAAAGUAAAA%2FGhlYWQQC2qxAAACkAAAADZoaGVhCGsXSAAAAsgAAAAkaG10eE2rRkcAAALsAAAADGxvY2EAHTwYAAAC%2BAAAABBtYXhwBT0FPgAAAwgAAAAgbmFtZaBxlY4AAAMoAAABn3Bvc3QB9wD6AAAEyAAAACBwcmVwa1uragAABOgAAAAUAAADSwGQAAUAAAQABAAAAAAABAAEAAAAAAAAAQEAAAAAAAAAAAAAAAAAAAAAAAAAAAAAAAAAAAAAACAgICAAAAAg1UADev96AAAD6ACWAAAAAAACAAEAAQAAABQAAwABAAAAFAAEACgAAAAGAAQAAQACAD0iEv%2F%2FAAAAPSIS%2F%2F%2F%2FxN3wAAEAAAAAAAAAAAFUAywAgAEAAFYAKgJYAh4BDgEsAiwAWgGAAoAAoADUAIAAAAAAAAAAKwBVAIAAqwDVAQABKwAHAAAAAgBVAAADAAOrAAMABwAAMxEhESUhESFVAqv9qwIA%2FgADq%2FxVVQMAAAIAgADrAtUCFQADAAcAZRgBsAgQsAbUsAYQsAXUsAgQsAHUsAEQsADUsAYQsAc8sAUQsAQ8sAEQsAI8sAAQsAM8ALAIELAG1LAGELAH1LAHELAB1LABELAC1LAGELAFPLAHELAEPLABELAAPLACELADPDEwEyE1IR0BITWAAlX9qwJVAcBV1VVVAAEAgAFVAtUBqwADADAYAbAEELEAA%2FawAzyxAgf1sAE8sQUD5gCxAAATELEABuWxAAETELABPLEDBfWwAjwTIRUhgAJV%2FasBq1YAAQAAAAEAANV4zkFfDzz1AAMEAP%2F%2F%2F%2F%2FWOhNz%2F%2F%2F%2F%2F9Y6E3MAAP8gBIADqwAAAAoAAgABAAAAAAABAAAD6P9qAAAXcAAA%2F7YEgAABAAAAAAAAAAAAAAAAAAAAAwNSAFUDVgCAA1YAgAAAAAAAAAAoAAAAsgAAAPwAAQAAAAMAXgAFAAAAAAACAIAEAAAAAAAEAADeAAAAAAAAABUBAgAAAAAAAAABABIAAAAAAAAAAAACAA4AEgAAAAAAAAADADAAIAAAAAAAAAAEABIAUAAAAAAAAAAFABYAYgAAAAAAAAAGAAkAeAAAAAAAAAAIABwAgQABAAAAAAABABIAAAABAAAAAAACAA4AEgABAAAAAAADADAAIAABAAAAAAAEABIAUAABAAAAAAAFABYAYgABAAAAAAAGAAkAeAABAAAAAAAIABwAgQADAAEECQABABIAAAADAAEECQACAA4AEgADAAEECQADADAAIAADAAEECQAEABIAUAADAAEECQAFABYAYgADAAEECQAGAAkAeAADAAEECQAIABwAgQBNAGEAdABoACAARgBvAG4AdABSAGUAZwB1AGwAYQByAE0AYQB0AGgAcwAgAEYAbwByACAATQBvAHIAZQAgAE0AYQB0AGgAIABGAG8AbgB0AE0AYQB0AGgAIABGAG8AbgB0AFYAZQByAHMAaQBvAG4AIAAxAC4AME1hdGhfRm9udABNAGEAdABoAHMAIABGAG8AcgAgAE0AbwByAGUAAAMAAAAAAAAB9AD6AAAAAAAAAAAAAAAAAAAAAAAAAAC5BxEAAI2FGACyAAAAFRQTsQABPw%3D%3D)format('truetype')%3Bfont-weight%3Anormal%3Bfont-style%3Anormal%3B%7D%40font-face%7Bfont-family%3A'round_brackets18549f92a457f2409'%3Bsrc%3Aurl(data%3Afont%2Ftruetype%3Bcharset%3Dutf-8%3Bbase64%2CAAEAAAAMAIAAAwBAT1MvMjwHLFQAAADMAAAATmNtYXDf7xCrAAABHAAAADxjdnQgBAkDLgAAAVgAAAASZ2x5ZmAOz2cAAAFsAAABJGhlYWQOKih8AAACkAAAADZoaGVhCvgVwgAAAsgAAAAkaG10eCA6AAIAAALsAAAADGxvY2EAAARLAAAC%2BAAAABBtYXhwBIgEWQAAAwgAAAAgbmFtZXHR30MAAAMoAAACOXBvc3QDogHPAAAFZAAAACBwcmVwupWEAAAABYQAAAAHAAAGcgGQAAUAAAgACAAAAAAACAAIAAAAAAAAAQIAAAAAAAAAAAAAAAAAAAAAAAAAAAAAAAAAAAAAACAgICAAAAAo8AMGe%2F57AAAHPgGyAAAAAAACAAEAAQAAABQAAwABAAAAFAAEACgAAAAGAAQAAQACACgAKf%2F%2FAAAAKAAp%2F%2F%2F%2F2f%2FZAAEAAAAAAAAAAAFUAFYBAAAsAKgDgAAyAAcAAAACAAAAKgDVA1UAAwAHAAA1MxEjEyMRM9XVq4CAKgMr%2FQAC1QABAAD%2B0AIgBtAACQBNGAGwChCwA9SwAxCwAtSwChCwBdSwBRCwANSwAxCwBzywAhCwCDwAsAoQsAPUsAMQsAfUsAoQsAXUsAoQsADUsAMQsAI8sAcQsAg8MTAREAEzABEQASMAAZCQ%2FnABkJD%2BcALQ%2FZD%2BcAGQAnACcAGQ%2FnAAAQAA%2FtACIAbQAAkATRgBsAoQsAPUsAMQsALUsAoQsAXUsAUQsADUsAMQsAc8sAIQsAg8ALAKELAD1LADELAH1LAKELAF1LAKELAA1LADELACPLAHELAIPDEwARABIwAREAEzAAIg%2FnCQAZD%2BcJABkALQ%2FZD%2BcAGQAnACcAGQ%2FnAAAQAAAAEAAPW2NYFfDzz1AAMIAP%2F%2F%2F%2F%2FVre7u%2F%2F%2F%2F%2F9Wt7u4AAP7QA7cG0AAAAAoAAgABAAAAAAABAAAHPv5OAAAXcAAA%2F%2F4DtwABAAAAAAAAAAAAAAAAAAAAAwDVAAACIAAAAiAAAAAAAAAAAAAkAAAAowAAASQAAQAAAAMACgACAAAAAAACAIAEAAAAAAAEAABNAAAAAAAAABUBAgAAAAAAAAABAD4AAAAAAAAAAAACAA4APgAAAAAAAAADAFwATAAAAAAAAAAEAD4AqAAAAAAAAAAFABYA5gAAAAAAAAAGAB8A%2FAAAAAAAAAAIABwBGwABAAAAAAABAD4AAAABAAAAAAACAA4APgABAAAAAAADAFwATAABAAAAAAAEAD4AqAABAAAAAAAFABYA5gABAAAAAAAGAB8A%2FAABAAAAAAAIABwBGwADAAEECQABAD4AAAADAAEECQACAA4APgADAAEECQADAFwATAADAAEECQAEAD4AqAADAAEECQAFABYA5gADAAEECQAGAB8A%2FAADAAEECQAIABwBGwBSAG8AdQBuAGQAIABiAHIAYQBjAGsAZQB0AHMAIAB3AGkAdABoACAAYQBzAGMAZQBuAHQAIAAxADgANQA0AFIAZQBnAHUAbABhAHIATQBhAHQAaABzACAARgBvAHIAIABNAG8AcgBlACAAUgBvAHUAbgBkACAAYgByAGEAYwBrAGUAdABzACAAdwBpAHQAaAAgAGEAcwBjAGUAbgB0ACAAMQA4ADUANABSAG8AdQBuAGQAIABiAHIAYQBjAGsAZQB0AHMAIAB3AGkAdABoACAAYQBzAGMAZQBuAHQAIAAxADgANQA0AFYAZQByAHMAaQBvAG4AIAAyAC4AMFJvdW5kX2JyYWNrZXRzX3dpdGhfYXNjZW50XzE4NTQATQBhAHQAaABzACAARgBvAHIAIABNAG8AcgBlAAAAAAMAAAAAAAADnwHPAAAAAAAAAAAAAAAAAAAAAAAAAAC5B%2F8AAY2FAA%3D%3D)format('truetype')%3Bfont-weight%3Anormal%3Bfont-style%3Anormal%3B%7D%3C%2Fstyle%3E%3C%2Fdefs%3E%3Ctext%20font-family%3D%22Arial%22%20font-size%3D%2218%22%20font-style%3D%22italic%22%20text-anchor%3D%22middle%22%20x%3D%224.5%22%20y%3D%2235%22%3Ek%3C%2Ftext%3E%3Ctext%20font-family%3D%22math143f4d31b04031e49f5eb18baba%22%20font-size%3D%2218%22%20text-anchor%3D%22middle%22%20x%3D%2224.5%22%20y%3D%2235%22%3E%3D%3C%2Ftext%3E%3Cline%20stroke%3D%22%23000%22%20stroke-linecap%3D%22square%22%20stroke-width%3D%221%22%20x1%3D%2241.5%22%20x2%3D%22213.5%22%20y1%3D%2228.5%22%20y2%3D%2228.5%22%2F%3E%3Ctext%20font-family%3D%22Arial%22%20font-size%3D%2218%22%20text-anchor%3D%22middle%22%20x%3D%2255.5%22%20y%3D%2218%22%3Elog%3C%2Ftext%3E%3Ctext%20font-family%3D%22Arial%22%20font-size%3D%2213%22%20text-anchor%3D%22middle%22%20x%3D%2274.5%22%20y%3D%2223%22%3E10%3C%2Ftext%3E%3Ctext%20font-family%3D%22round_brackets18549f92a457f2409%22%20font-size%3D%2218%22%20text-anchor%3D%22middle%22%20x%3D%2284.5%22%20y%3D%2218%22%3E(%3C%2Ftext%3E%3Ctext%20font-family%3D%22Arial%22%20font-size%3D%2218%22%20text-anchor%3D%22middle%22%20x%3D%22102.5%22%20y%3D%2218%22%3E926%3C%2Ftext%3E%3Ctext%20font-family%3D%22round_brackets18549f92a457f2409%22%20font-size%3D%2218%22%20text-anchor%3D%22middle%22%20x%3D%22119.5%22%20y%3D%2218%22%3E)%3C%2Ftext%3E%3Ctext%20font-family%3D%22math143f4d31b04031e49f5eb18baba%22%20font-size%3D%2218%22%20text-anchor%3D%22middle%22%20x%3D%22137.5%22%20y%3D%2218%22%3E%26%23x2212%3B%3C%2Ftext%3E%3Ctext%20font-family%3D%22Arial%22%20font-size%3D%2218%22%20text-anchor%3D%22middle%22%20x%3D%22164.5%22%20y%3D%2218%22%3Elog%3C%2Ftext%3E%3Ctext%20font-family%3D%22Arial%22%20font-size%3D%2213%22%20text-anchor%3D%22middle%22%20x%3D%22183.5%22%20y%3D%2223%22%3E10%3C%2Ftext%3E%3Ctext%20font-family%3D%22round_brackets18549f92a457f2409%22%20font-size%3D%2218%22%20text-anchor%3D%22middle%22%20x%3D%22193.5%22%20y%3D%2218%22%3E(%3C%2Ftext%3E%3Ctext%20font-family%3D%22Arial%22%20font-size%3D%2218%22%20text-anchor%3D%22middle%22%20x%3D%22201.5%22%20y%3D%2218%22%3E2%3C%2Ftext%3E%3Ctext%20font-family%3D%22round_brackets18549f92a457f2409%22%20font-size%3D%2218%22%20text-anchor%3D%22middle%22%20x%3D%22208.5%22%20y%3D%2218%22%3E)%3C%2Ftext%3E%3Ctext%20font-family%3D%22Arial%22%20font-size%3D%2218%22%20text-anchor%3D%22middle%22%20x%3D%22101.5%22%20y%3D%2248%22%3Elog%3C%2Ftext%3E%3Ctext%20font-family%3D%22Arial%22%20font-size%3D%2213%22%20text-anchor%3D%22middle%22%20x%3D%22120.5%22%20y%3D%2253%22%3E10%3C%2Ftext%3E%3Ctext%20font-family%3D%22Arial%22%20font-size%3D%2218%22%20text-anchor%3D%22middle%22%20x%3D%22132.5%22%20y%3D%2248%22%3E2%3C%2Ftext%3E%3Ctext%20font-family%3D%22Arial%22%20font-size%3D%2218%22%20text-anchor%3D%22middle%22%20x%3D%22146.5%22%20y%3D%2248%22%3Ex%3C%2Ftext%3E%3Ctext%20font-family%3D%22Arial%22%20font-size%3D%2218%22%20text-anchor%3D%22middle%22%20x%3D%22161.5%22%20y%3D%2248%22%3E3%3C%2Ftext%3E%3C%2Fsvg%3E)
![]()
![]()
Step 2: Calculate the number of bacteria after 5 hours
![]()
![]()
![]()
![]()

You've read 0 of your 5 free revision notes this week
Unlock more, it's free!
Did this page help you?