Core Practical 11: Quadrat & Transect Study (Edexcel International A Level (IAL) Biology): Revision Note
Exam code: YBI11

Quadrat & Transect Study
Finding out about the abundance and distribution of species can be achieved by counting all of the organisms present in a habitat
This is possible for areas that are very small or where the species are very large
For larger and more complex habitats it is not possible to find, identify, and count every organism that is present
When this is the case sampling can be used to make an estimate for the total species numbers
Sampling
Sampling is a method of investigating the abundance and distribution of species and populations
There are two different types of sampling
Random
Systematic
In random sampling the positions of the sampling points are selected at random
This method avoids bias by the person that is carrying out the sampling
Bias can affect the results e.g.
A student might choose to carry out samples in a particular location because it looks interesting, and this might give the impression that the habitat contains more species than it really does
In systematic sampling the positions of the sampling points are located at fixed intervals throughout the sampling site
This avoids accidentally missing out sections of habitat due to chance
Systematic sampling allows researchers to investigate the effect of the presence of certain environmental features on species distribution e.g. by taking samples along a line that extends away from an environmental feature such as a river
A line of this type is known as a transect
When a sampling area is reasonably uniform then random sampling is the best choice
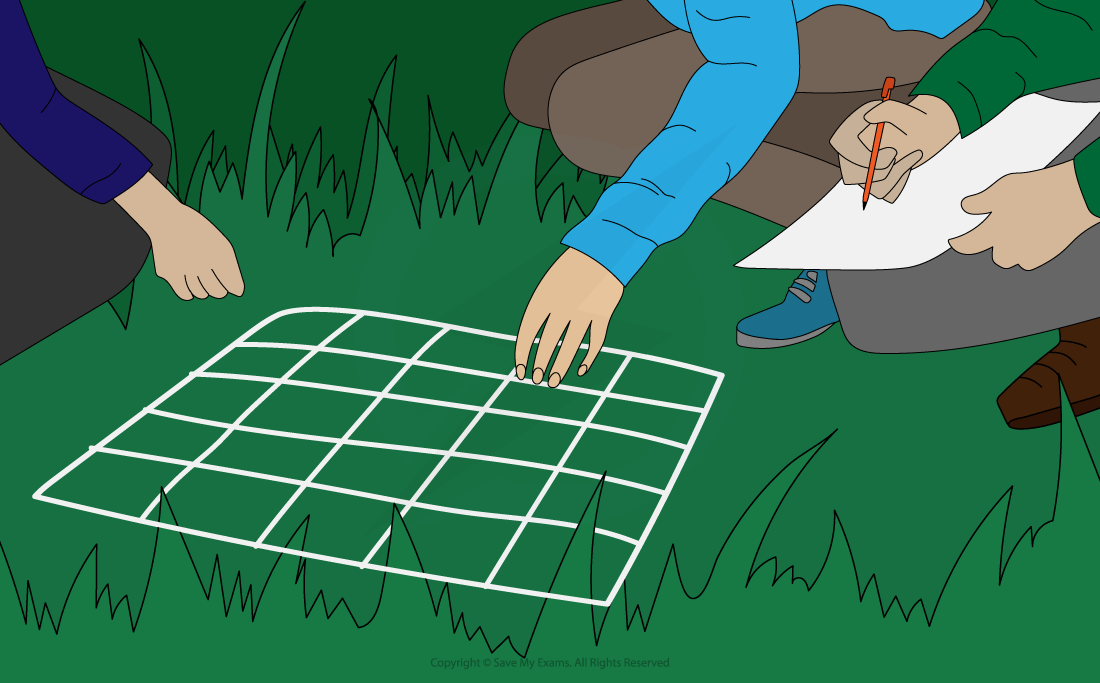
Random sample sites can be selected by
Laying out a grid over the area to be studied
Generating random number co-ordinates
Placing sample sites in the grid squares that match the random number co-ordinates
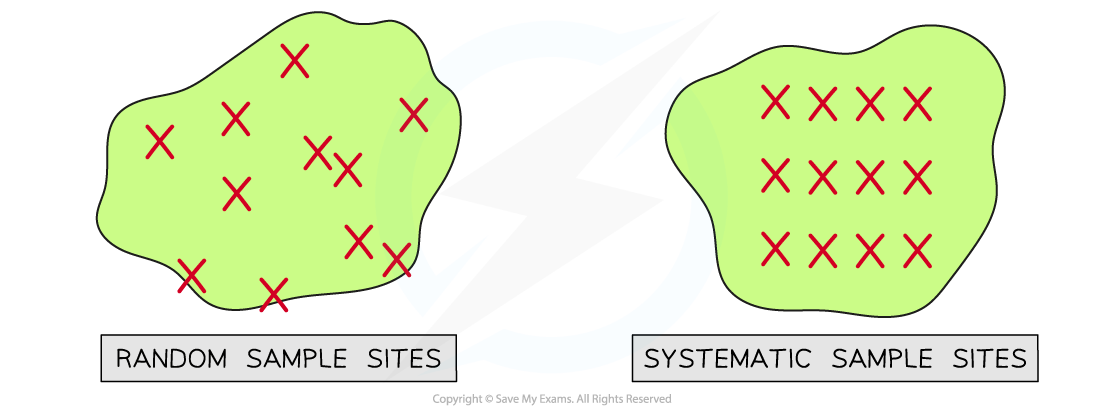
Random sampling involves selecting sample sites at random while systematic sampling involves placing sample sites at regular intervals.
Determining distribution and abundance
The distribution and abundance of a species in an area can be assessed using different practical methods:
Frame and point quadrats
Line and belt transects
Frame quadrats
A frame quadrat is a square frame that is placed within the area to be studied to provide a sample
Quadrats are used to study the distribution of sessile organisms
Quadrats can be different sizes depending on the species being studied
A 1 m² quadrat can be used to study small organisms such as herbaceous plants in a grassland or limpets on a rocky shore
A 400 m² quadrat can be used to study large organisms such as trees
Quadrats like this will usually be marked out with string rather than a frame!
Frame quadrats can be placed in a habitat randomly, e.g. using random co-ordinates, or systematically, e.g. along a transect
A frame quadrat can be used to measure abundance and distribution
Scientists can record different types of data from a frame quadrat depending on the aim of a study and the species involved
Presence or absence of a species
Species frequency; how many individuals are in the quadrat
Species abundance; measured on a scale called the ACFOR scale on which species are recorded as being abundant, common, frequent, occasional, rare, or none
Percentage cover; the percentage of the quadrat covered by a species
Quadrats can be divided up into smaller squares to allow percentage cover to be assessed more easily
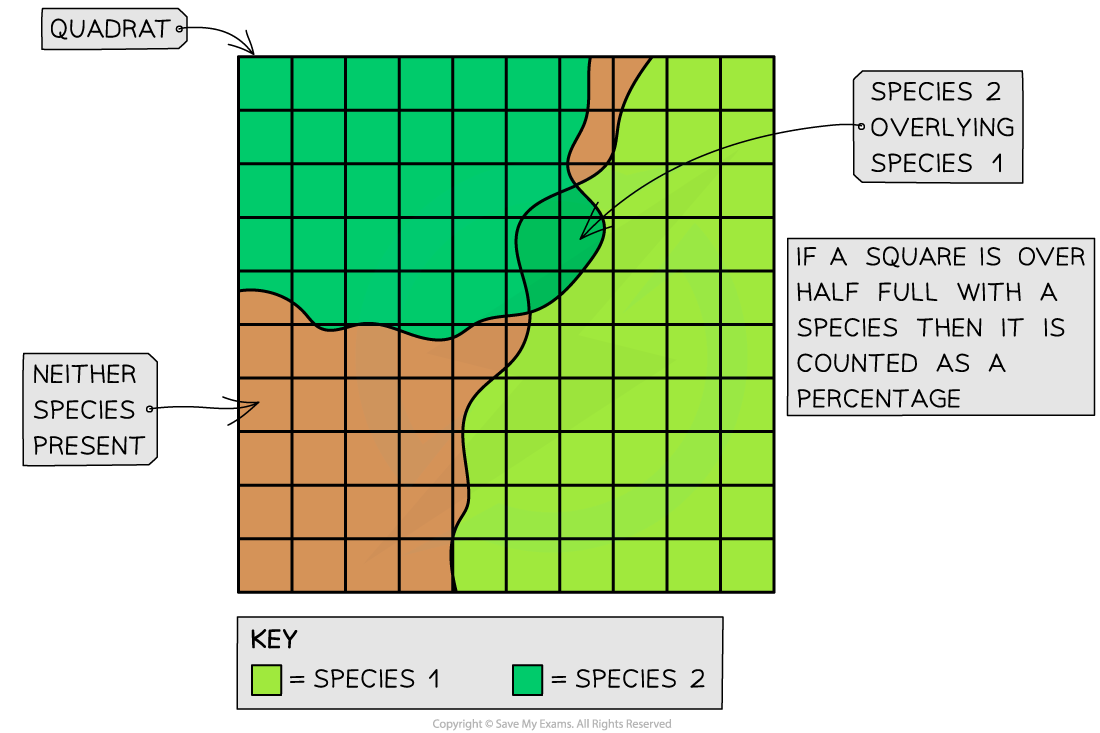
Abundance in a frame quadrat can be assessed by measuring percentage cover
Point quadrats
A point quadrat is a vertical frame with holes across the top through which pins are lowered
This is useful in areas with dense plant cover as the ground may be difficult to study using a frame quadrat
Point quadrats can be placed in a habitat randomly, e.g. using random co-ordinates, or systematically, e.g. along a transect
When a lowered pin touches a species, that species is recorded as being present
If several species are touching the pin then all of those species are recorded
Point quadrats can be used to measure abundance in the following ways
The number of individuals of a species present
Each individual that touches a pin is recorded
Percentage cover of a species
The number of pins touched by a species is divided by the total number of pins used
Most point quadrats have ten pins, so if all the pins are used then a species touching one pin counts as 10 percent cover

Point quadrats can be used to measure the the number of individuals of a species or percentage cover
Transects
Transects are lines laid out across a site that can be used to measure abundance and distribution across a habitat
Transects are useful for determining how species abundance and distribution might change along a gradient e.g. at increasing distances from a field margin or perpendicular to the water's edge on a rocky shore
To carry out a transect, a tape measure is laid out along the gradient of interest, and samples are taken along the line
There are different ways of carrying out transect studies
Continuous line transect
Every species touching the tape measure is recorded
Interrupted line transect
Species touching the line at regular intervals, e.g. every metre, are recorded
Continuous belt transect
Frame quadrats are placed end-to-end along the line
Interrupted belt transect
Frame or point quadrats are placed at regular intervals, e.g. every metre, along the line
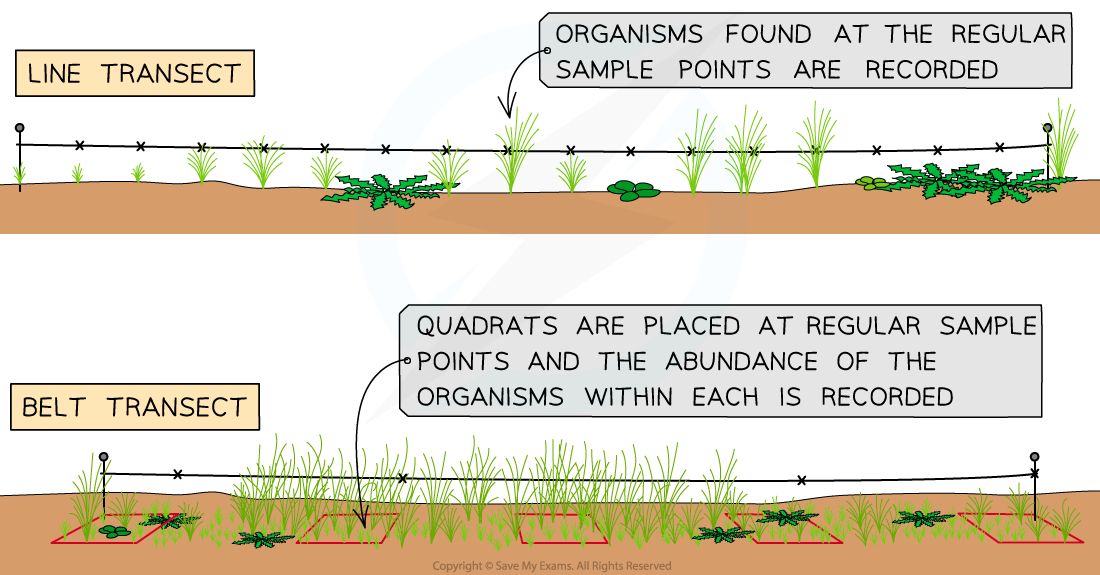
Interrupted line and belt transects can be used to measure abundance and distribution of species along a line across a habitat
Measuring abiotic factors
The distribution and abundance of species in a habitat are affected by abiotic factors
When investigating the impact of an abiotic factors on species abundance and distribution it is important to measure the relevant abiotic factors at the sample sites
It is only necessary to record relevant abiotic factors
A study may only be interested in one particular abiotic factor
Some abiotic factors may not be relevant in certain habitats e.g. water turbidity (cloudiness) will not be relevant in a woodland habitat
Abiotic factors can be measured using specialised equipment and techniques
Measuring Abiotic Factors Table

Representing results
The results of an investigation into the distribution and abundance of organisms can be represented visually using a type of graph known as a kite diagram
Kite diagrams can show both distribution and abundance
The distribution of a species along a transect can be shown by its position along a central horizontal line in each section of a kite diagram
Each section represents a different species
The distance along the transect is given on the x-axis, to which the horizontal line is parallel
The abundance of a species can be shown by the width of the 'kite' around the central horizontal line
The shape is referred to as a kite because it extends an equal distance on each side of the central horizontal line
Additional sections can be added to a kite diagram to show the changes in abiotic factors at different points along a transect e.g. the height above sea level or the pH of soil

Kite diagrams can be used to provide a visual representation of both abundance and distribution of species, as well as changes to abiotic factors such as elevation
Examiner Tips and Tricks
You could be asked to describe or design an investigation that could be used to measure the effect of a specific abiotic factor on species abundance or distribution, so make sure that you know the circumstances in which each sampling technique would be used, and how to use it.
Remember that when describing a practical you should always consider:
How you will change the independent variable
In this context you might be measuring a change in the independent variable, or abiotic factor, rather than causing the change yourself
Note that this might not be relevant if you have just been asked to measure the abundance of a species in one habitat
How you will measure the dependent variable
How you will ensure that your results are valid

You've read 0 of your 5 free revision notes this week
Unlock more, it's free!
Did this page help you?