Species Richness & Heterozygosity Index (Edexcel International A Level (IAL) Biology): Revision Note
Exam code: YBI11

Species Richness & Heterozygosity Index
The place where an organism lives is called its habitat
Habitats can vary in size, with some being very large (e.g. grasslands) while others are very small (e.g. a puddle of water that formed after heavy rain)
Measuring the species diversity within different habitats can be useful in making comparisons between them or when studying how habitats change over time
One way to determine species diversity is to measure species richness in a habitat
Species richness is the number of species within a community
A community is a group of populations of different species living in the same place at the same time that interact with each other
Species richness is the simplest way to measure species diversity
A community with a greater number of species will have a greater species richness score
For example, a tropical rain forest has a very high number of different species so it would be described as species-rich
Species richness can be a misleading indicator of diversity as it does not take into account the number of individuals of each species
Species abundance is a measure of the relative number of individuals in the different species within a given area
In the example below, Area 1 and Area 2 both contain 4 tree species
However, Area 2 is actually dominated by one species and in fact, one of the species is very rare (only one individual)
Although the two areas have exactly the same species richness, Area 1 has a higher species abundance (and therefore a higher overall species diversity) than Area 2
This example illustrates the limitations of using just species richness on its own
Conservationists often favour the use of an index of diversity as it takes into account species number and evenness

Area 1 and 2 have the same species richness but different species abundance. Area 1 will have a higher overall species diversity as it has a higher species abundance. Species diversity takes both richness and abundance into account.
Measuring the different levels of biodiversity within an ecosystem can be challenging
Finding out which species live in an ecosystem and the size of the populations requires the identification and cataloguing of all organisms present to build a species list
This is possible for areas that are very small or where the species are very large like trees
However, for larger and more complex ecosystems like rainforests, it is simply impossible to find, identify and count every organism that exists there
When this is the case, different samples of the area can be taken and used to make an estimate for the total species numbers in the area
Random sampling
Some ecosystems are very complex with large numbers of different species of different sizes
For the sake of logistics, random sampling is often used to estimate the distribution and abundance of species
The distribution of a species describes how it is spread throughout the ecosystem
The abundance of a species is the number of individuals of that species
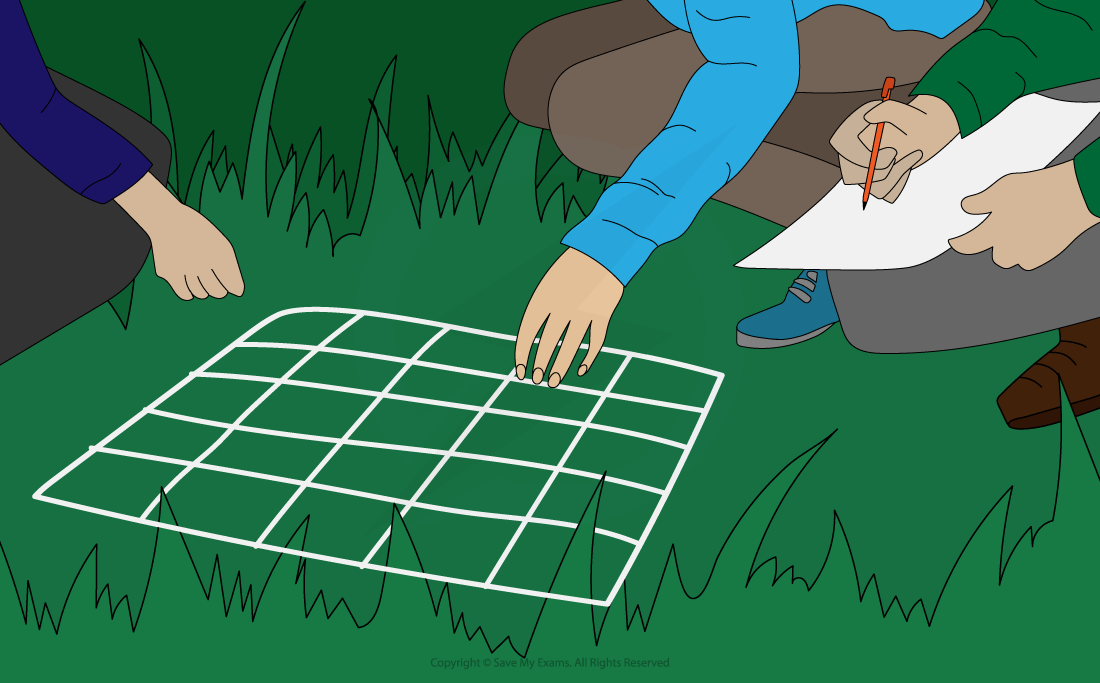
When carrying out sampling, square frames called quadrats can be used to mark off the area being sampled
Quadrats are square frames made of wood or wire
They can be a variety of sizes eg. 0.25m2 or 1m2
They are placed on the ground and the organisms within them are recorded
They can be used to measure the distribution and abundance of plants
Using a quadrat to investigate population size or distribution
Quadrats of different sizes can be used depending on what is being measured and what is most suitable in the space the samples are being made in
Quadrats must be laid randomly in the area to avoid sampling bias
This random sampling can be done by converting the sampling area into a grid format and labelling each square on the grid with a number
Then a random number generator is used to pick the sample points
Once the quadrat has been laid on the chosen sample point the abundance or percentage cover of all the different species present can be recorded
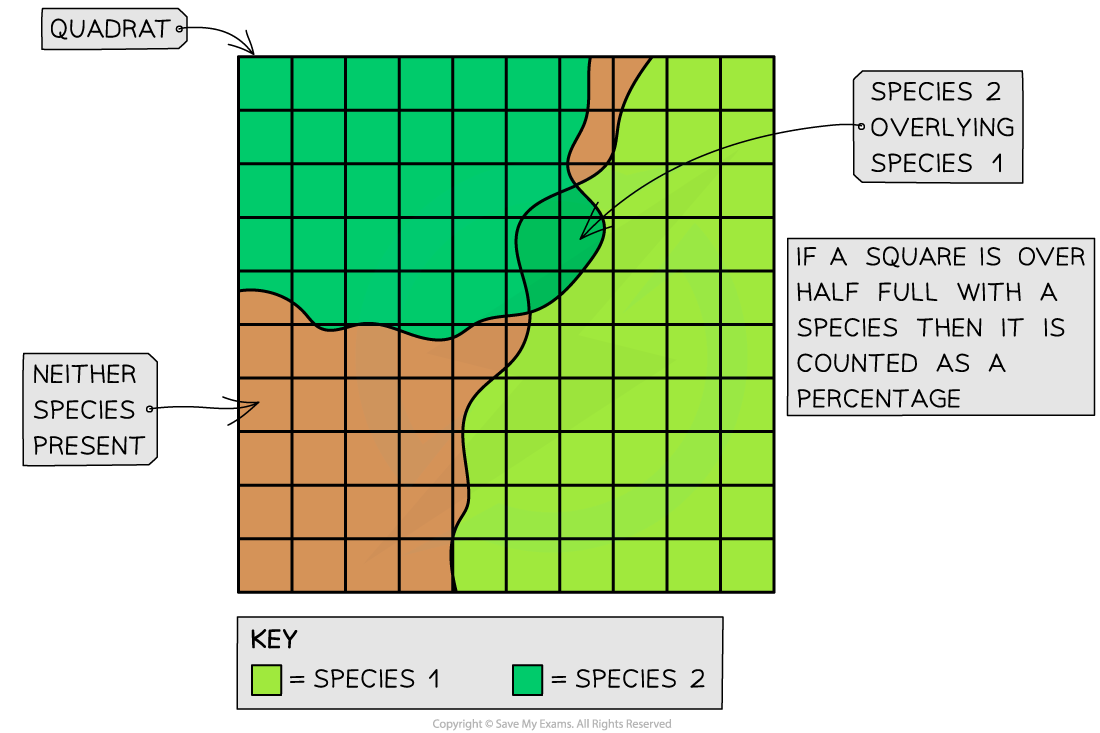
Using a quadrat to investigate the percentage cover of two species of grass. Some squares may be lacking any species while other squares may have multiple species in them - this means that the total percentage cover may sometimes be over or under 100%
Quadrats are suitable for sampling plants
For many animal species, however, it is not possible to use quadrats to measure their distribution and abundance
In these cases, other techniques involving other items of equipment are necessary, including:
Sweeping nets: these are large, strong nets with a fine material (very small holes) that are used to catch flying insects and insects that live in long grass by sweeping the net back and forth through the grass
Pitfall traps: these are cans or jars that are buried in the ground that are used to catch ground-dwelling (often nocturnal) insects and other invertebrates as they fall into the trap
Kick-sampling: this technique is used to catch freshwater invertebrates living in streams or rivers. A net in placed on the stream-bed so that the water is flowing into it and the stream-bed just above the net is churned up by the scientist (using their foot) for a set period of time. The invertebrates are carried by the stream into the net
Take as many samples as possible to get a more accurate indication of the entire habitat
The results can be used to estimate the total number of individuals or species richness in the habitat
It is important to use the same sampling method when gathering data to compare different habitats with one another

Example of how a pitfall trap can be used

Example of how kick-sampling is done
Measuring genetic diversity within a species
Genetic diversity refers to the different alleles that occur within the gene pool of a species or a population
The greater the allele variety within a species, the higher the genetic diversity will be
Measurements of genetic diversity is useful to investigate changes occurring in a population over time or when comparing two species with one another
To measure genetic diversity two factors can be considered:
Phenotype
Genotype
The phenotype of an organism refers to its observable features
Different alleles are responsible for the variety of phenotypes that can be observed within a species
Therefore, the greater the variety of phenotypes within a species, the higher the genetic diversity
An organism's genotype is determined by the different alleles that are found within the cells
Different alleles will have a different order of bases in the DNA molecules
These base orders can be determined by sequencing the DNA of individuals in a species
The higher the number of different alleles for a characteristic, the greater the genetic diversity within that species
Another way to determine the genetic diversity within a species is to use the heterozygosity index
Heterozygosity index
Organisms that have two different alleles at a particular gene locus are known as heterozygotes
The higher the proportion of heterozygotes in a population, the greater the genetic diversity of that population will be
We can use the following formula to calculate the heterozygosity index (H):
![]()
Worked Example
In pea plants the gene controlling seed shape exist in two forms: Allele R codes for round seeds and is dominant over allele r which codes for wrinkled seeds. It is found that within a population of 620 pea plants, there are 350 heterozygous (Rr) individuals.
Calculate the heterozygosity index for the pea plants at the locus for seed shape.
Answer:
The formula is:
![]()
![]()
![]()
It is possible to determine the value for H at many loci, then calculate an average value
This value can then be used as an estimation of the genetic diversity of the entire genome of the population

You've read 0 of your 5 free revision notes this week
Unlock more, it's free!
Did this page help you?