Velocity-Time Graphs (Oxford AQA IGCSE Combined Science Double Award) : Revision Note

Calculating Acceleration from a Velocity-Time Graph
Extension Tier only
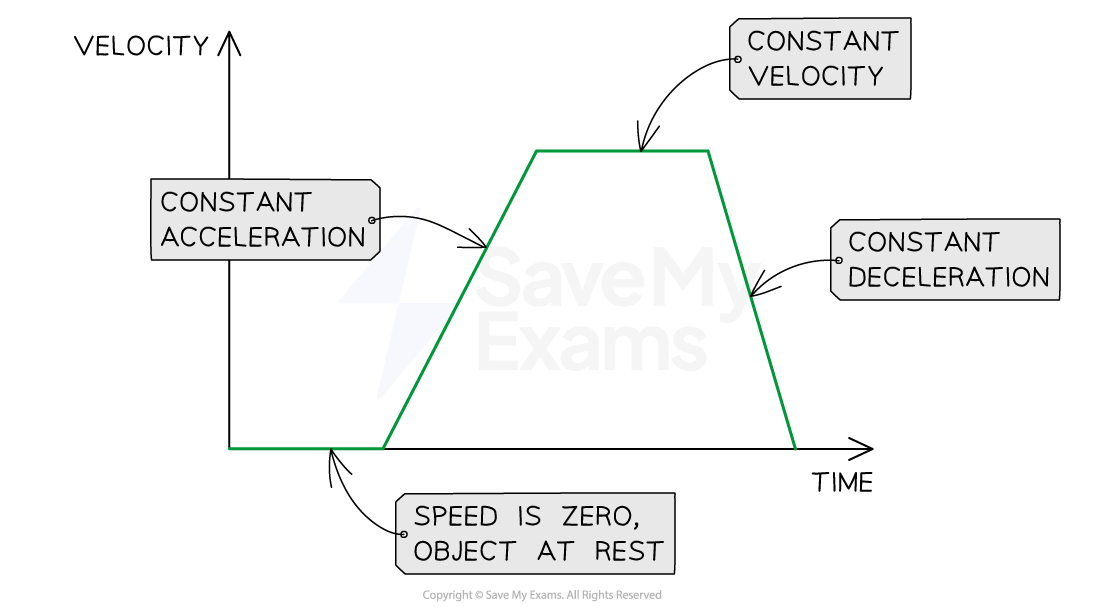
The gradient of the line on a velocity-time graph represents the magnitude of acceleration
A steep gradient means large acceleration (or deceleration)
The object's velocity changes very quickly
A gentle gradient means small acceleration (or deceleration)
The object's velocity changes very gradually
A horizontal line means the acceleration is zero
The object is moving with a constant velocity
A constant velocity means a constant speed in a straight line
A horizontal line at v = 0 shows a stationary object
Interpreting gradients on a Velocity-Time graphs
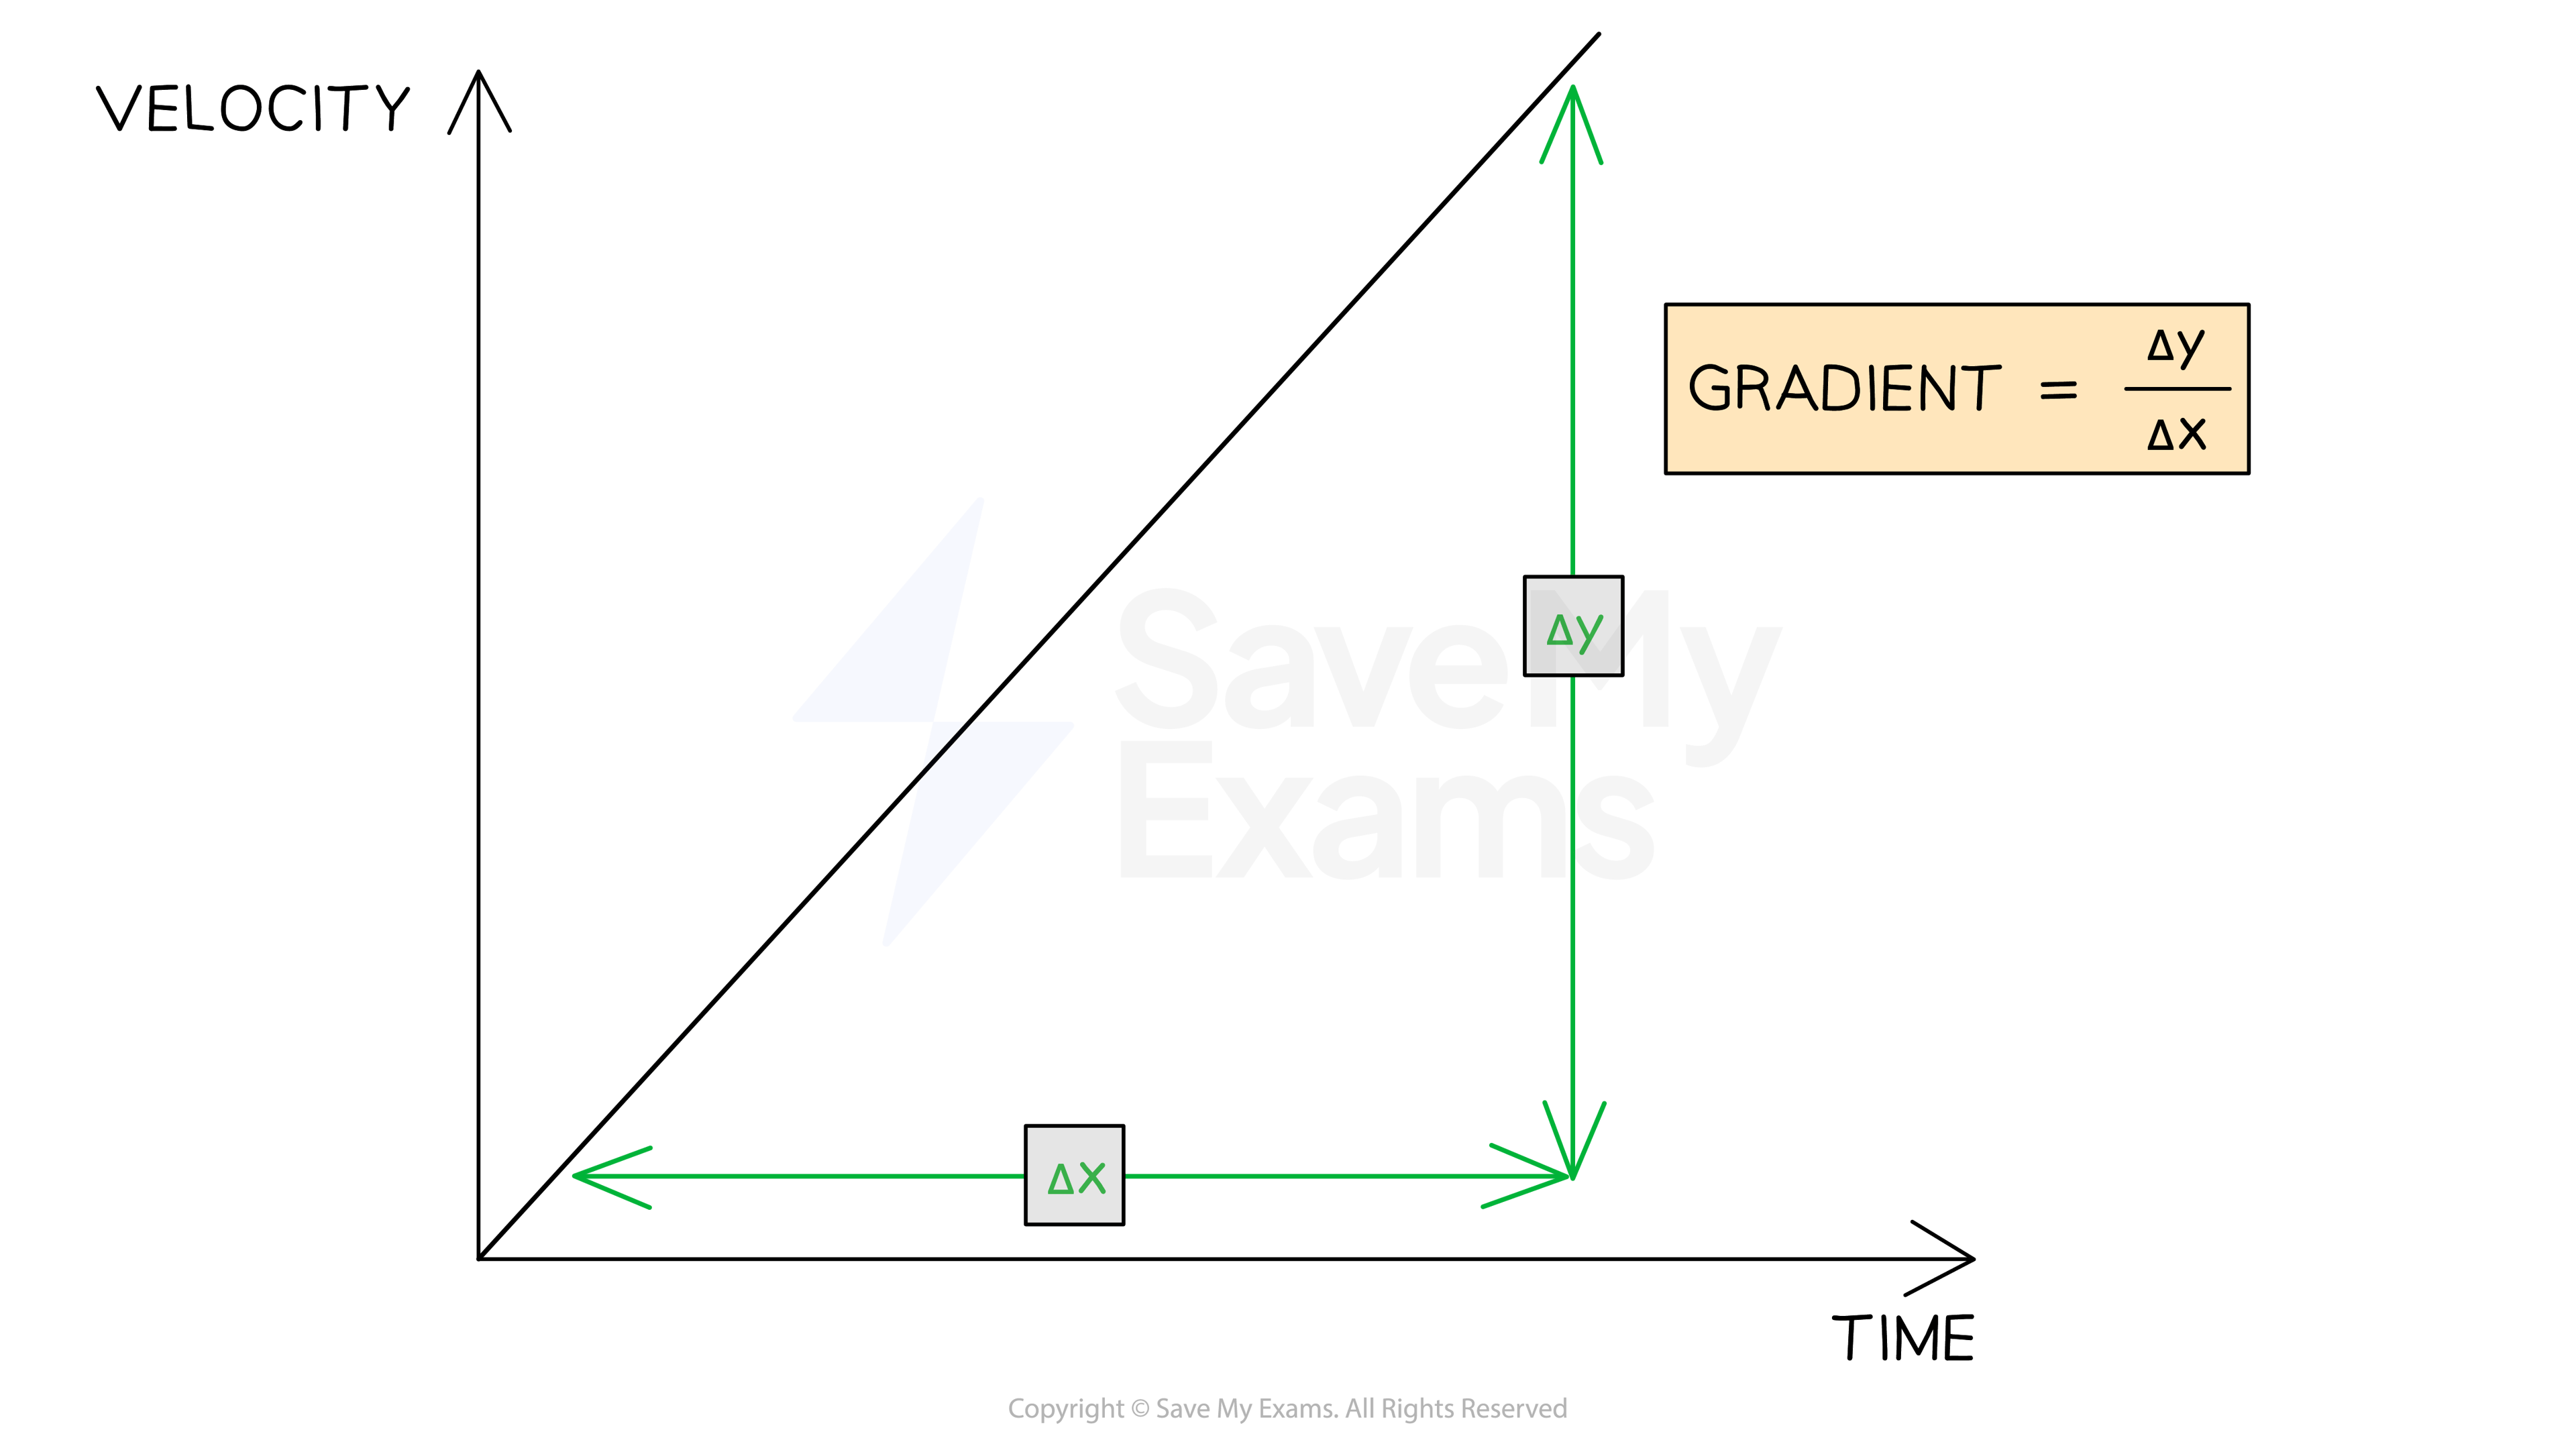
The acceleration of an object can be calculated from the gradient of a velocity-time graph
![]()
Here, Δy is change in velocity and Δx is change in time
Calculating the gradient of a Velocity-Time graph
Worked Example
A cyclist is training for a tournament.
The velocity-time graph below shows the cyclist's motion as they cycle along a flat, straight road.
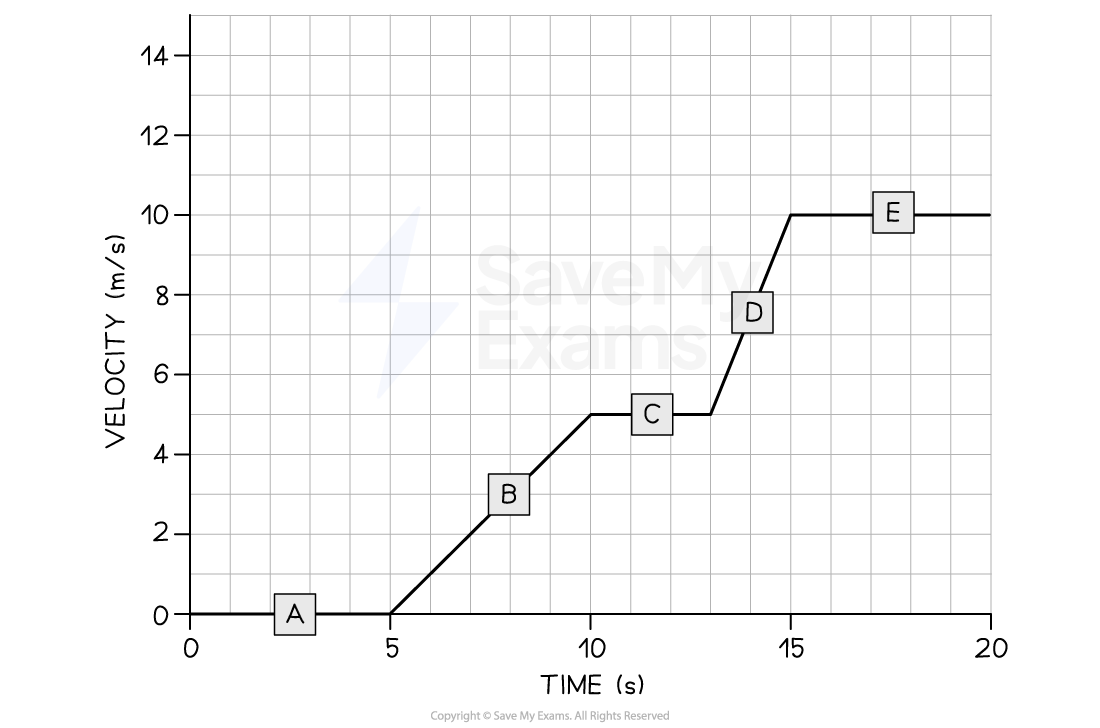
(a) In which section of the velocity-time graph is the cyclist's acceleration the largest?
(b) Calculate the cyclist's acceleration between 5 and 10 seconds.
Answer:
Part (a)
Step 1: Recall what the gradient of a velocity-time graph shows
The gradient of a velocity-time graph indicates the magnitude of acceleration
Therefore, the only sections of the graph where the cyclist is accelerating are section B and section D
Sections A, C, and E are flat – in other words, the cyclist is moving at a constant speed (i.e. not accelerating)
Step 2: Identify the section with the steepest gradient
Section D of the graph has the steepest gradient
Hence, the greatest acceleration is shown in section D
Part (b)
Step 1: Draw a large gradient triangle at the appropriate section of the graph
A gradient triangle is drawn for the time interval between 5 and 10 seconds below:

Step 3: Calculate the gradient
![]()
![]()
![]()
Therefore, the cyclist accelerated at 1 m/s2 between 5 and 10 seconds
Examiner Tips and Tricks
Use the entire gradient line, where possible, to calculate the gradient. Examiners tend to award credit if they see a large gradient triangle used - so remember to draw the lines directly on the graph itself!
Calculating Distance from a Velocity-Time Graph
Extension Tier only
The distance travelled by an object can be found by determining the area beneath a velocity-time graph
Calculating the area under a Velocity-Time graph

If the area beneath the graph forms a triangle (the object is accelerating or decelerating) then the area can be determined using the formula:
![]()
If the area beneath the graph is a rectangle (constant velocity) then the area can be determined using the formula:
![]()
Worked Example
The velocity-time graph below shows a car journey which lasts for 160 seconds.
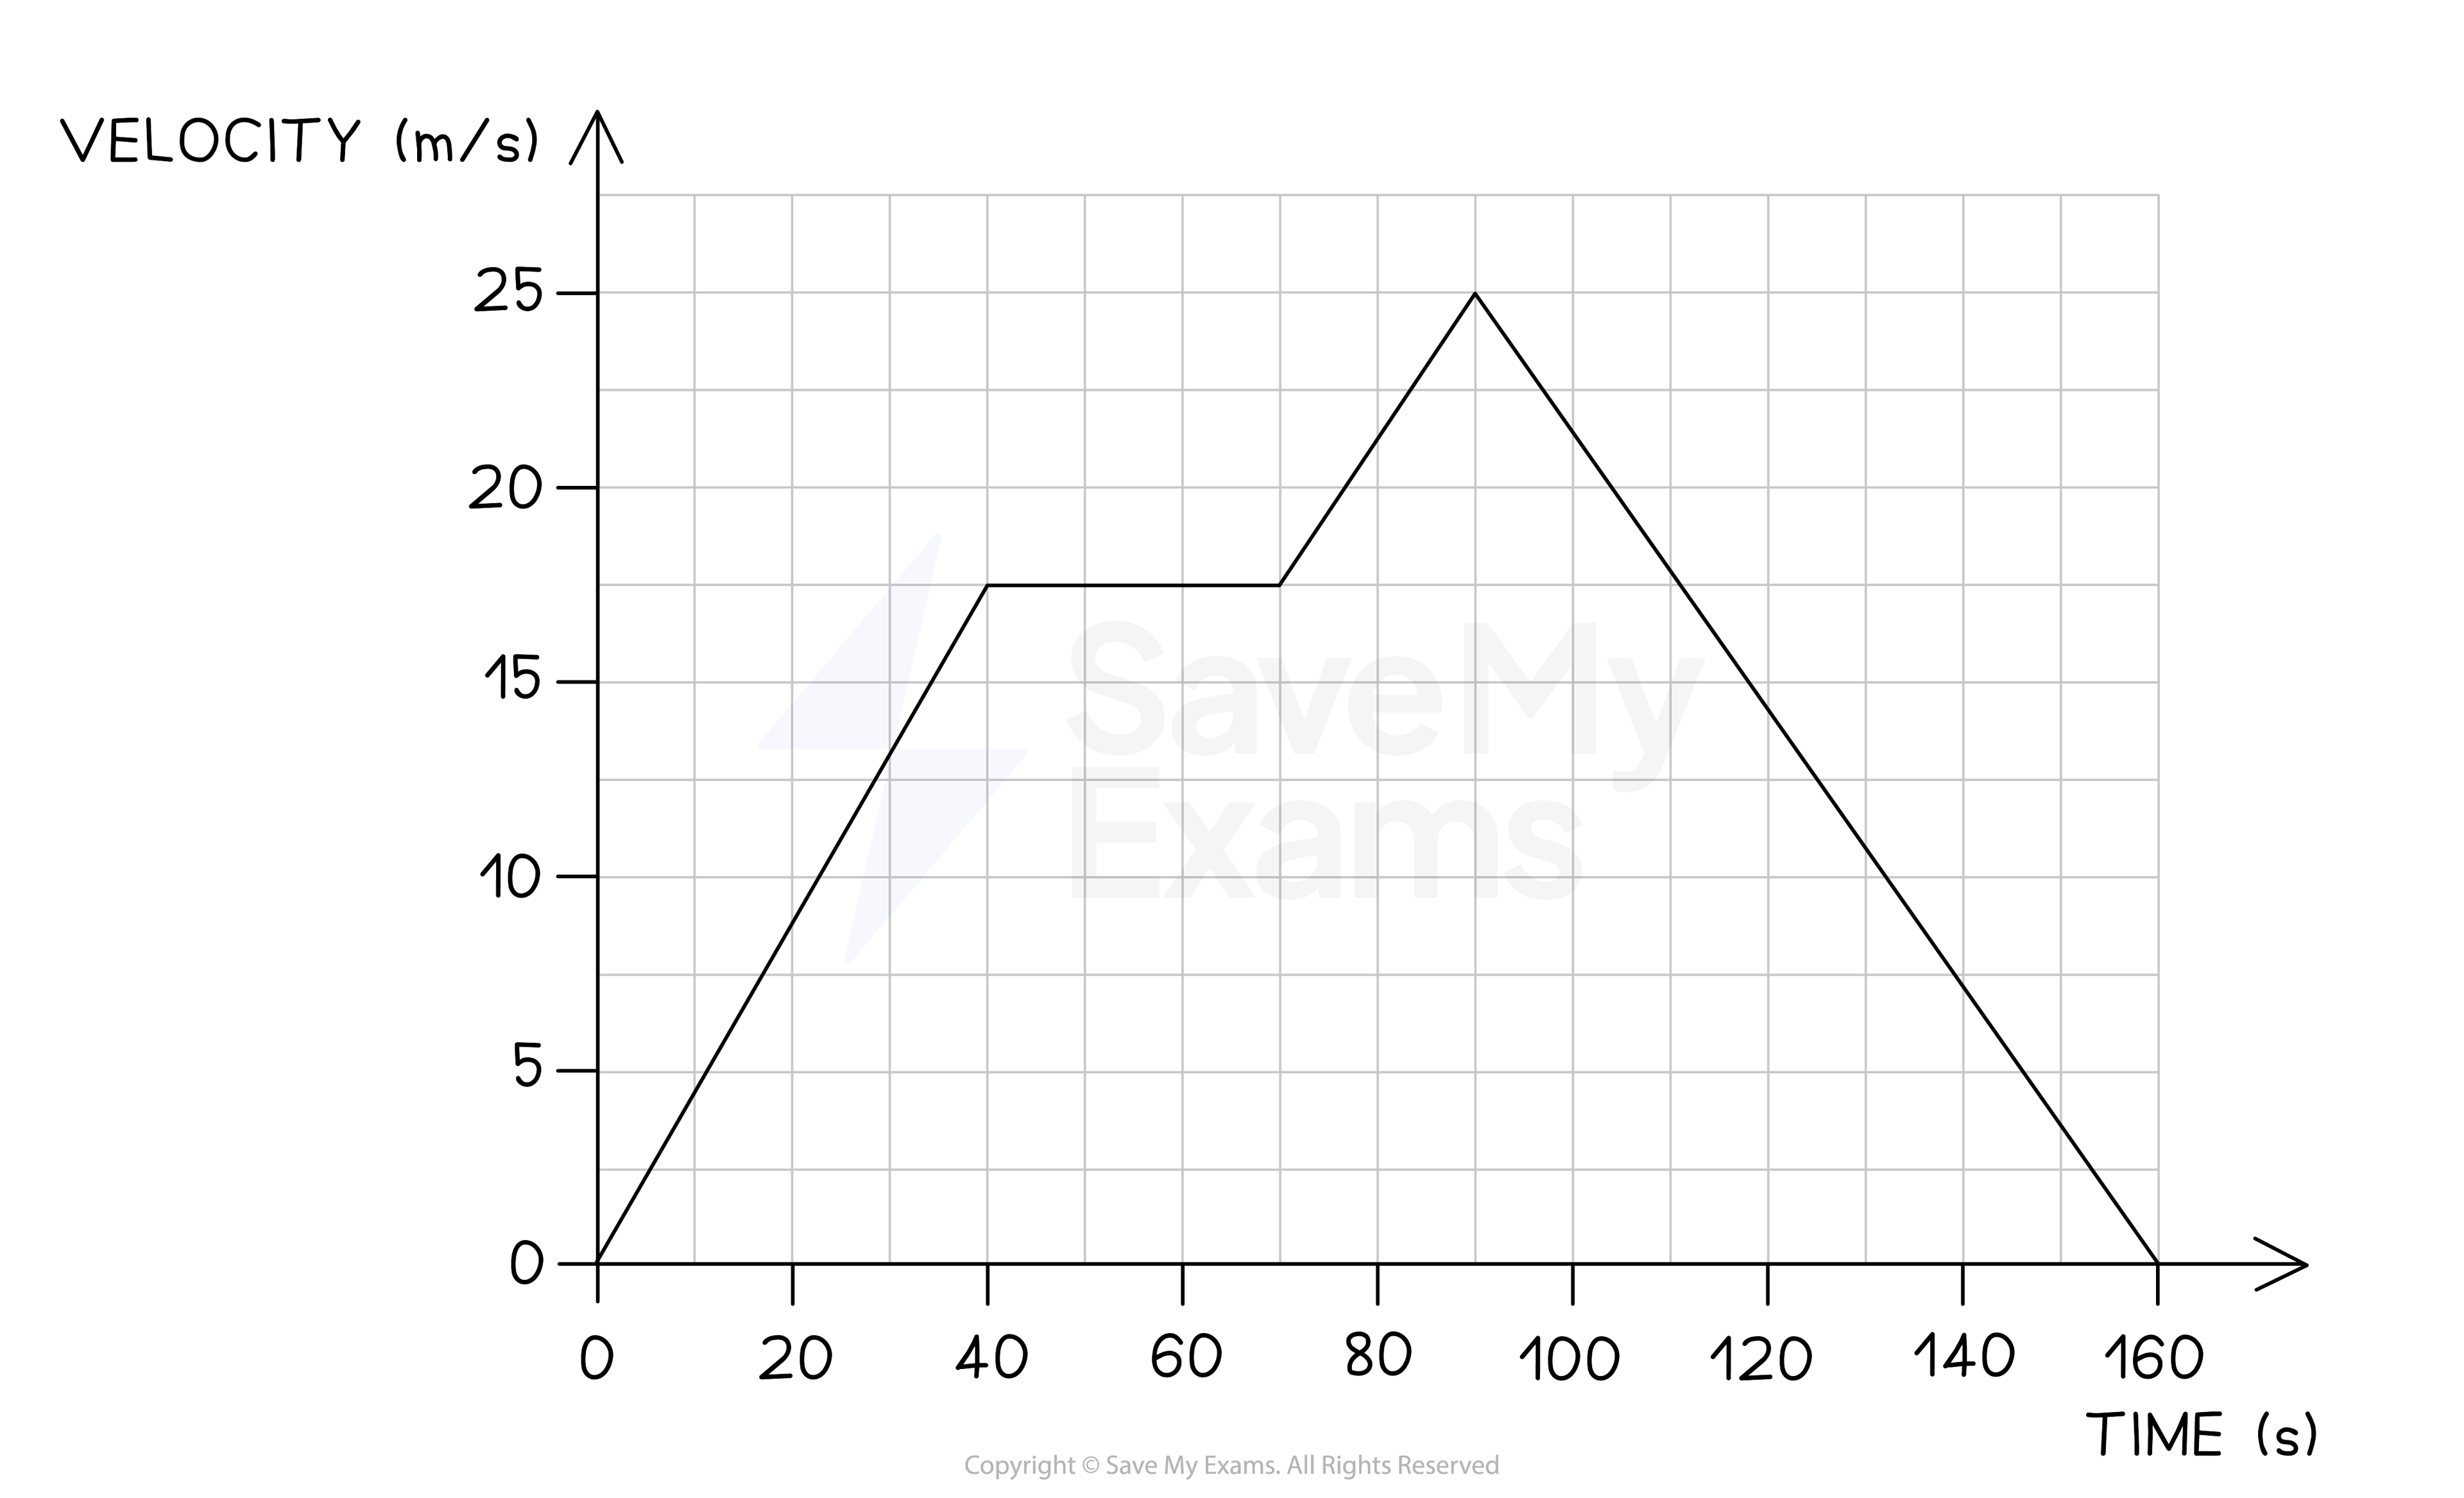
Calculate the total distance travelled by the car on this journey.
Answer:
Step 1: Recall that the area under a velocity-time graph represents the distance travelled
To calculate the total distance travelled, the total area underneath the line must be determined
Step 2: Identify each enclosed area
In this example, there are five enclosed areas under the line
These can be labelled as areas 1, 2, 3, 4 and 5, as shown in the image below:
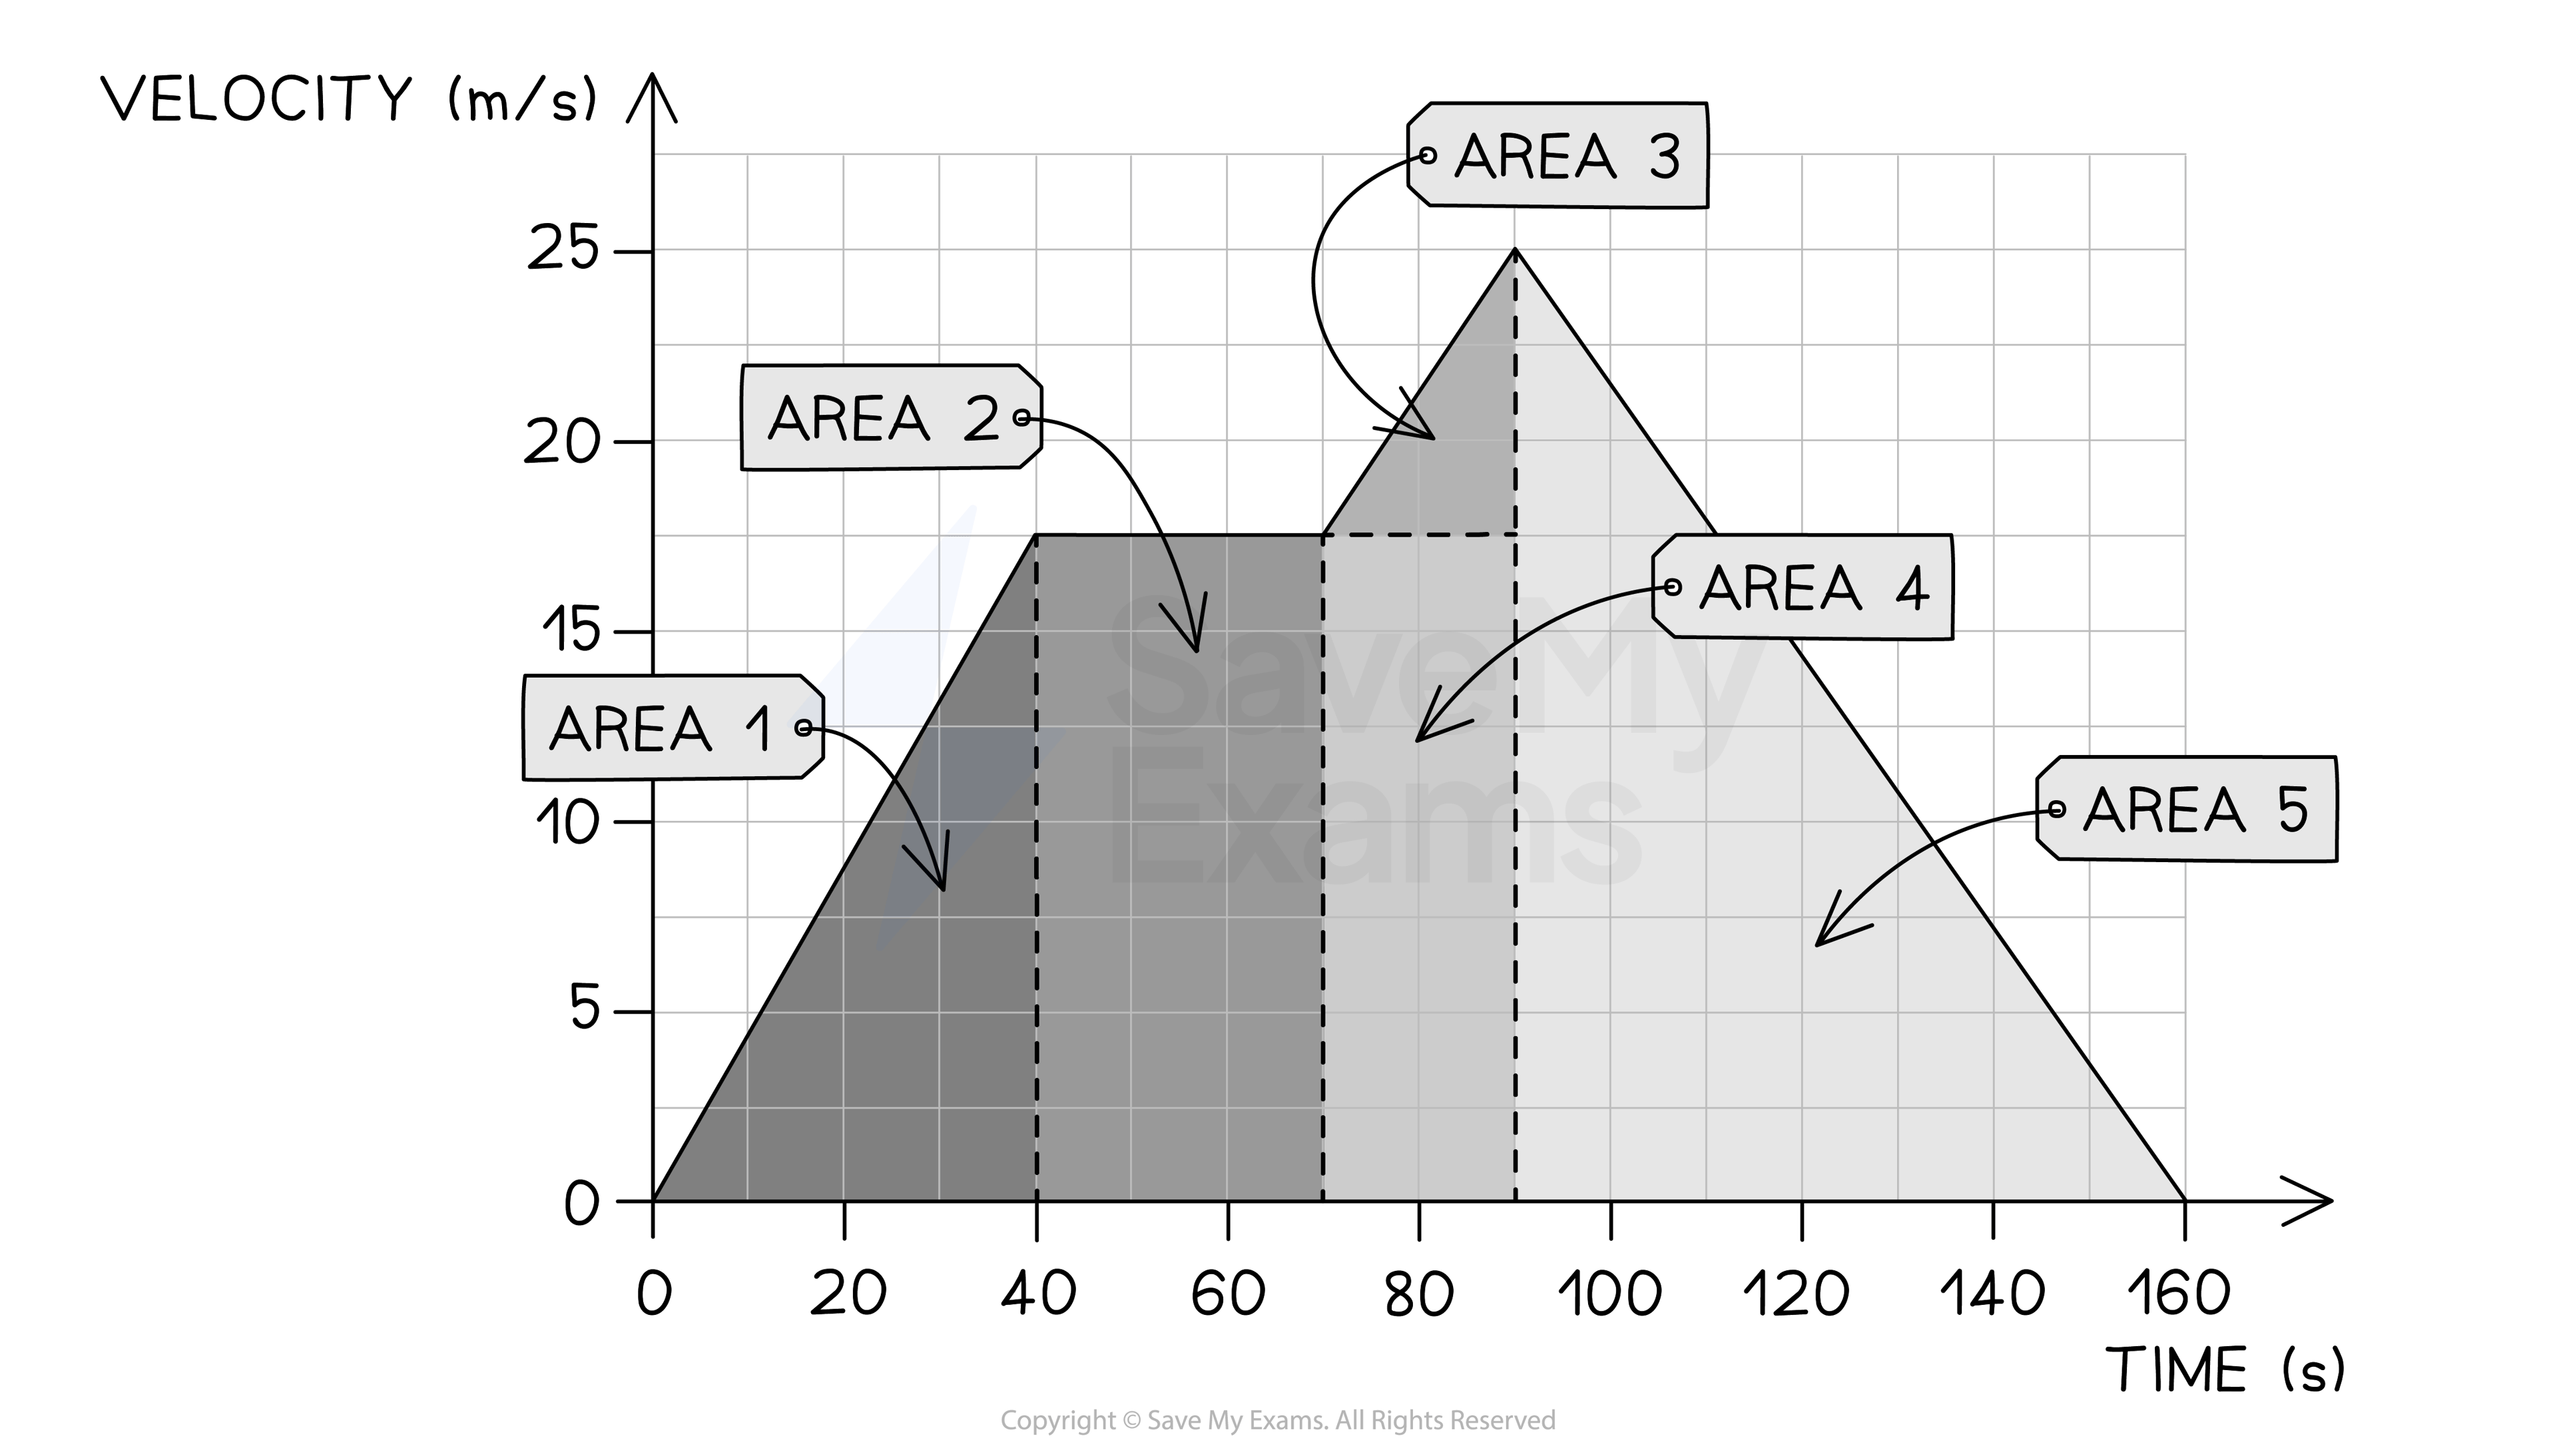
Step 3: Calculate the area of each enclosed shape under the line
Area 1 = area of a triangle
![]()
![]()
![]()
Area 2 = area of a rectangle
![]()
![]()
![]()
Area 3 = area of a triangle
![]()
![]()
![]()
Area 4 = area of a rectangle
![]()
![]()
![]()
Area 5 = area of a triangle
![]()
![]()
![]()
Step 4: Calculate the total distance travelled by finding the total area under the line
Add up each of the five areas enclosed:
![]()
![]()
![]()

You've read 0 of your 5 free revision notes this week
Sign up now. It’s free!
Did this page help you?
