Paper Chromatography (Oxford AQA IGCSE Combined Science Double Award) : Revision Note
Paper Chromatography
Chromatography is used to separate substances and provide information to help identify them
The components have different solubilities in a given solvent
E.g. Different coloured inks that have been mixed to make black ink
A pencil line is drawn on chromatography paper and spots of the sample are placed on it
A pencil is used for this as ink would run into the chromatogram along with the samples
The paper is then lowered into the solvent container, making sure that the pencil line sits above the level of the solvent so the samples don’t wash into the solvent container
The solvent travels up the paper by capillary action, taking some of the coloured substances with it
Different substances have different solubilities so they will travel at different rates, causing the substances to spread apart
Those substances with higher solubility will travel further than the others
The solvent used is usually water but it can be other substances such as ethanol
How to carry out chromatography

Rf Values
These values are used to identify the components of mixtures
The Rf value of a particular compound is always the same but it is dependent, however, on the solvent used
If the solvent is changed then the value changes
The retention factor, Rf, is calculated by the equation:
Rf =
The Rf value is a ratio and therefore has no units and will be less than 1
Worked Example
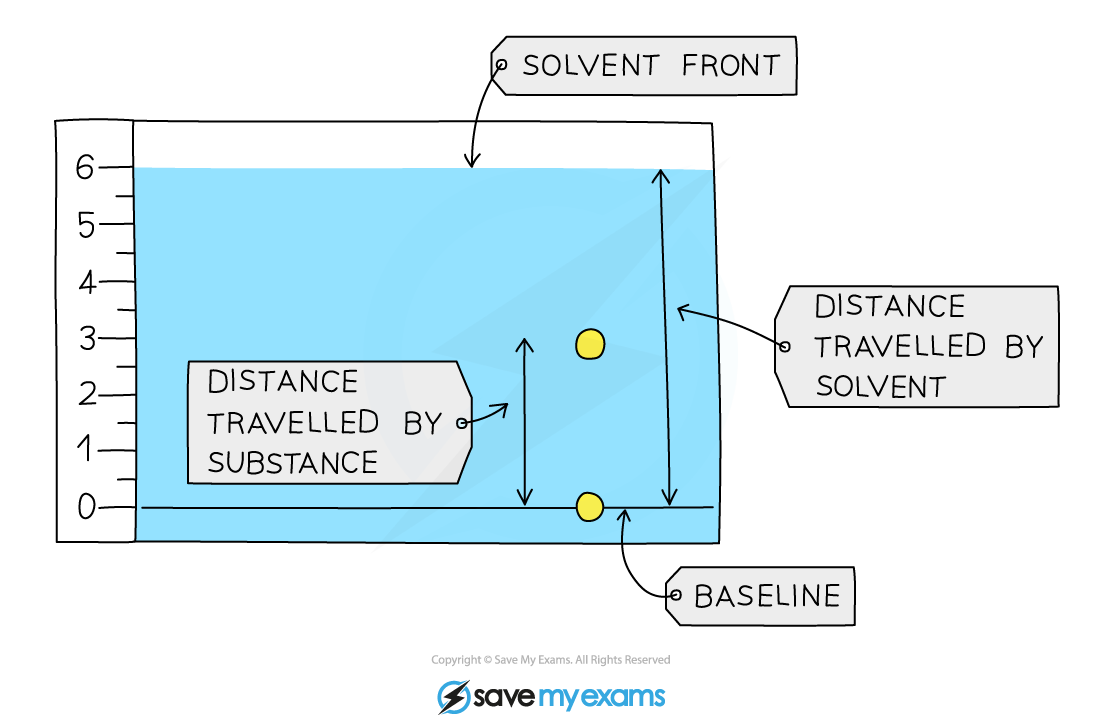
A student obtained the following chromatogram when carrying out chromatography.

Calculate the Rf value of the substance.
Answer:
The Rf value of the substances in the chromatogram above can be calculated by:
Rf =
Examiner Tips and Tricks
When you calculate Rf values in exams, make sure to use your ruler carefully to measure the distance moved by the solvent and the substance as mark schemes can be strict about the values accepted for these.
Extension Tier Only
Calculating the Rf value allows chemists to identify components in a mixture and unknown compounds
This is achieved by comparing experimental Rf values with the Rf values of known substances under the same conditions
Stationary & Mobile Phases
All chromatography techniques use two phases called the mobile phase and the stationary phase
In paper chromatography:
The mobile phase is the solvent in which the sample molecules can move
In paper chromatography, this is usually water or ethanol
The stationary phase in paper chromatography is the actual chromatography paper itself
The substances which are more soluble in the solvent will travel further up the paper because they spend more time in the mobile phase and are therefore carried further up the paper than the less soluble components
Interpreting chromatograms
We can use a chromatogram to compare the substances present in a mixture to known substances and make assumptions
Pure substances will produce only one spot on the chromatogram
If two or more substances are the same, they will produce identical chromatograms
If the substance is a mixture, it will separate on the paper to show all the different components as separate spots
Example chromatogram results

We can draw several conclusions from this chromatogram:
The brown ink is a mixture as there are three dots
Red, yellow and blue are pure as there is only one dot for each
The brown ink contains red, blue and yellow as the dots are in line with one another
Examiner Tips and Tricks
Chromatograms in exams will be in black and white so to identify whether a mixture contains a known sample, the dots need to be in line with one another.

You've read 0 of your 5 free revision notes this week
Unlock more, it's free!
Did this page help you?

