Investigating Resistance (Cambridge (CIE) IGCSE Co-ordinated Sciences (Double Award)) : Revision Note

Investigating resistance
Aim of the experiment
The aim of this experiment is to investigate how the length of a wire at a constant temperature affects the resistance of electrical circuits
Variables
Independent variable = Length of resistance wire, L
Dependent variable = Resistance, R
Control variables:
Voltage of the power supply
Temperature of the wire
Equipment
Equipment list
Equipment | Purpose |
|---|---|
power supply / cell / battery | to supply a source of voltage to the circuit |
wires | to connect the components in the circuits |
crocodile clips | to connect different lengths of the resistance wire |
ammeter | to measure the current through the circuit |
voltmeter | to measure the voltage across the resistors |
2 or more resistors | to provide resistance in the circuit |
thin resistance wire | to provide resistance in the circuit |
metre rule | to measure the length of the resistance wire |
Resolution of measuring equipment:
Metre ruler = 1 mm
Ammeter = 0.01 A
Voltmeter = 0.1 V
Method
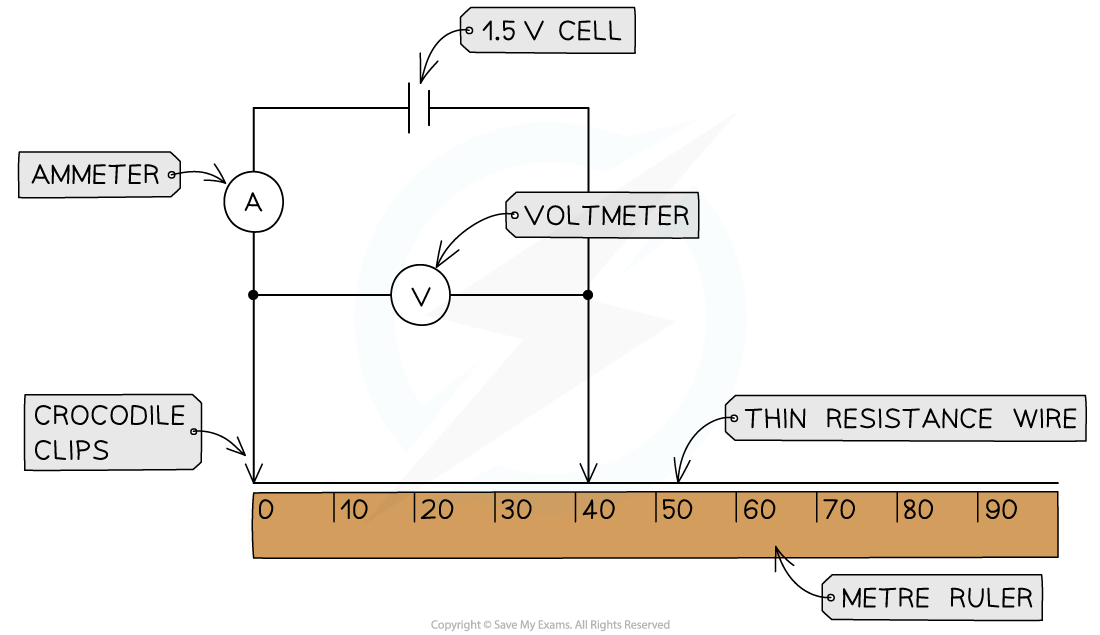
Apparatus to measure the resistance of different lengths of wire
Set up the apparatus by connecting two crocodile clips to the thin resistance wire a distance of 10 cm apart and setting the power supply to 1.5 V
Connect the wire, using the clips, to the rest of the circuit
Record the potential difference from the voltmeter and current from the ammeter
Move the clips in 10 cm intervals further apart
Take new measurements from the voltmeter and ammeter for each length reading
Continue until the crocodile clips are a length of 1 m apart
Example results table

Analysis of results
Calculate the resistance of each length of wire using the equation:
![]()
Where:
R = resistance (Ω)
V = voltage (V)
I = current (A)
Plot a graph of resistance (on the y-axis) against length (on the x-axis) and draw a line of best fit
Graph of resistance against length
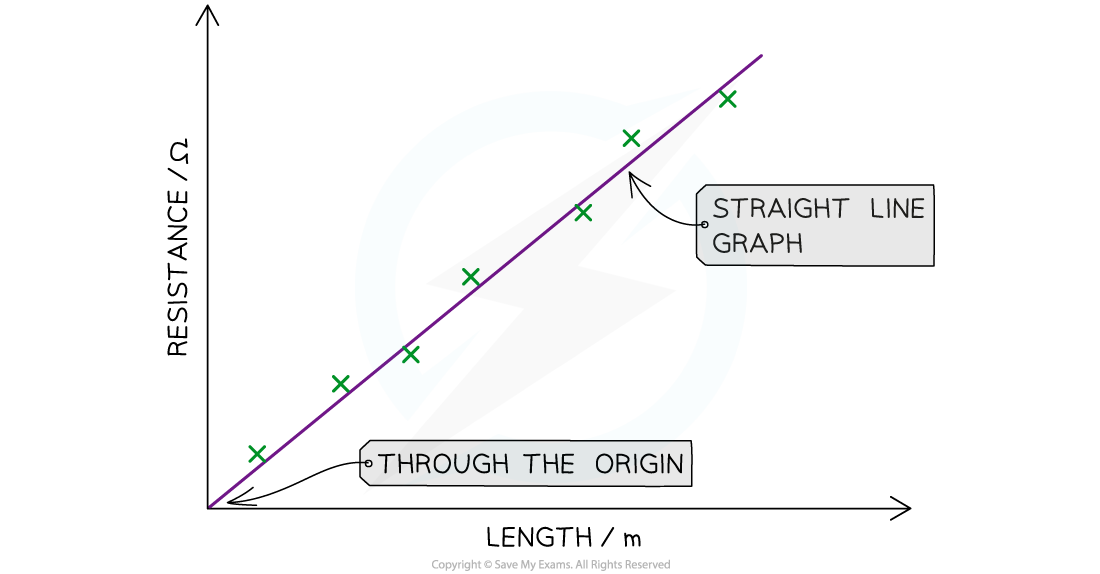
The expected graph of resistance against length should be a straight line through the origin
The graph should be a straight line through the origin with a positive correlation
This means that the longer the piece of wire, the higher the resistance
In other words, the resistance is directly proportional to the length of the wire
Evaluating the experiment
Systematic errors
Eradicate zero error in measurements of length, current and voltage by
ensuring the first crocodile clip (connected to the circuit, not the wire) starts at 0 on the ruler
ensuring both the ammeter and voltmeter start from 0
Random errors
Keep the temperature of the wire constant (to ensure resistance stays constant) by
using low values of current throughout the experiment
switching off the current between readings
Repeat the experiment by reducing the length of the wire 10 cm each time down to a length of 10 cm
Add more resistors in series and parallel to calculate the effect on the combined resistance
Safety considerations
When there is a high current flowing through a thin wire, the wire will become very hot
Make sure never to touch the wire directly when the circuit is switched on
Switch off the power supply right away if burning is smelled
Make sure there are no liquids close to the equipment, as this could damage the electrical equipment or increase the risk of electrocution

You've read 0 of your 5 free revision notes this week
Sign up now. It’s free!
Did this page help you?