Efficiency (Edexcel IGCSE Physics (Modular)) : Revision Note
Efficiency
What is efficiency in an energy transfer?
The efficiency of a system is a measure of the amount of wasted energy in an energy transfer
Efficiency is defined as:
The ratio of the useful energy output from a system to its total energy output
If a system has high efficiency, this means most of the energy transferred is useful
If a system has low efficiency, this means most of the energy transferred is wasted
The equation for efficiency
Efficiency is represented as a percentage
The equation for efficiency is:
Total energy output is equal to total energy input due to the principle of conservation of energy
total energy input = total energy output
Total energy output is the sum of the useful energy output and the wasted energy
total energy output = useful energy output + wasted energy
Worked Example
The blades of a fan are turned by an electric motor. In one second, 300 J of energy is transferred electrically from the mains supply. 85 J is wasted due to friction and sound.
Calculate the efficiency of the motor.
Step 1: List the known quantities
Total energy input = 300 J
Total wasted energy = 85 J
Step 2: State the equation for efficiency
Step 3: Determine total energy output
Due to the conservation of energy:
total energy input = total energy output
Therefore, total energy output = 300 J
Step 4: Calculate the useful energy output
total energy output = useful energy output + wasted energy
useful energy output = total energy output − wasted energy
useful energy output = 300 − 85 = 215 J
Step 5: Substitute these values into the equation for efficiency
Examiner Tips and Tricks
The equation for efficiency can be used to give a ratio (between 0 and 1) or percentage (between 0 and 100%)
If the question asks for efficiency as a ratio, give your answer as a fraction or decimal (do not multiply by 100%)
If the answer is required as a percentage, remember to multiply the ratio by 100 to convert it:
if the ratio = 0.25, percentage = 0.25 × 100 = 25 %
Remember that efficiency has no units (only %)
Sankey diagrams
What are Sankey diagrams?
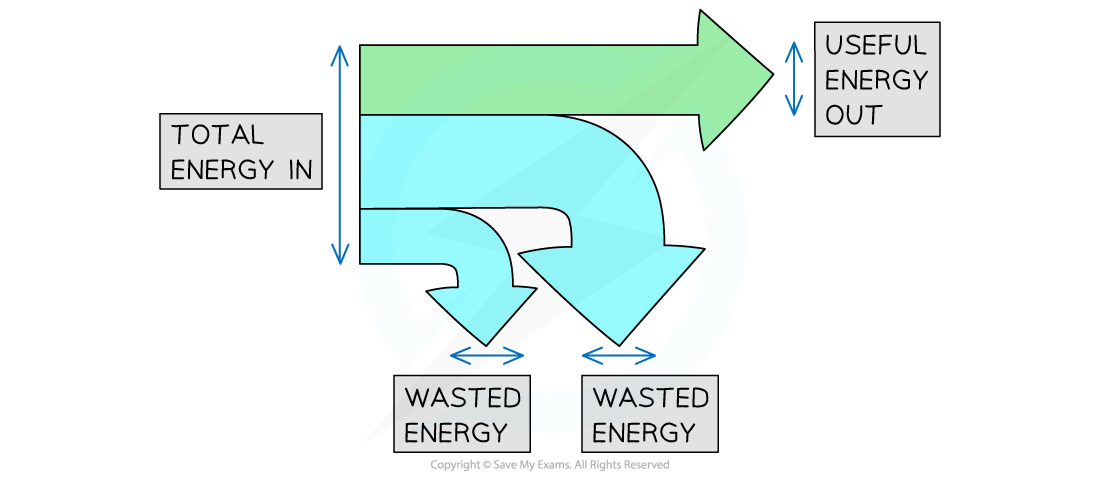
Sankey diagrams are visual representations of energy transfers
Sankey diagrams are characterised by the splitting arrows that show the proportions of the energy transfers taking place
The different parts of the arrow in a Sankey diagram represent the different energy transfers:
The left-hand side of the arrow (the flat end) represents the energy transferred into the system
The straight arrow pointing to the right represents the energy that ends up in the desired store; this is the useful energy output
The arrows that bend away represent the wasted energy
Example of a Sankey diagram

Total energy in, wasted energy and useful energy out shown on a Sankey diagram
The width of each arrow on a Sankey diagram is proportional to the amount of energy being transferred
As a result of the conversation of energy:
Total energy in = total energy out
Total energy in = Useful energy out + Wasted energy
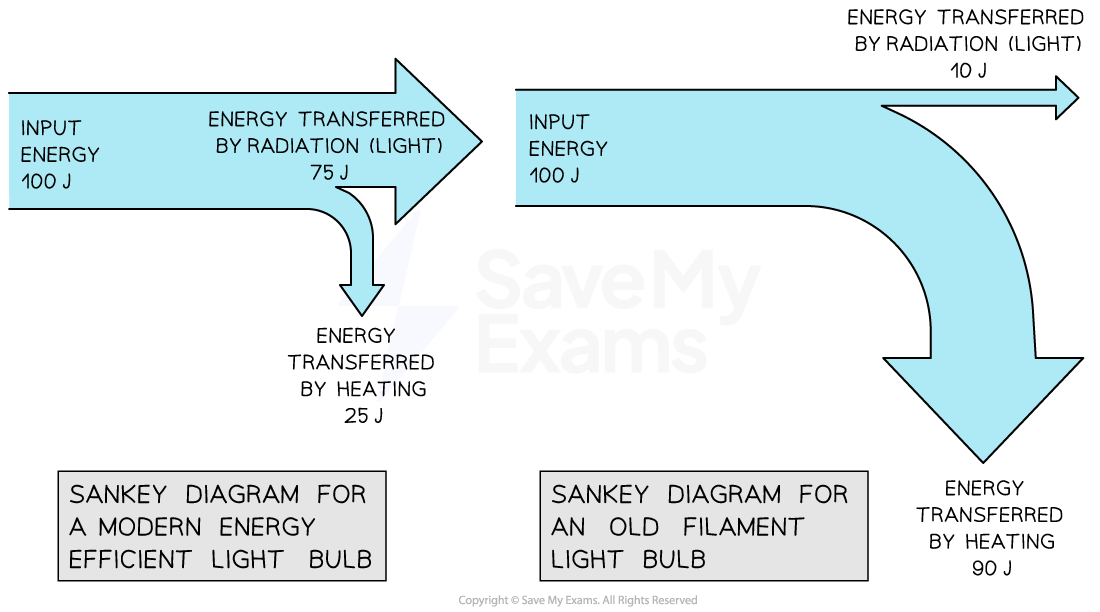
A Sankey diagram for a modern efficient light bulb will look very different from that for an old filament light bulb
A more efficient light bulb has less wasted energy
This is shown by the smaller arrow downwards representing the heat energy
Sankey diagram of light bulbs

Sankey diagram for modern vs. old filament light bulb
Worked Example
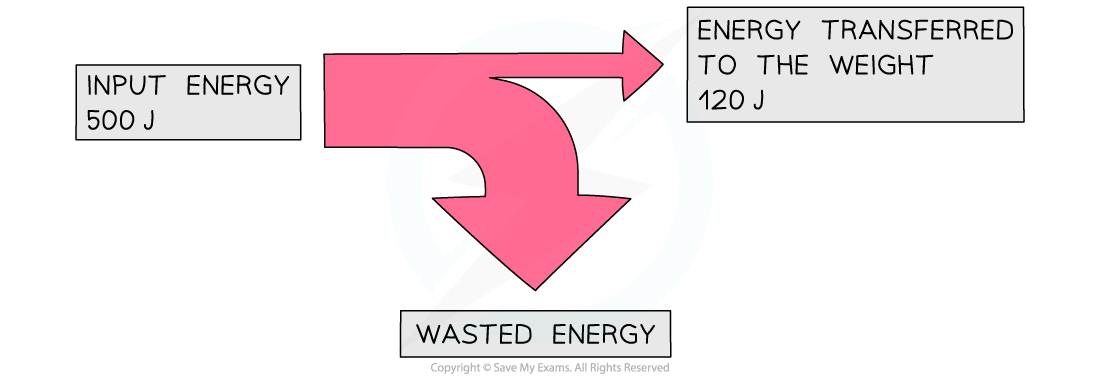
An electric motor is used to lift a weight. The Sankey diagram below represents the energy transfers in the system.

Calculate the amount of wasted energy.
Answer:
Step 1: State the conservation of energy
Energy cannot be created or destroyed, it can only be transferred from one store to another
This means that:
total energy in = useful energy out + wasted energy
Step 2: Rearrange the equation for the wasted energy
wasted energy = total energy in – useful energy out
Step 3: Substitute the values from the diagram
500 – 120 = 380 J
Examiner Tips and Tricks
How to draw a Sankey diagram
Drawing a good Sankey diagram takes practice.
Start by planning your diagram using graph paper or a ruler:
How many squares or mm wide will you make the input arrow?
How many squares or mm wide will the useful energy out arrow need to be?
How many squares or mm wide must the wasted arrow be?
Next, start drawing the diagram one step at a time:
Draw the left-hand side of the arrow, along with the line going across the top
Next add the useful energy out arrow, making sure it is the correct width
Now carefully mark the start and end of the wasted arrow – make sure your marks are the correct distance apart
Finally join the markings together, finishing the wasted energy arrow

You've read 0 of your 5 free revision notes this week
Sign up now. It’s free!
Did this page help you?

