Distance-Time Graphs (Edexcel IGCSE Physics (Modular)) : Revision Note

Distance-time graphs
A distance-time graph shows how the distance of an object moving in a straight line (from a starting position) varies over time:
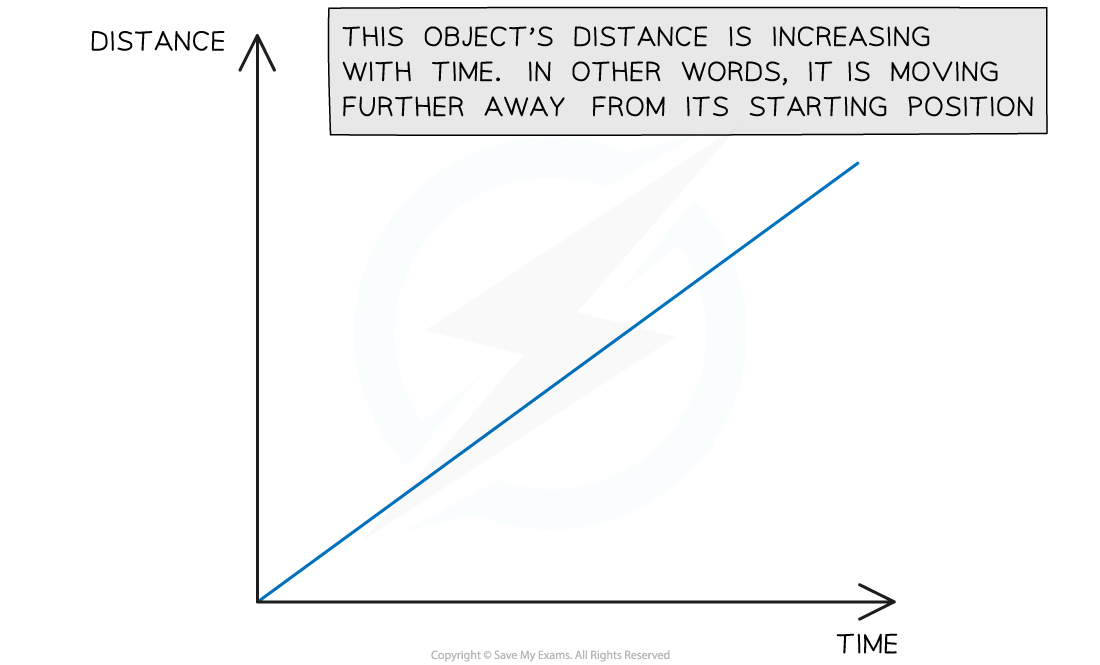
This graph shows a moving object moving further away from its origin
Constant speed on a distance-time graph
Distance-time graphs also show the following information:
Whether the object is moving at a constant speed
How large or small the speed is
A straight line represents constant speed
The slope of the straight line represents the magnitude of the speed:
A very steep slope means the object is moving at a large speed
A shallow slope means the object is moving at a small speed
A flat, horizontal line means the object is stationary (not moving)
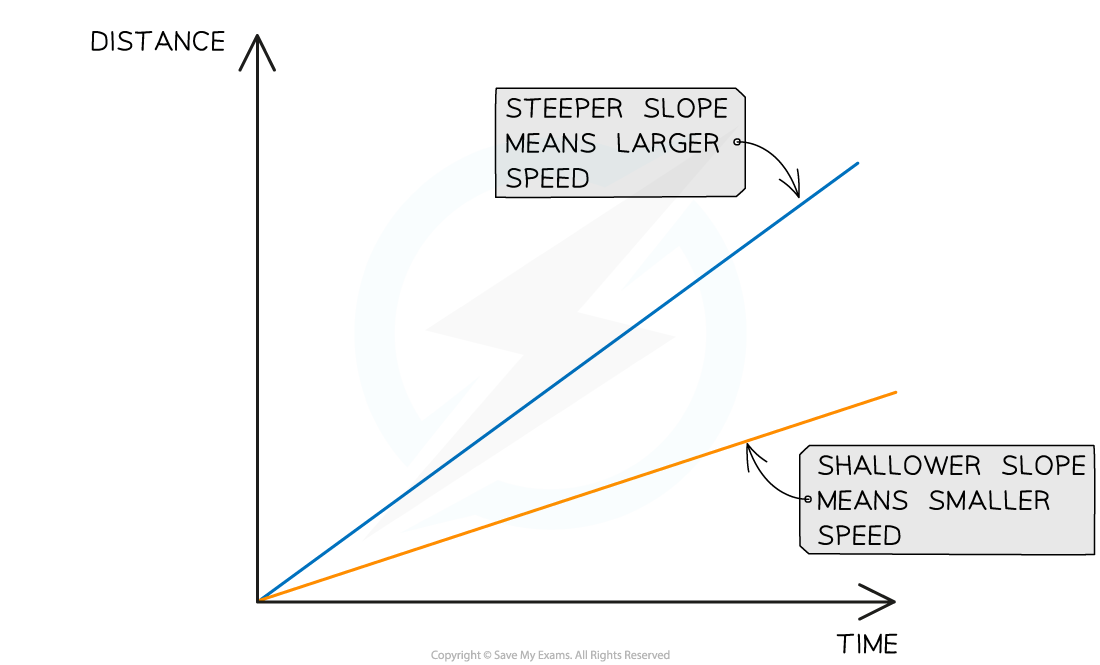
This graph shows how the slope of a line is used to interpret the speed of moving objects. Both of these objects are moving with a constant speed, because the lines are straight.
Examiner Tips and Tricks
The Edexcel IGCSE Physics specification states that you need to be able to explain distance-time graphs and to be able to plot them.
Plotting graphs is an important skill in physics and usually comes up in at least one exam paper. If you are not confident in plotting graphs, you should definitely practice before your exam!
Changing speed on a distance-time graph
Objects might be moving at a changing speed
This is represented by a curve
In this case, the slope of the line will be changing
If the slope is increasing, the speed is increasing (accelerating)
If the slope is decreasing, the speed is decreasing (decelerating)
The image below shows two different objects moving with changing speeds
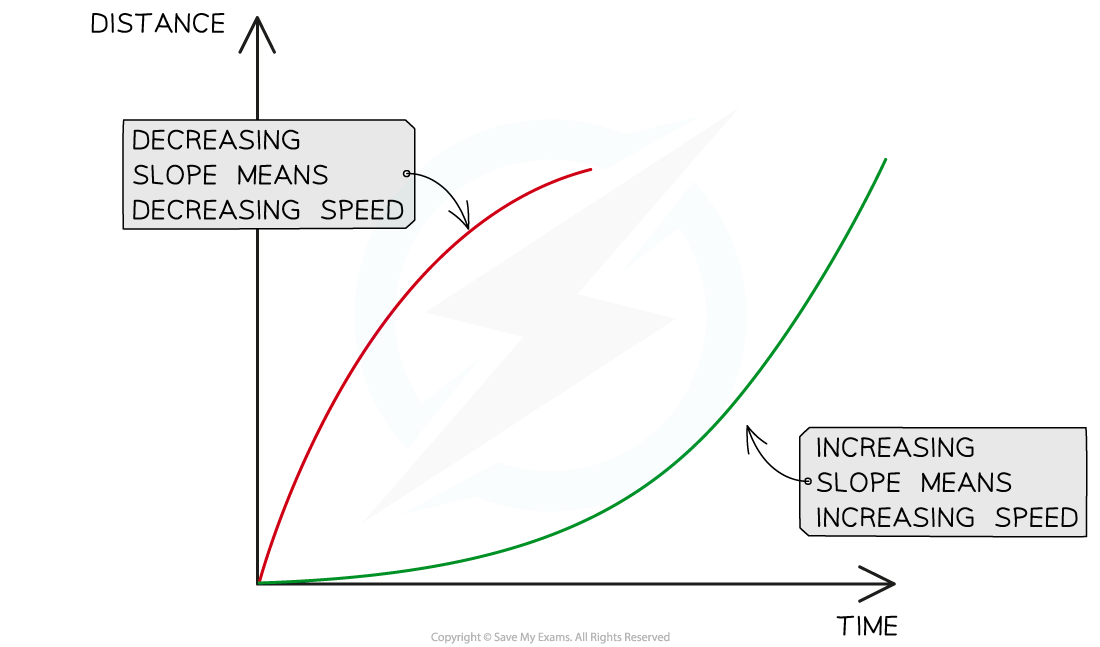
Changing speeds are represented by changing slopes. The red line represents an object slowing down and the green line represents an object speeding up.
Calculating speed from a distance-time graph
The speed of a moving object can be calculated from the gradient of the line on a distance-time graph:
![]()
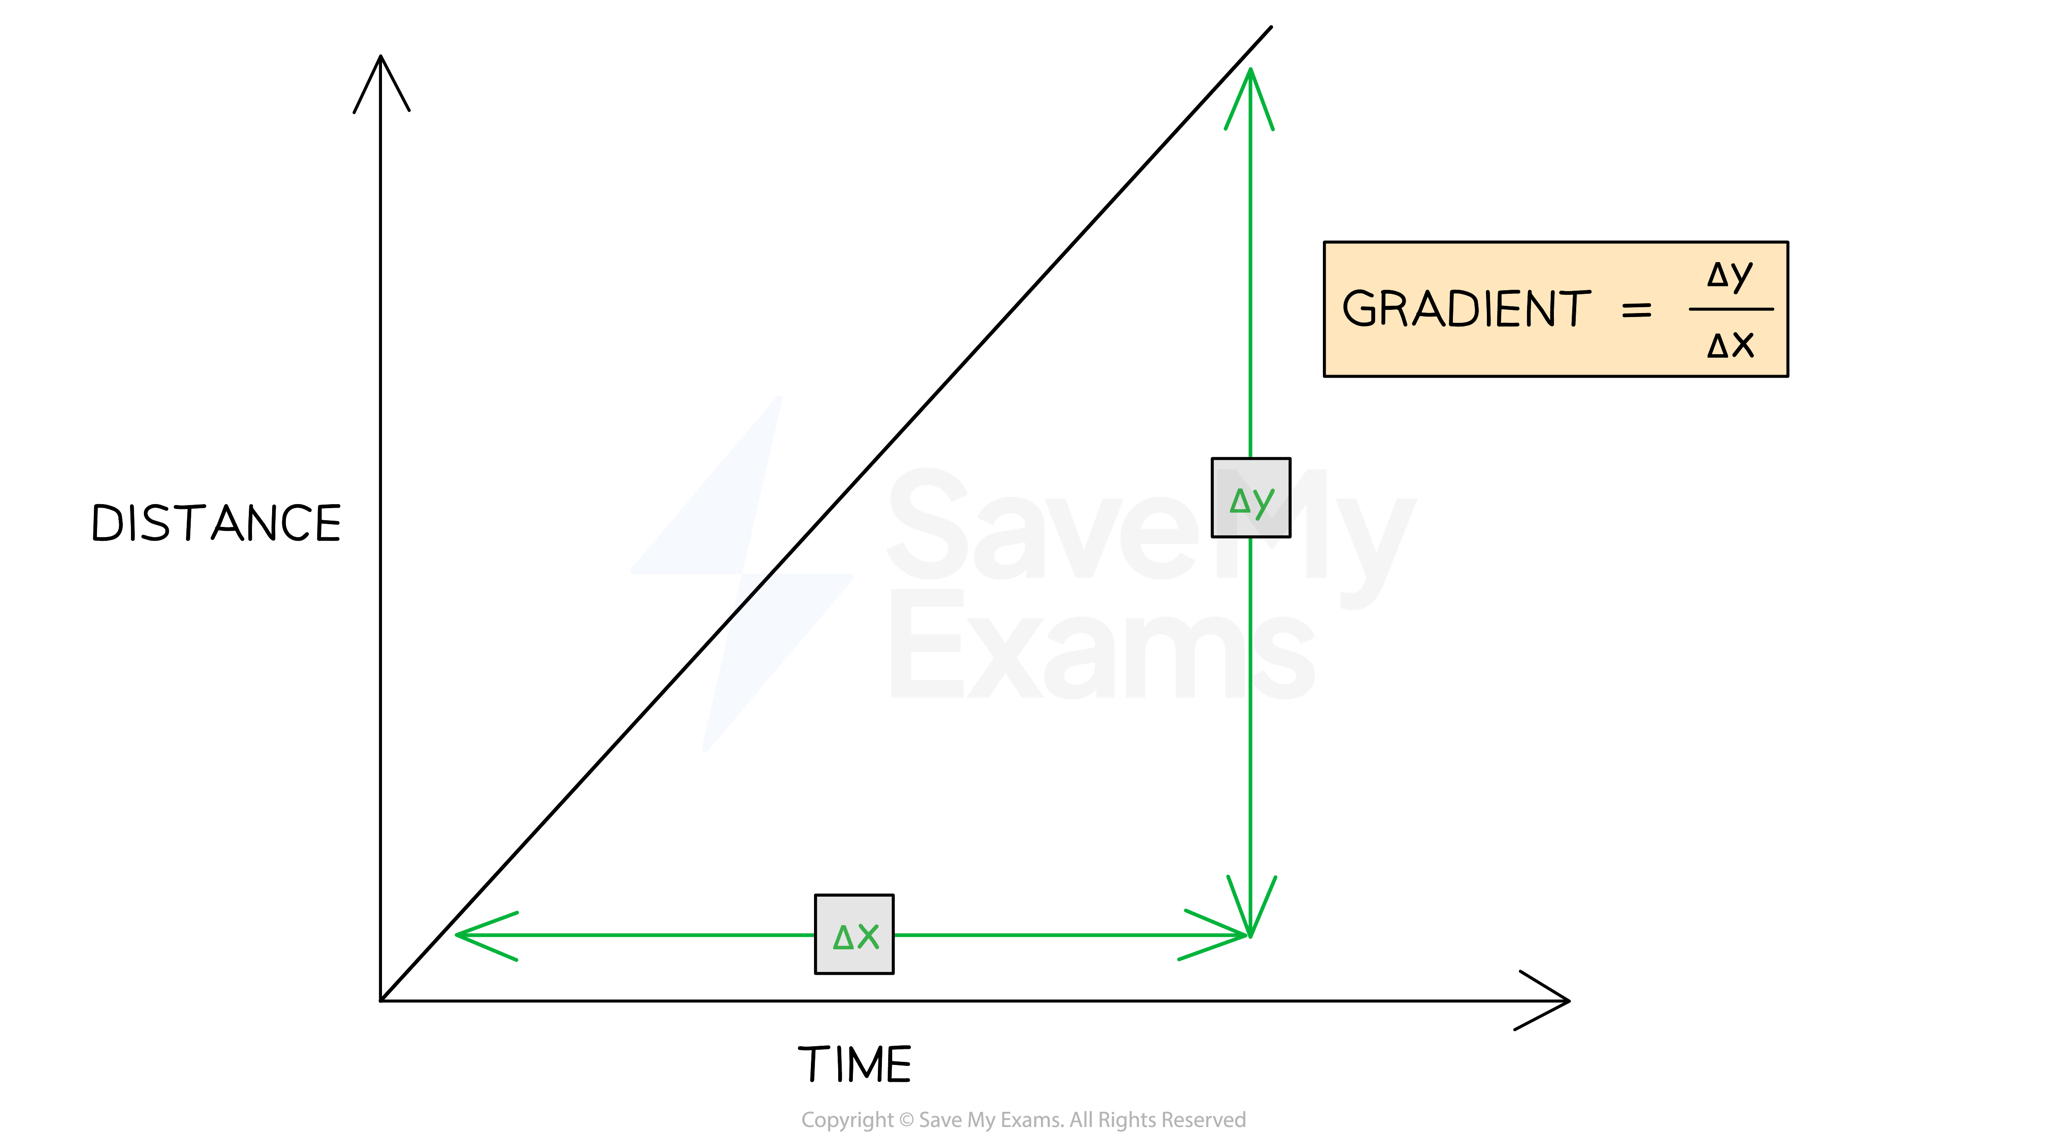
The speed of an object can be found by calculating the gradient of a distance-time graph
format('truetype')%3Bfont-weight%3Anormal%3Bfont-style%3Anormal%3B%7Dtext%7Bfill%3A%23000000%3B%3C%2Fstyle%3E%3C%2Fdefs%3E%3Ctext%20font-family%3D%22math1ed582716bfb4738ccd92405301%22%20font-size%3D%2216%22%20text-anchor%3D%22middle%22%20x%3D%227.5%22%20y%3D%2216%22%3E%26%23x2206%3B%3C%2Ftext%3E%3Ctext%20font-family%3D%22Times%20New%20Roman%22%20font-size%3D%2218%22%20font-style%3D%22italic%22%20text-anchor%3D%22middle%22%20x%3D%2219.5%22%20y%3D%2216%22%3Ey%3C%2Ftext%3E%3C%2Fsvg%3E) is the change in y (distance) values
is the change in y (distance) valuesformat('truetype')%3Bfont-weight%3Anormal%3Bfont-style%3Anormal%3B%7Dtext%7Bfill%3A%23000000%3B%3C%2Fstyle%3E%3C%2Fdefs%3E%3Ctext%20font-family%3D%22math1ed582716bfb4738ccd92405301%22%20font-size%3D%2216%22%20text-anchor%3D%22middle%22%20x%3D%227.5%22%20y%3D%2216%22%3E%26%23x2206%3B%3C%2Ftext%3E%3Ctext%20font-family%3D%22Times%20New%20Roman%22%20font-size%3D%2218%22%20font-style%3D%22italic%22%20text-anchor%3D%22middle%22%20x%3D%2219.5%22%20y%3D%2216%22%3Ex%3C%2Ftext%3E%3C%2Fsvg%3E) is the change in x (time) values
is the change in x (time) values
Worked Example
A distance-time graph is drawn below for part of a train journey. The train is travelling at a constant speed.
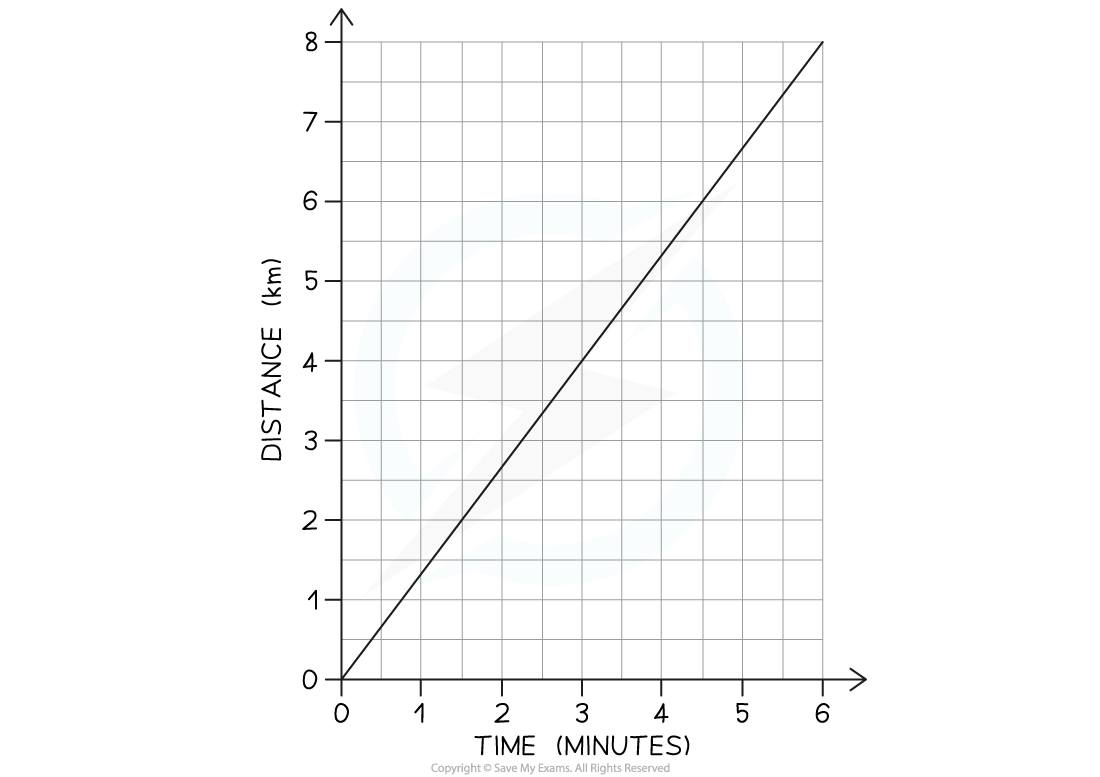
Calculate the speed of the train.
Answer:
Step 1: Draw a large gradient triangle on the graph
The image below shows a large gradient triangle drawn with dashed lines
- and are labelled, using the units as stated on each axes
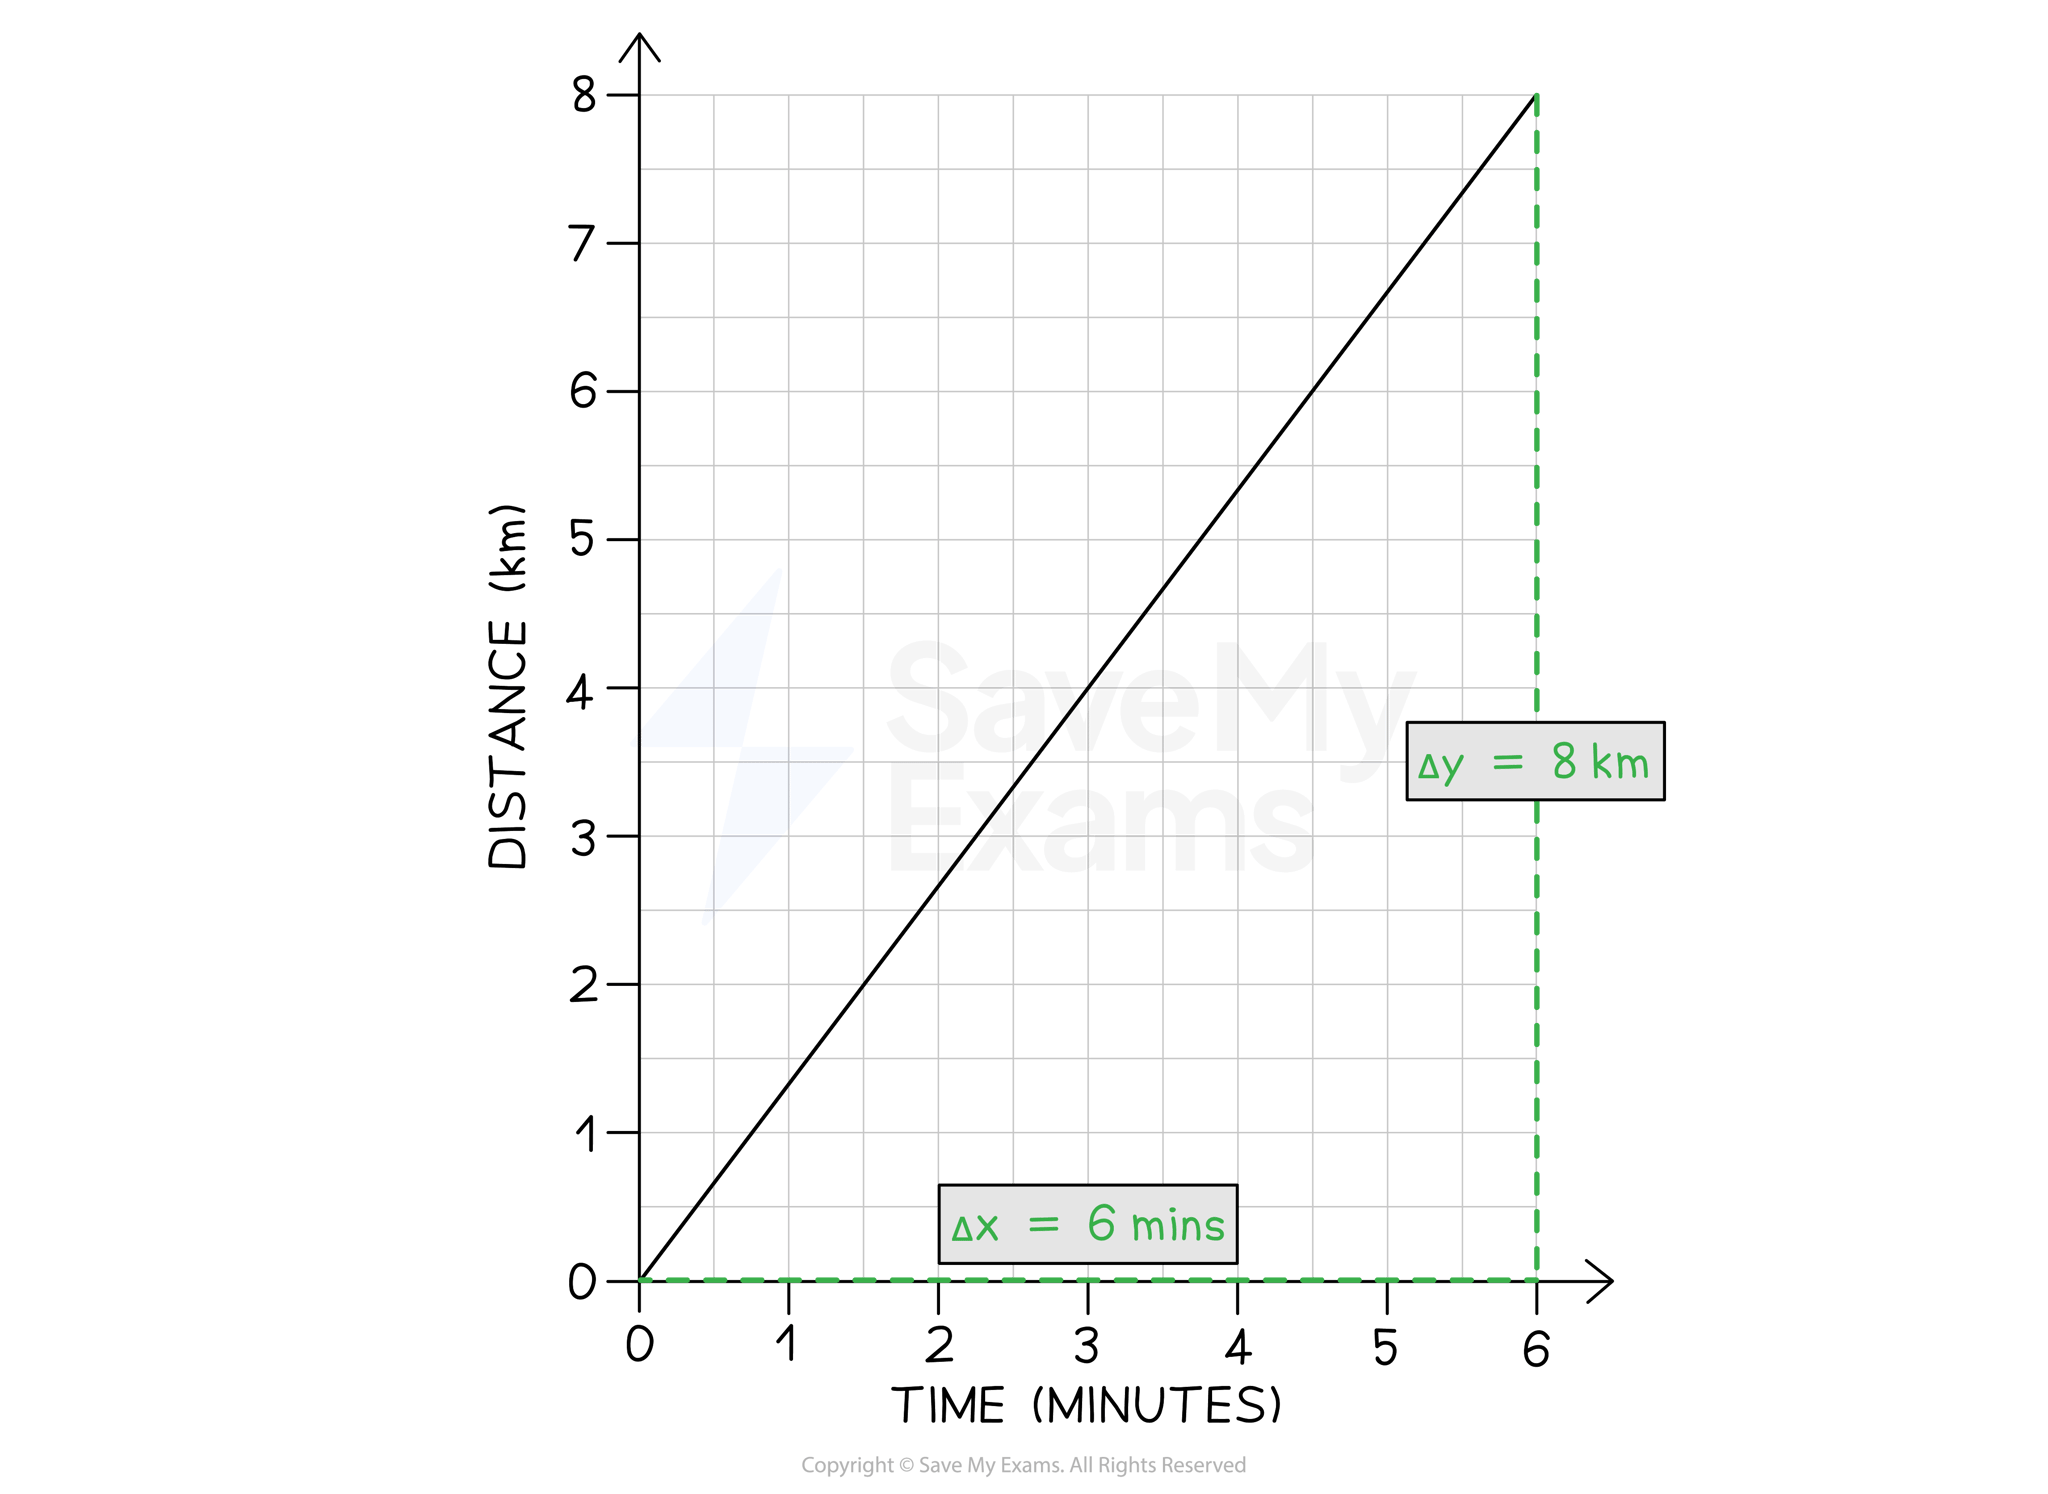
Step 2: Convert units for distance and time into standard units
The distance travelled = 8 km = 8000 m
The time taken = 6 mins = 360 s
Step 3: State that speed is equal to the gradient of a distance-time graph
The gradient of a distance-time graph is equal to the speed of a moving object:
![]()
Step 4: Substitute values in to calculate the speed
![]()
![]()
Worked Example
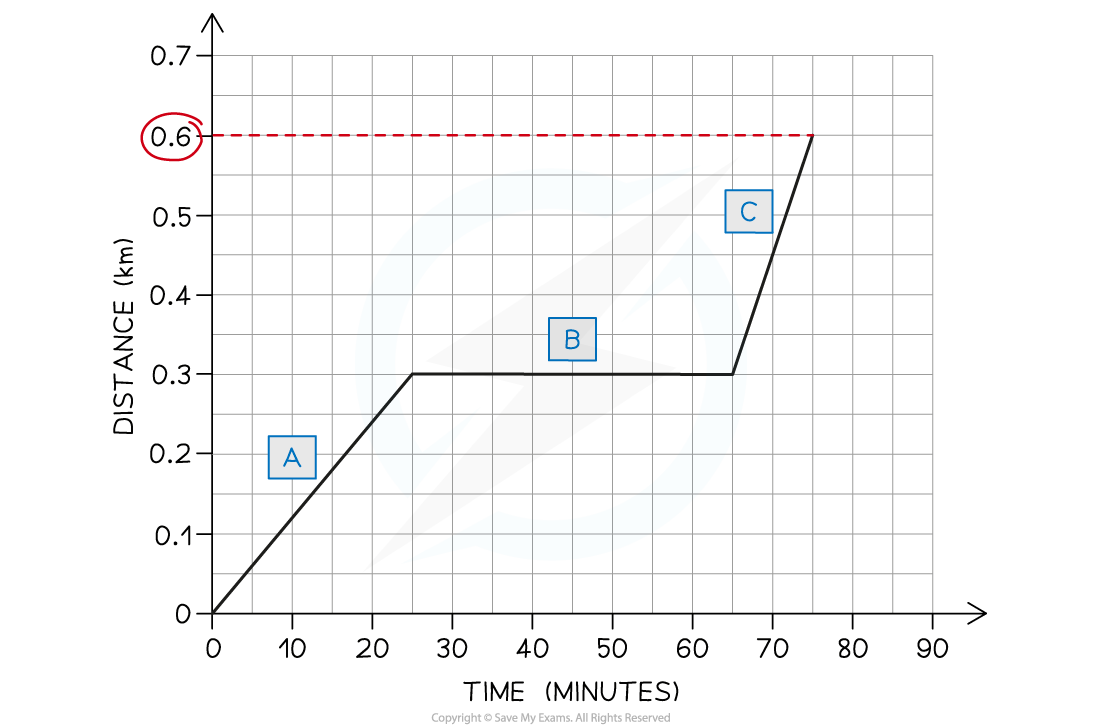
A student decides to take a stroll to the park. They find a bench in a quiet spot and take a seat, picking up where they left off reading a book on Black Holes. After some time reading, the student realises they lost track of time and runs home.
A distance-time graph for for the student's trip is drawn below:
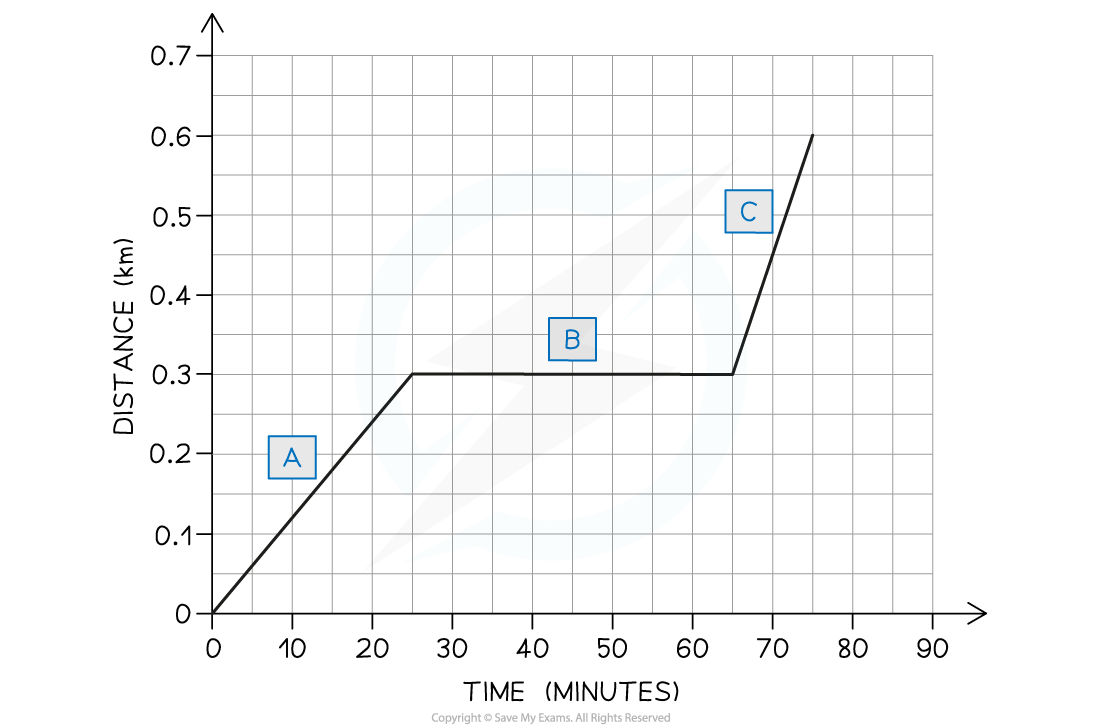
a) How long does the student spend reading the book?
b) Which section of the graph represents the student running home?
c) What is the total distance travelled by the student?
Answer:
Part (a)
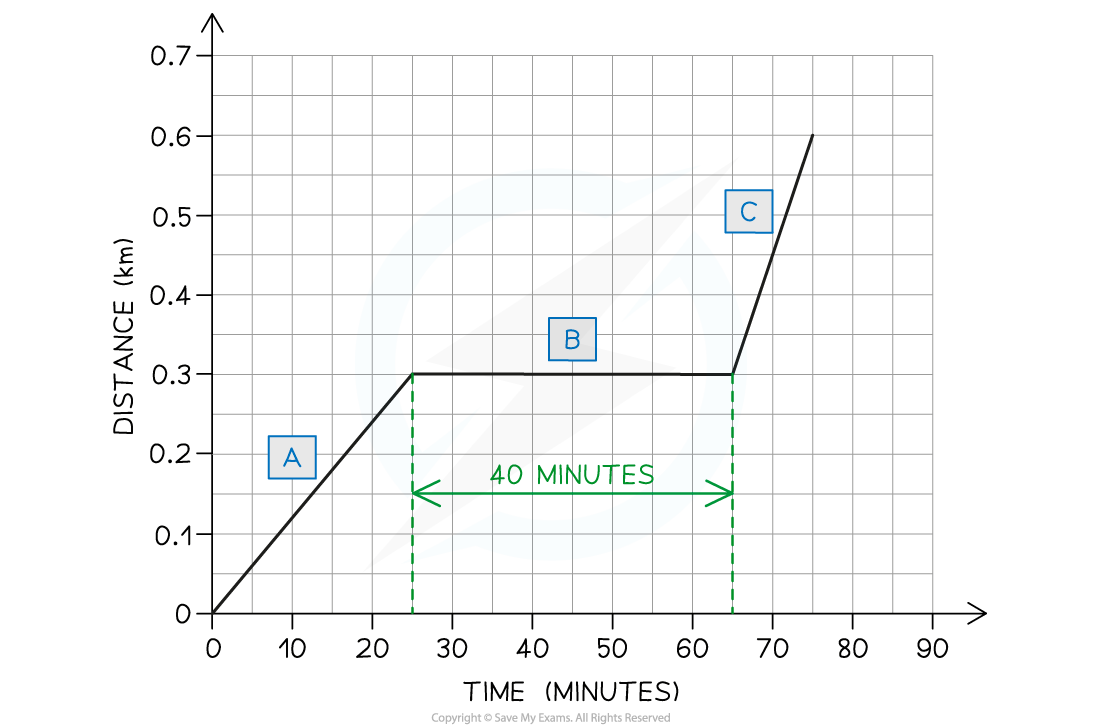
The student spends 40 minutes reading the book
The flat section of the line (section B) represents an object which is stationary - so section B represents the student sitting on the bench reading
This section lasts for 40 minutes - as shown in the graph below
Part (b)
Section C represents the student running home
The slope of the line in section C is steeper than the slope in section A
This means the student was moving with a larger speed (running) in section C
Part (c)
The total distance travelled by the student is 0.6 km
The total distance travelled by an object is given by the final point on the line - in this case, the line ends at 0.6 km on the distance axis. This is shown in the image below:
Examiner Tips and Tricks
Use the entire line, where possible, to calculate the gradient. Examiners tend to award credit if they see a large gradient triangle used - so remember to draw these directly on the graph itself!
Remember to check the units of variables measured on each axis. These may not always be in standard units - in our example, the unit of distance was km and the unit of time was minutes. Double-check which units to use in your answer.

You've read 0 of your 5 free revision notes this week
Unlock more, it's free!
Did this page help you?
