Half-Life (Cambridge (CIE) IGCSE Physics): Revision Note
Exam code: 0625 & 0972
Did this video help you?
Half-life basics
The half-life of a particular isotope is defined as:
The time taken for half the nuclei of that isotope in any sample to decay
The rate at which the activity of a sample decreases is measured in terms of half-life
This is the time it takes for the activity of a sample to fall to half its original level
This is the time it takes for the activity of the sample to decrease from 100 % to 50 %
It is the same length of time as it would take to decrease from 50 % activity to 25 % activity
Different isotopes have different half-lives and half-lives can vary from a fraction of a second to billions of years in length
The half-life is constant for a particular isotope
Representing half life
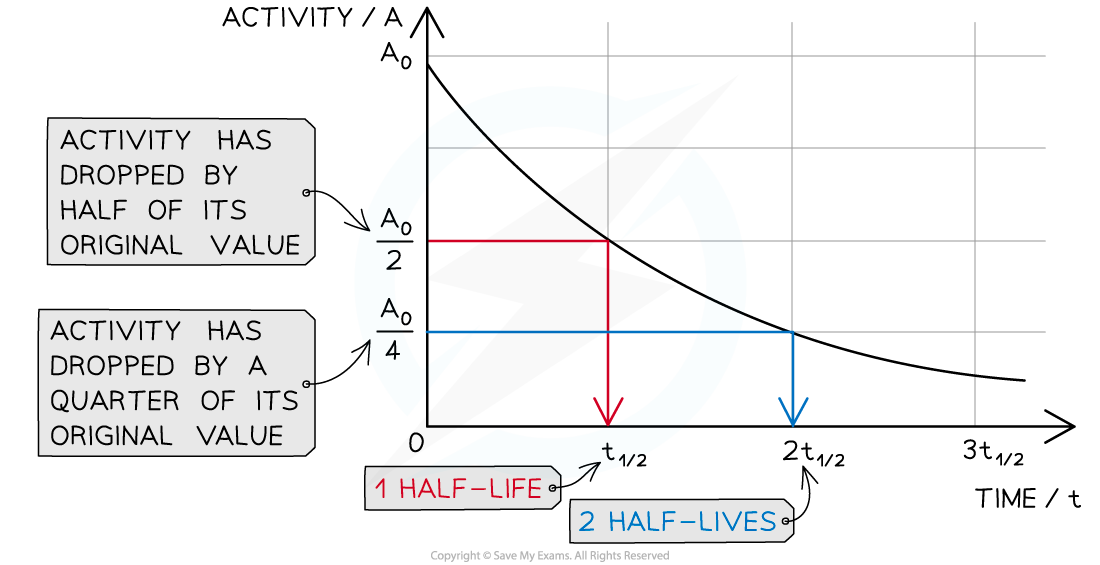
Half-life can be determined from an activity–time graph
A half-life graph

The graph shows how the activity of a radioactive sample changes over time. Each time the original activity halves, another half-life has passed
Half-life can also be represented on a table
As the number of the half-life increases, the proportion of the isotope remaining halves
Table showing the number of half-lives to the proportion of isotope remaining
Number of half-lives | Proportion of isotope remaining |
|---|---|
0 | 1 |
1 | |
2 | |
3 | |
4 | |
... | ... |
Worked Example
An isotope of protactinium-234 has a half-life of 1.17 minutes.
Calculate the amount of time it takes for a sample to decay from a mass of 10 mg to 2.5 mg.
Answer:
Step 1: Calculate the fraction of the sample remaining
Initial mass of sample = 10 mg
Final mass of sample = 2.5 mg
The fraction of the sample remaining is
Step 2: Calculate the number of half-lives that have passed
Using the table above we can see that two half-lives have passed
Step 3: Calculate the time for the sample to decay
Two half lives have passed
So the time for the sample to decay is twice the half-life
The time for the sample to decay to a mass of 2.5 mg is 2.34 minutes
Did this video help you?
Half-life graphs
Extended tier only
The half-life of an isotope should be calculated by removing the background radiation from data or decay curves
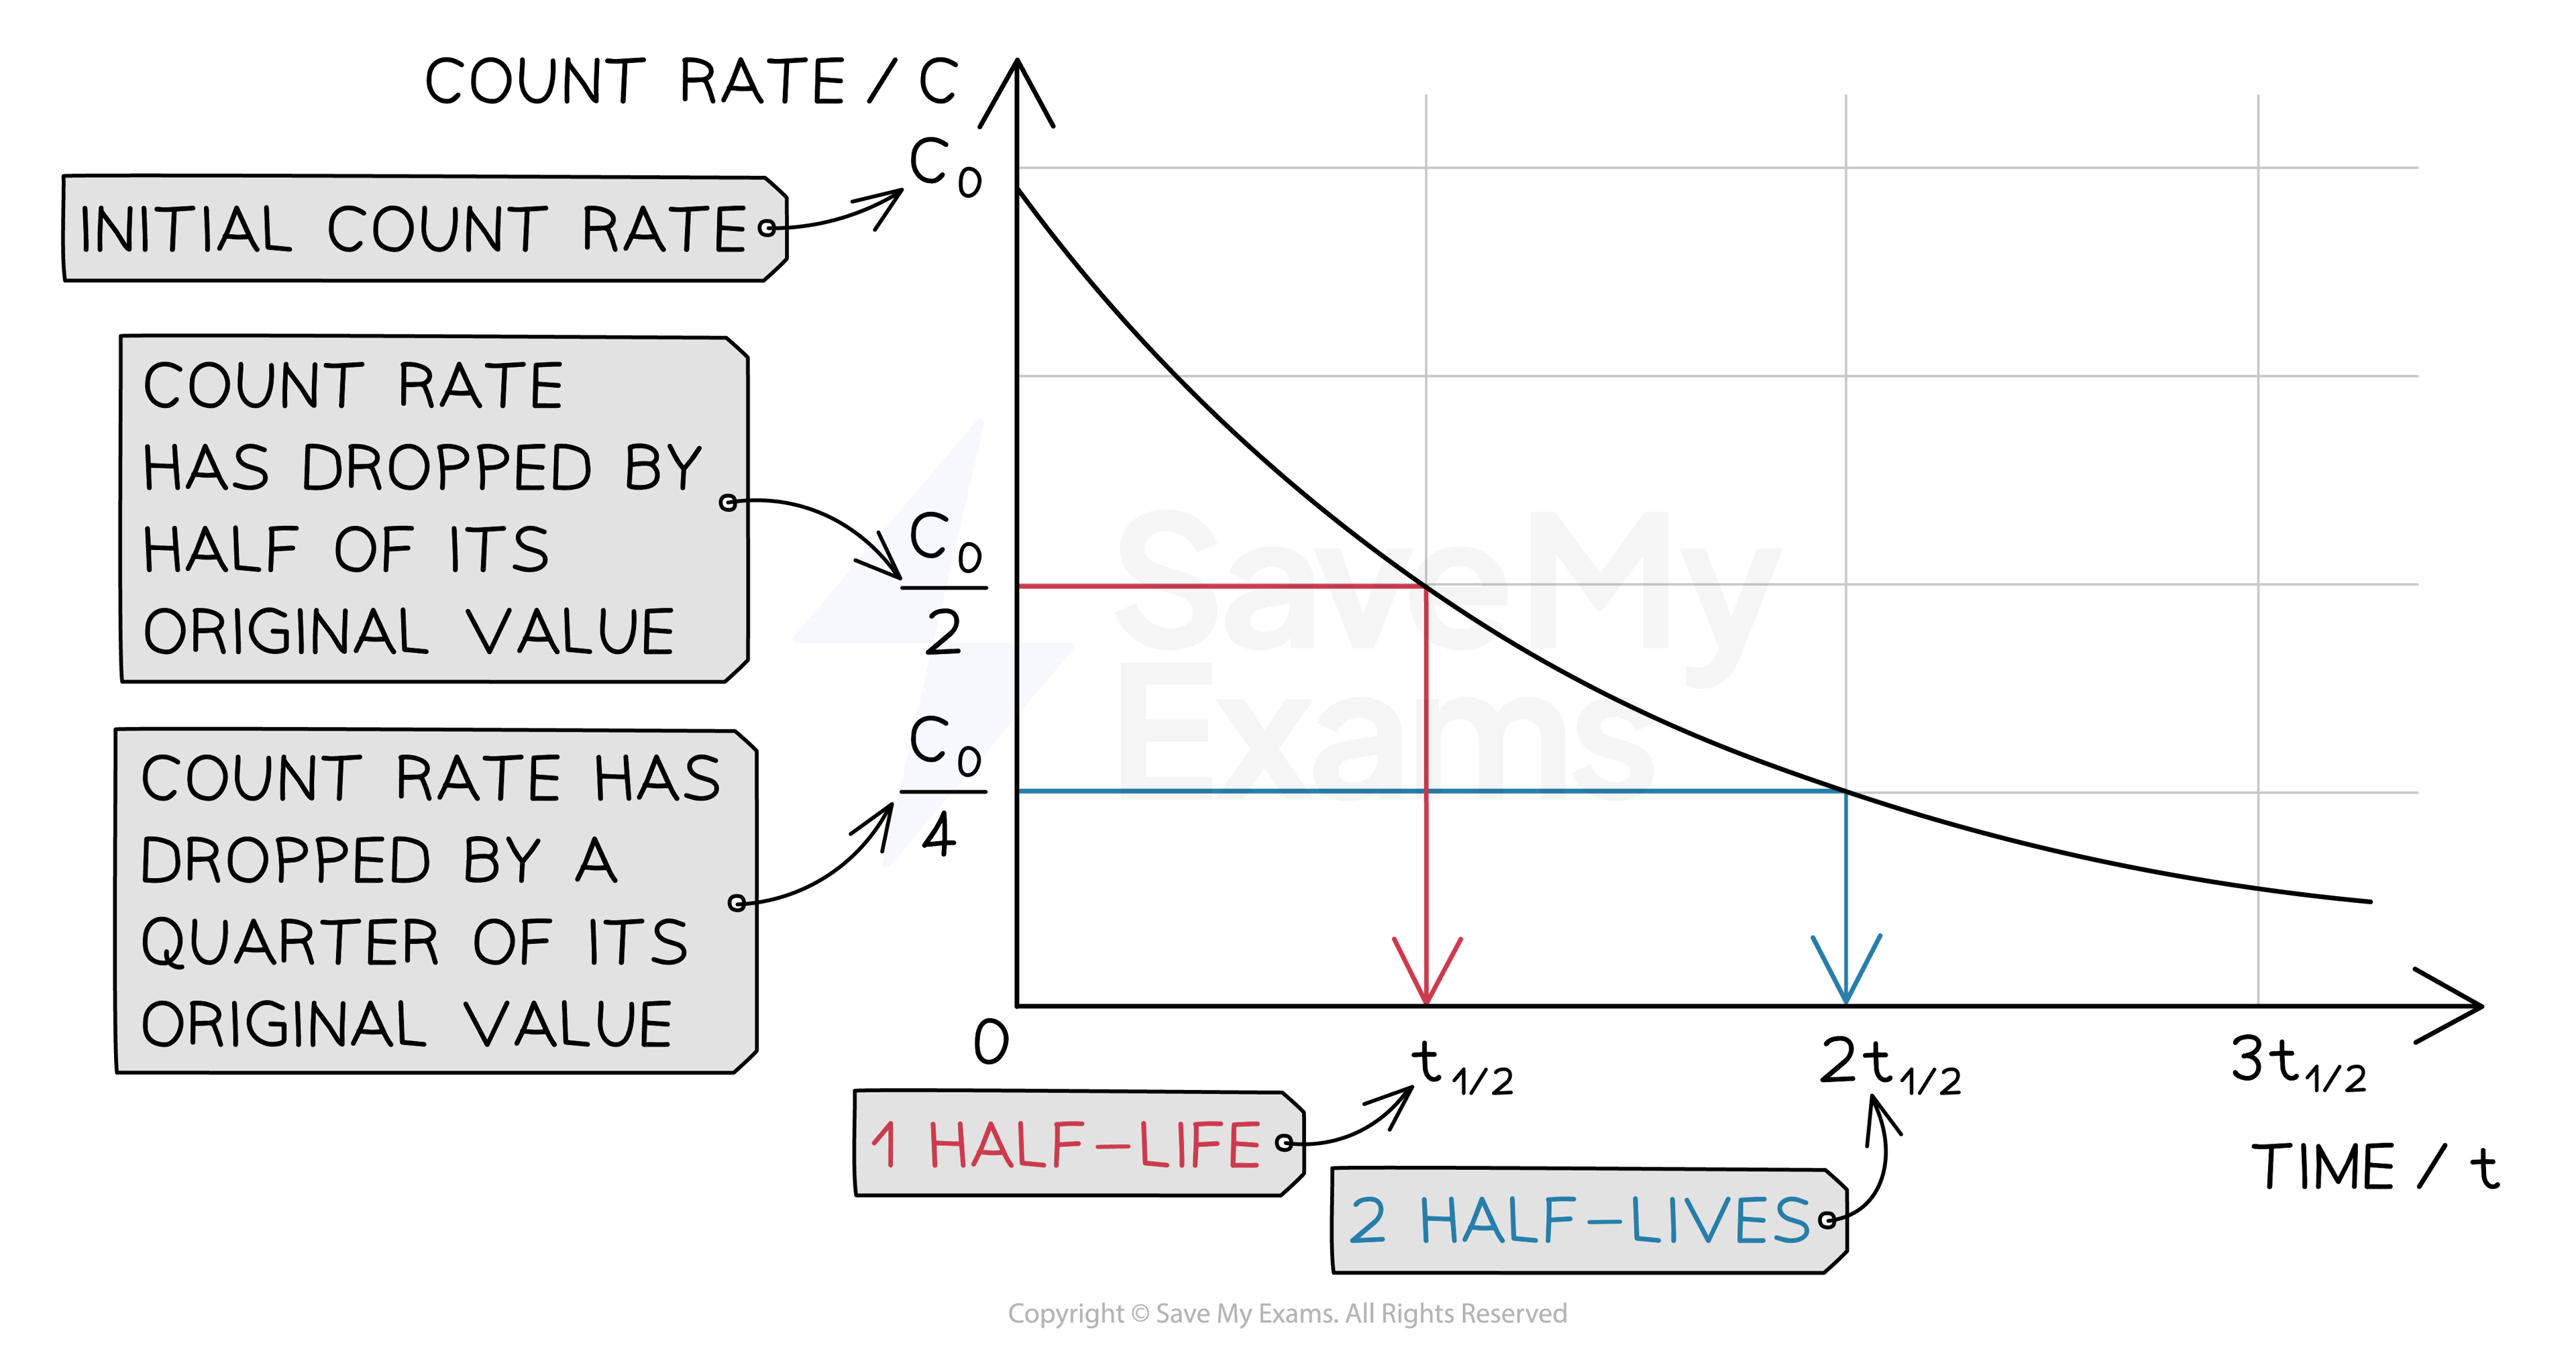
To calculate the half-life of a sample from a graph:
Check the original activity or count rate (where the line crosses the y-axis),C0
Halve this value and look for this activity
Go across from the halved value (on the y-axis) to the best-fit curve, and then straight down to the x-axis
The point where you reach the x-axis should be the half-life
Obtaining half-life from a half-life graph

To find the time for the half-life find half of the activity first
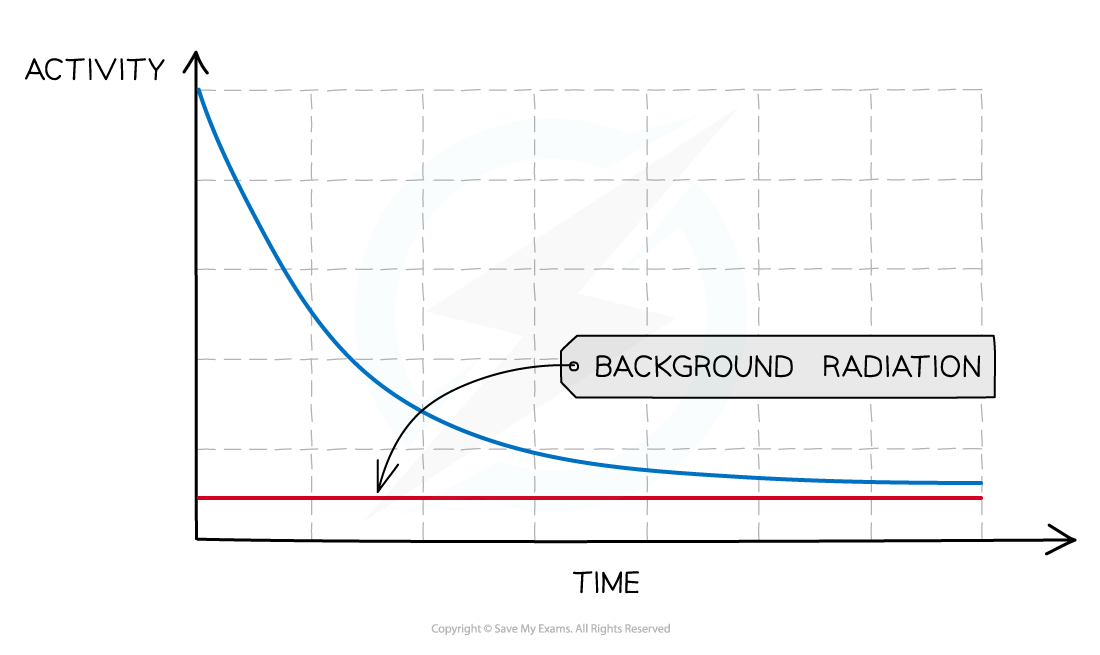
To remove background radiation from the decay curve:
Start by measuring the background radiation (with no sources present) – this is called the background count
Then carry out the experiment
Subtract the background count from each reading, to provide a corrected count
The corrected count is your best estimate of the radiation emitted from the source and should be used to measure its half-life
A half-life graph that removes background radiation

When measuring radioactive emissions, some of the detected radiation will be background
Worked Example
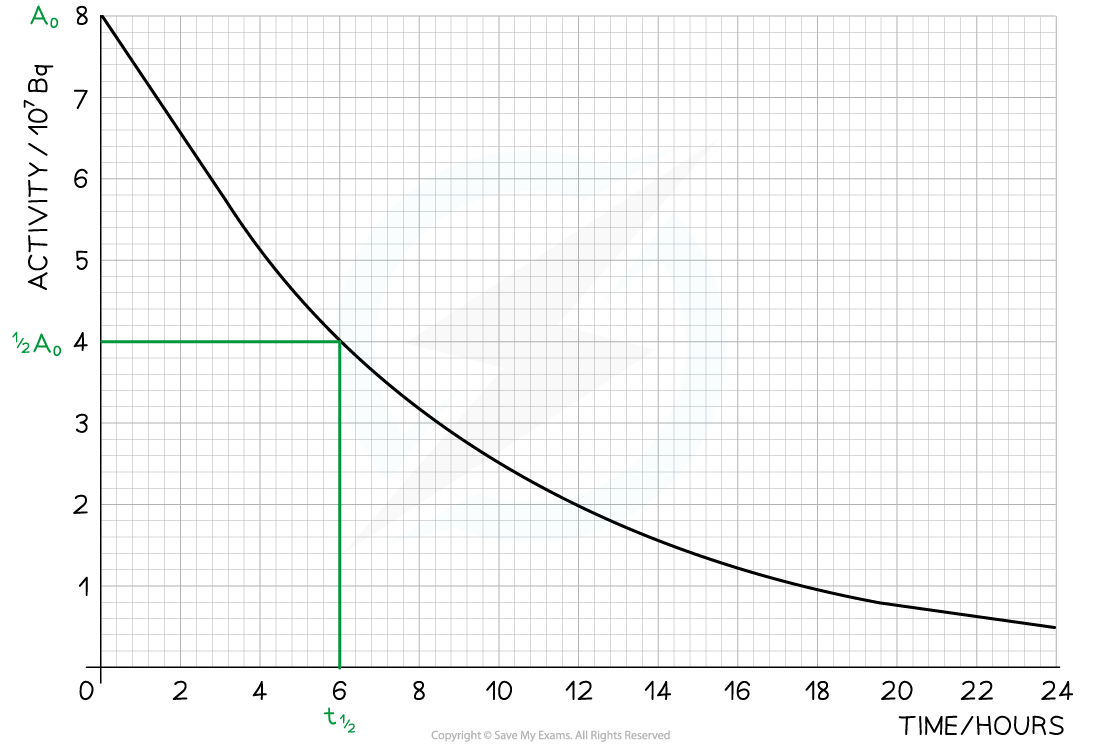
The radioisotope technetium is used extensively in medicine. The graph below shows how the activity of a sample varies with time.

Determine the half-life of this material.
Answer:
Step 1: Draw lines on the graph to determine the time it takes for technetium to drop to half of its original activity

Worked Example
A particular radioactive sample contains 2 million un-decayed atoms. After a year, there are only 500 000 atoms left un-decayed. What is the half-life of this material?
Answer:
Step 1: Calculate how many times the number of un-decayed atoms has halved
There were 2 000 000 atoms to start with
1 000 000 atoms would remain after 1 half-life
500 000 atoms would remain after 2 half-lives
Therefore, the sample has undergone 2 half-lives
Step 2: Divide the time period by the number of half-lives
The time period is a year
The number of half-lives is 2
So two half-lives is 1 year, and one half-life is 6 months
Therefore, the half-life of the sample is 6 months
Examiner Tips and Tricks
When looking for the corresponding time for the activity, it is good practice to draw a line on the graph with your ruler, as in the mark scheme of the worked example. This ensures you're reading the most accurate value possible.

You've read 0 of your 5 free revision notes this week
Unlock more, it's free!
Did this page help you?