Calculating Acceleration from Speed-Time Graphs (Cambridge (CIE) IGCSE Physics): Revision Note
Exam code: 0625 & 0972

Interpreting speed-time graphs
Extended tier only
When interpreting speed-time graphs, the shape of the graph can show:
constant acceleration
changing acceleration
The gradient of a speed-time graph shows the acceleration of a moving object
The gradient is positive if the object is accelerating (speed increases with time)
The gradient is negative if the object is decelerating (speed decreases with time)
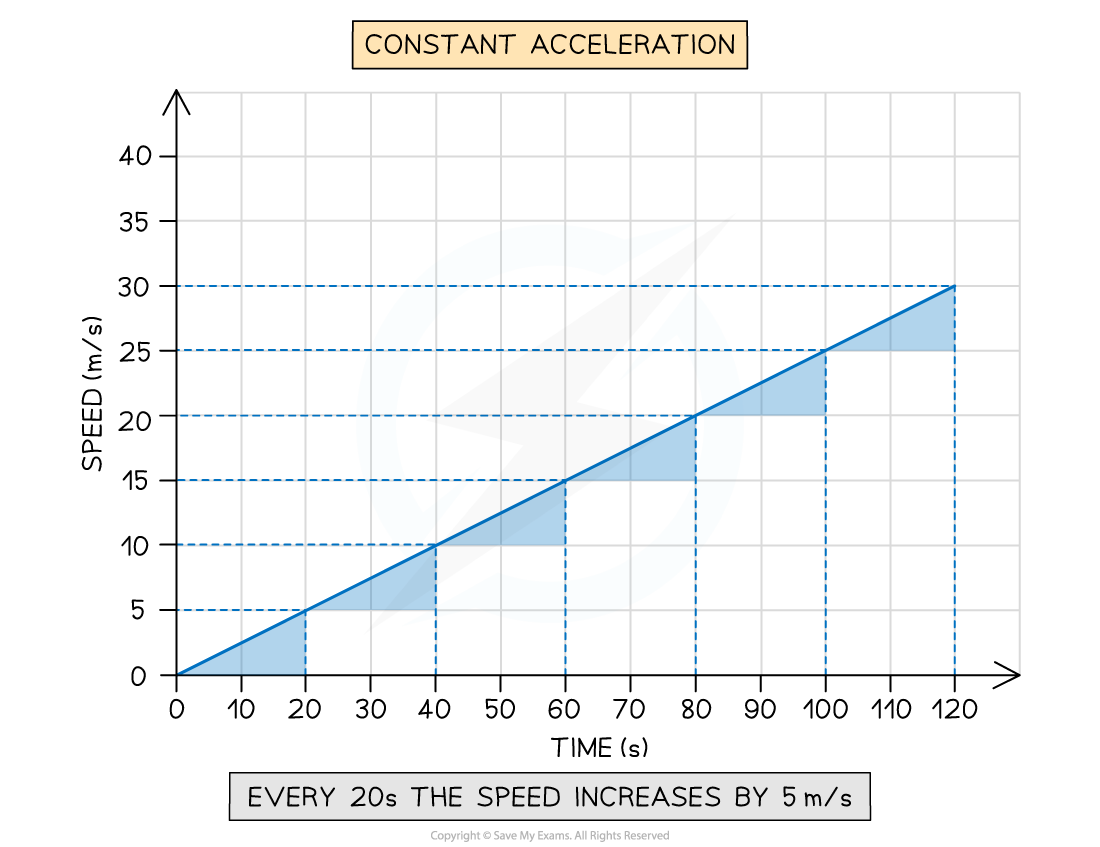
Interpreting constant positive acceleration on a speed-time graph
When the acceleration is constant and non-zero:
the graph is a straight line
velocity is increasing at a constant rate, i.e. speed changes by the same amount in equal intervals of time
Constant positive acceleration on a speed-time graph
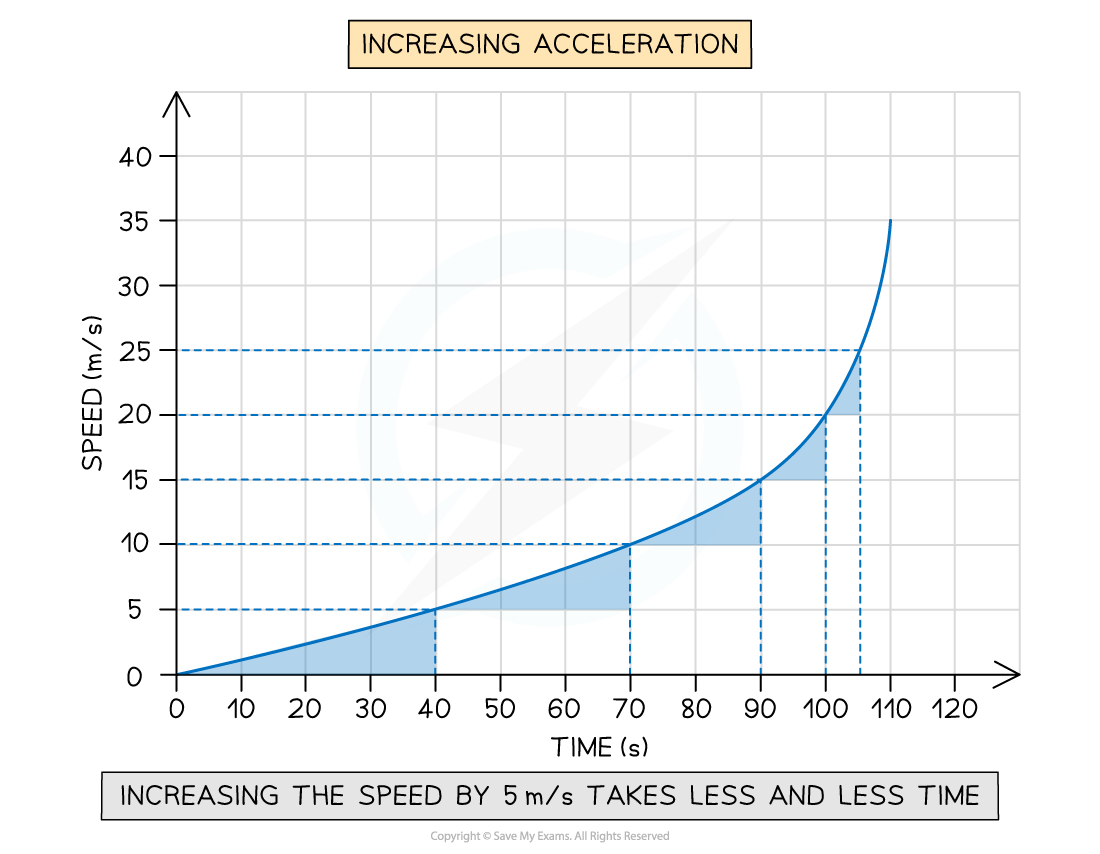
Interpreting increasing positive acceleration on a speed-time graph
When the acceleration is increasing:
the graph is a curve
velocity is increasing at an increasing rate, i.e. the speed changes by the same amount in increasingly shorter time intervals
Increasing positive acceleration on a speed-time graph
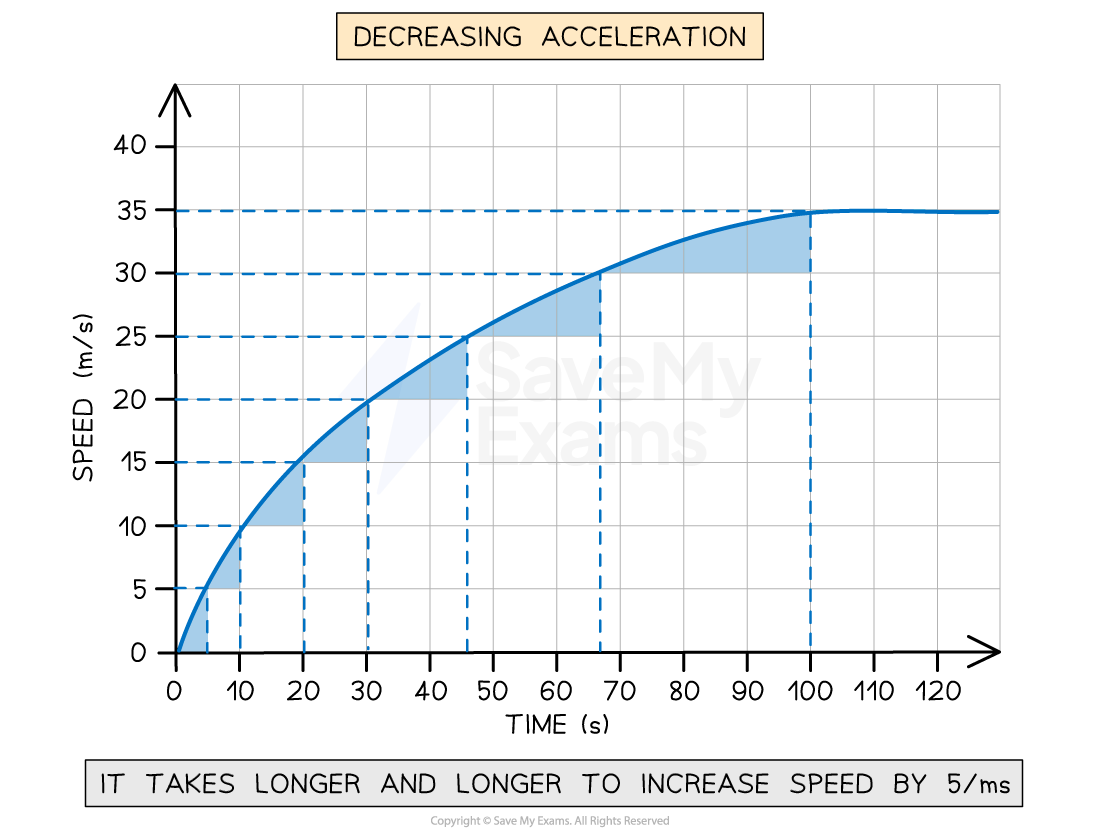
Interpreting decreasing positive acceleration on a speed-time graph
When the acceleration is decreasing:
the graph is a curve
velocity is increasing at a decreasing rate, i.e. the speed changes by the same amount in increasingly longer time intervals
Decreasing positive acceleration on a speed-time graph
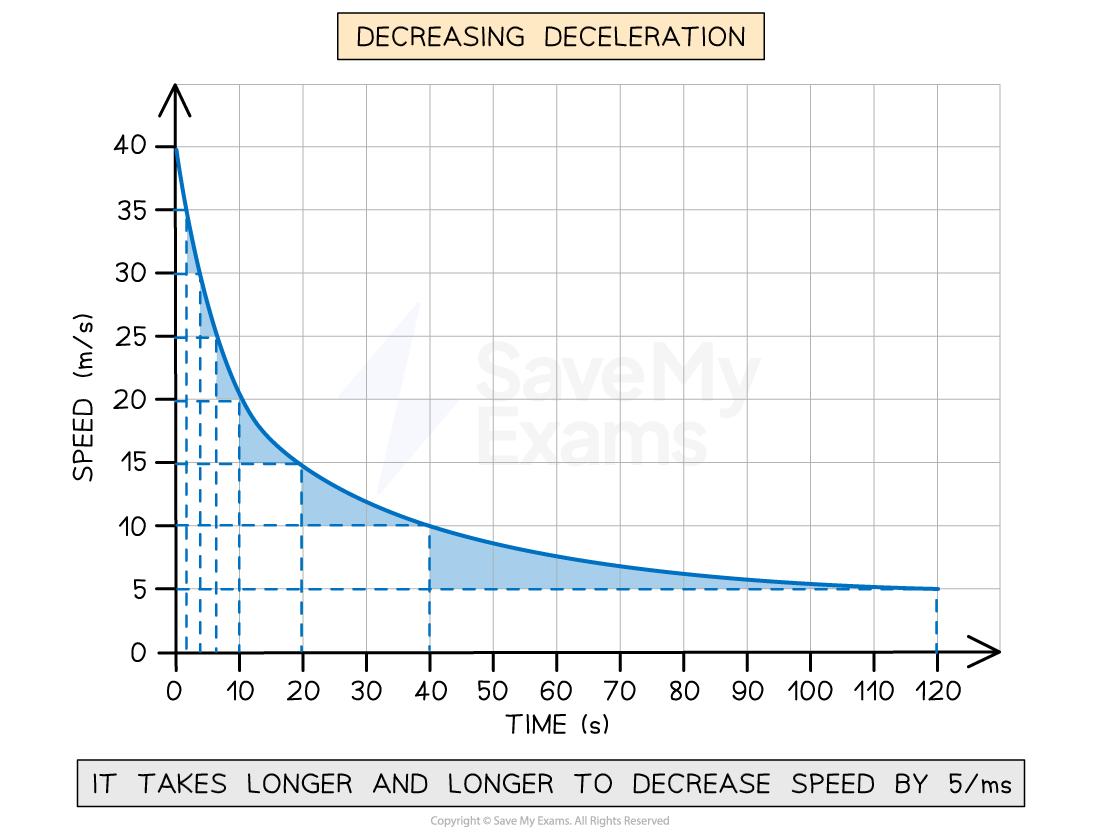
Interpreting decreasing negative acceleration on a speed-time graph
When the deceleration is decreasing:
the graph is a curve
the velocity is decreasing at a decreasing rate, i.e. the speed changes by the same amount in increasingly longer intervals of time
Decreasing negative acceleration on a speed-time graph
Examiner Tips and Tricks
In CIE IGCSE Physics, interpreting graphs is a required skill
For your exam, you are also expected to calculate the gradient of a graph and the area under a graph
Finding the area under a graph is covered in the revision note Speed-time graphs
Calculating acceleration
Extended Tier Only
The acceleration of an object (opens in a new tab) can be calculated from the gradient of a speed-time graph
Finding the gradient when acceleration is constant
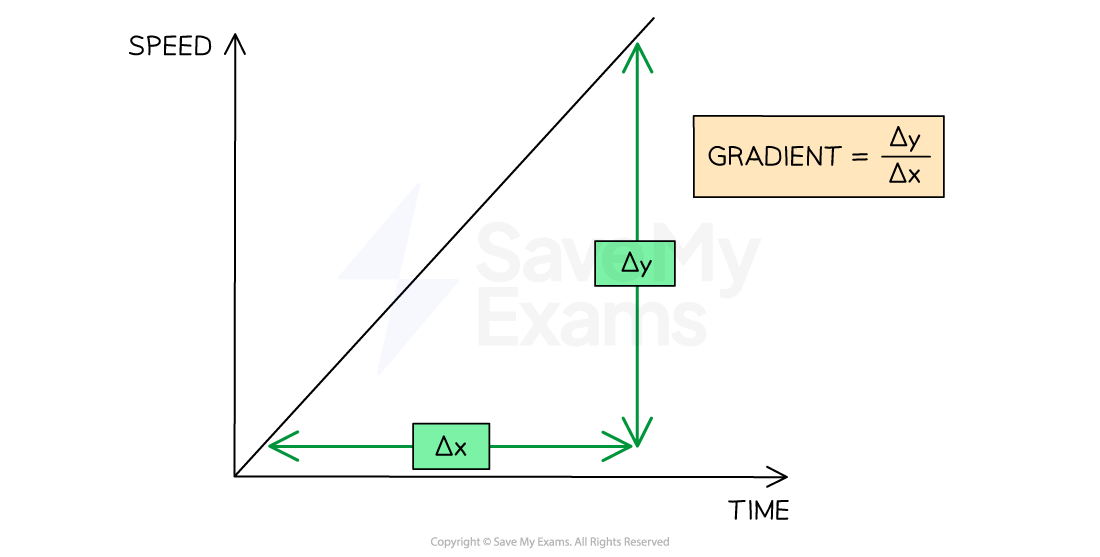
When acceleration is constant, the speed-time graph will be a straight line
The gradient of a straight line can be found using:
Where:
= change in (speed) values
= change in (time) values
Therefore, the gradient is equal to:
Where:
= acceleration, measured in metres per second squared (m/s2)
= change in speed, measured in metres per second (m/s)
= change in time, measured in seconds (s)
Finding the gradient when acceleration is changing
When acceleration is changing, the speed-time graph will be a curve
The gradient of a point on a curve can be found by drawing a tangent to the curve
A tangent to the curve is a straight line drawn to match the gradient of the curve at a specific point
A tangent to the curve
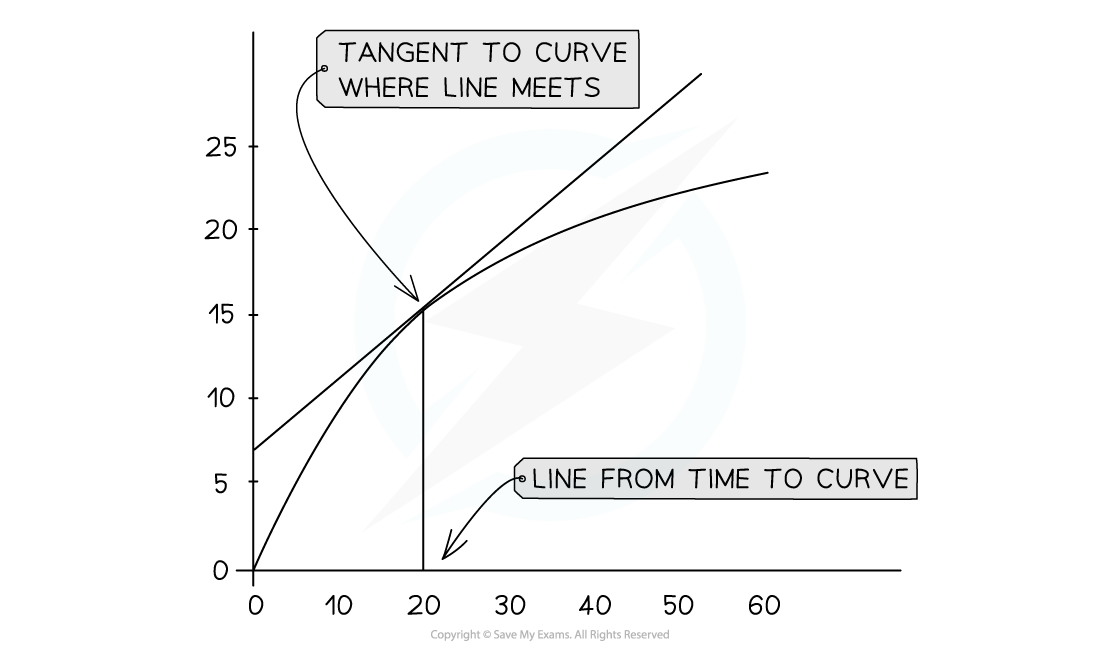
The tangent provides a gradient that is representative of the gradient at a specific point on the curve
The gradient of the tangent can be found using:
The value of the gradient at a specific point on the curve represents the acceleration of the object at that moment
This is called instantaneous acceleration
Worked Example
A cyclist is training for a cycling tournament.
The speed-time graph below shows the cyclist's motion as they cycle along a flat, straight road.
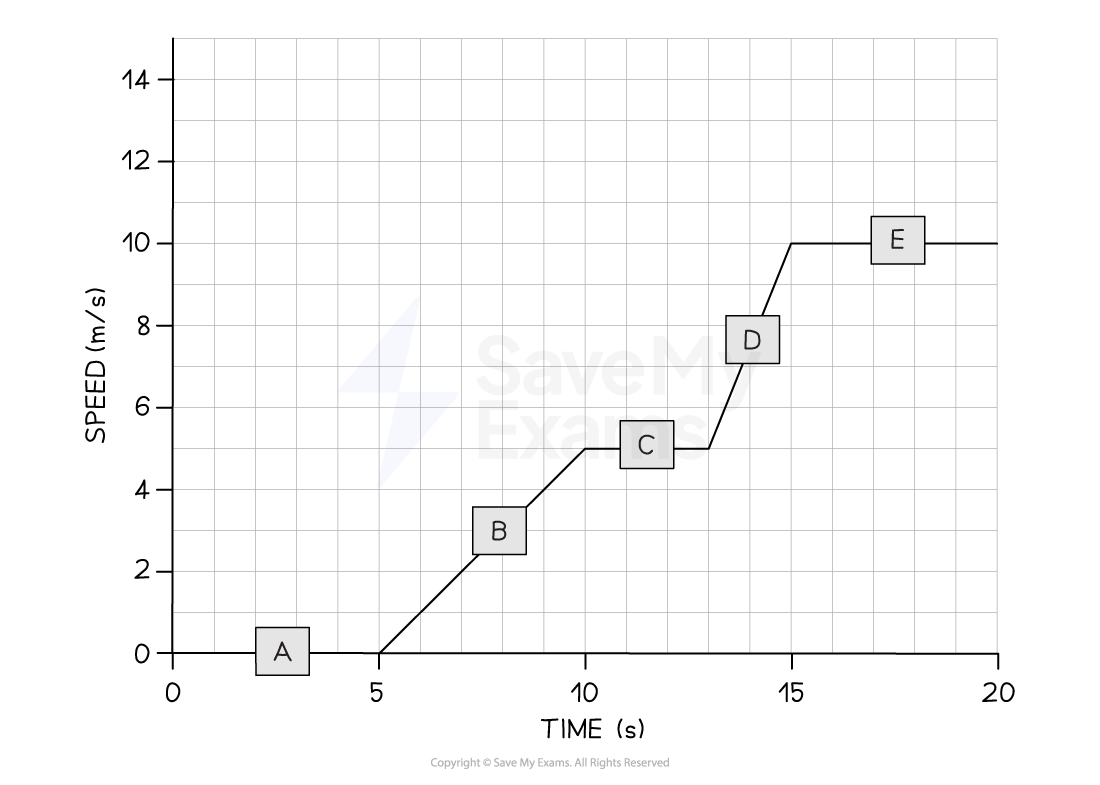
(a) In which section (A, B, C, D, or E) of the speed-time graph is the cyclist's acceleration the largest? [1]
(b) Calculate the cyclist's acceleration between 5 and 10 seconds. [3]
Answer:
Part (a)
Step 1: Recall that the slope of a speed-time graph represents the magnitude of acceleration
The slope of a speed-time graph indicates the magnitude of acceleration
Therefore, the only sections of the graph where the cyclist is accelerating are sections B and D
Sections A, C and E are flat; in other words, the cyclist is moving at a constant speed (therefore, not accelerating)
Step 2: Identify the section with the steepest slope
Section D of the graph has the steepest slope
Hence, the largest acceleration is shown in section D [1 mark]
Part (b)
Step 1: Recall that the gradient of a speed-time graph gives the acceleration
Calculating the gradient of a slope on a speed-time graph gives the acceleration for that time period [1 mark]
Step 2: Draw a large gradient triangle at the appropriate section of the graph
A gradient triangle is drawn for the time period between 5 and 10 seconds [1 mark]
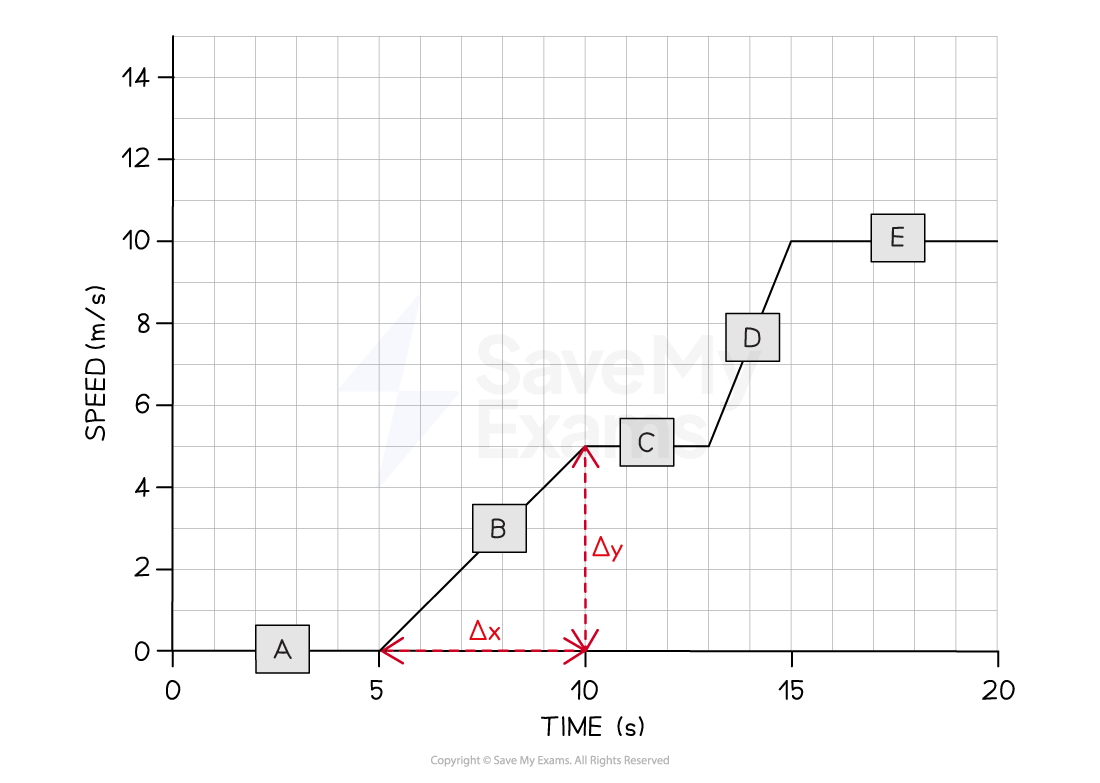
Step 3: Calculate the size of the gradient and state this as the acceleration
The acceleration is given by the gradient, which can be calculated using:
Therefore, the cyclist accelerated at 1 m/s2 between 5 and 10 seconds [1 mark]
Examiner Tips and Tricks
Use the entire straight-line section, where possible, to calculate the gradient. Examiners tend to award credit if they see a large gradient triangle used.
Remember to actually draw the lines directly on the graph itself, particularly when the question asks you to use the graph to calculate the acceleration.
Worked Example
A skydiver jumps from a plane and reaches terminal velocity after 15 seconds. A speed-time graph of their motion is shown below.
Use the graph to find the acceleration at 5 seconds.
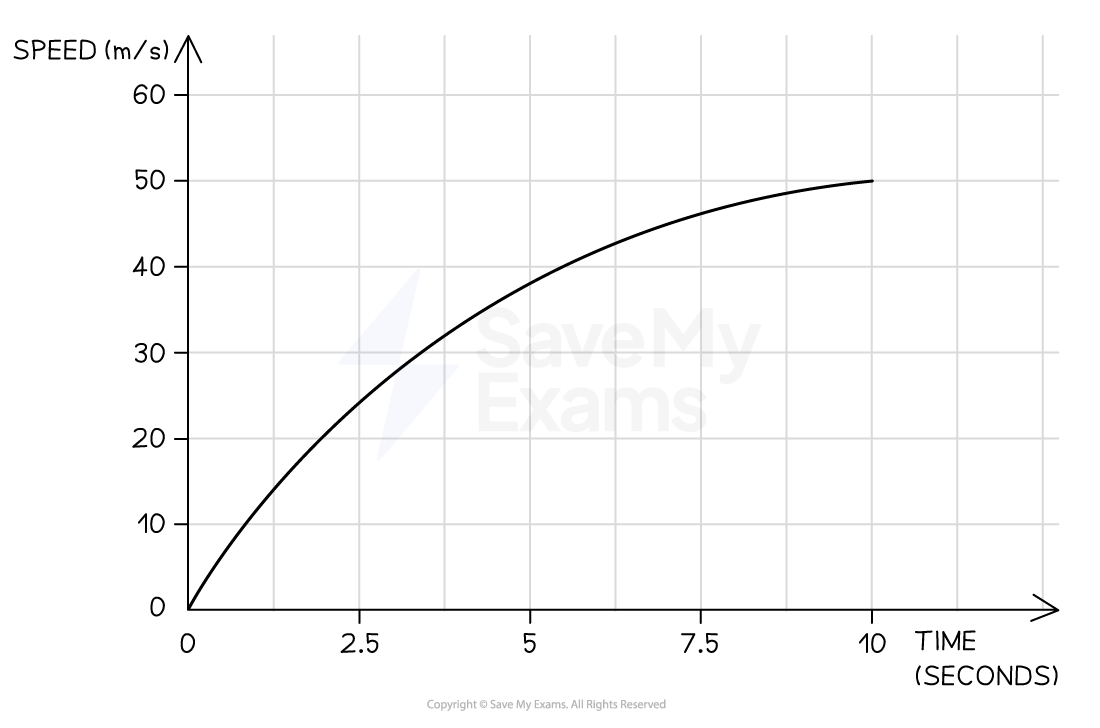
[3]
Answer:
Step 1: Draw a tangent to the curve at the point where t = 5 s [1 mark]
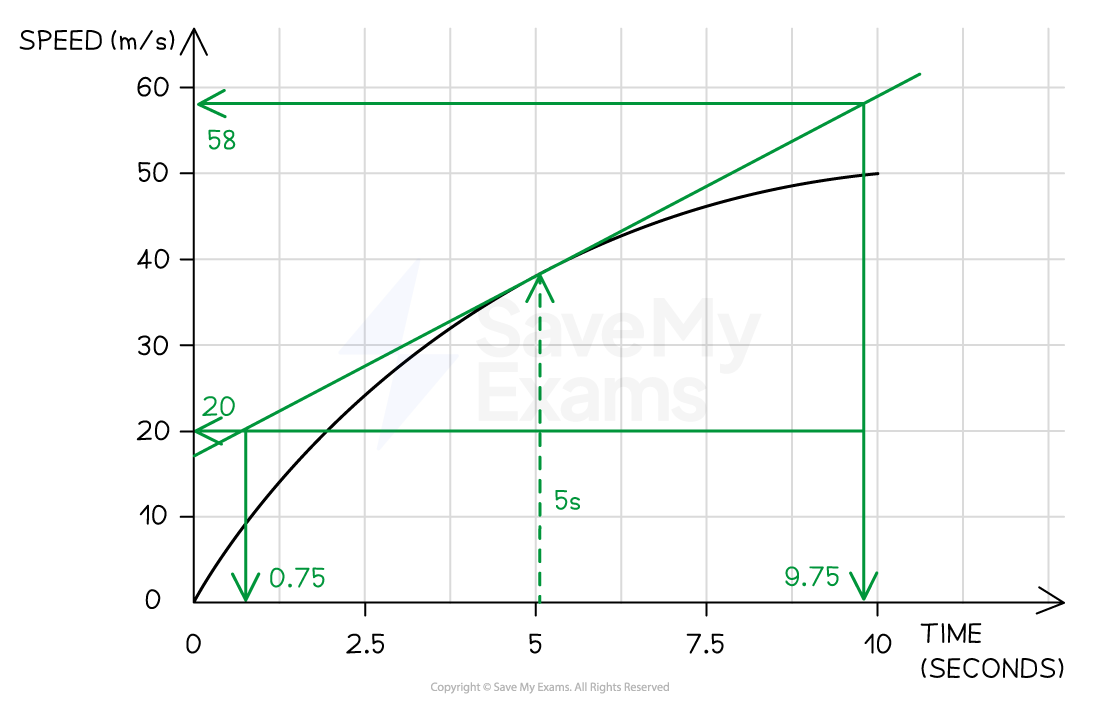
Step 2: Calculate the gradient of the tangent
Change in y (speed):
Change in x (time):
[1 mark]
[1 mark]
Examiner Tips and Tricks
The CIE IGCSE Physics specification includes knowing how to calculate the gradient of a tangent to the curve in the maths skills section. This means that you could be asked to demonstrate this skill in any topic. The skills in this revision note are applicable to any type of graph. For more information on interpreting graphs in Physics, see the article Graph skills in GCSE Physics

Unlock more, it's free!
Join the 100,000+ Students that ❤️ Save My Exams
the (exam) results speak for themselves:

Was this revision note helpful?
Build on this topic