Syllabus Edition

First teaching 2021

Last exams 2024

|

Using Graphs (CIE IGCSE Maths: Extended)

Revision Note

Test yourself
Daniel I

Author

Daniel I

Last updated

Did this video help you?

Solving Equations Using Graphs

How do we use graphs to solve equations?

  • Solutions are always read off the x-axis
  • Solutions of f(x) = 0 are where the graph of y = f(x) crosses the x-axis
  • If asked to use the graph of y = f(x) to solve a different equation (the question will say something like “by drawing a suitable straight line”) then:
    • Rearrange the equation to be solved into f(x) = mx + c and draw the line y = mx + c
    • Solutions are the x-coordinates of where the line (y = mx + c) crosses the curve (y = f(x))
    • E.g. if given the curve for y = x3 + 2x2 + 1 and asked to solve x3 + 2x2  − x − 1 = 0, then;

      1. rearrange x3 + 2x2  − x − 1 = 0 to x3 + 2x2 + 1 = x + 2
      2. draw the line y = x + 2 on the curve y = x3 + 2x2 + 1
      3. read the x-values of where the line and the curve cross (in this case there would be 3 solutions, approximately x = -2.2, x = -0.6 and x = 0.8);

2-15-2-solving-equations-using-graphs

  • Note that solutions may also be called roots

How do we use graphs to solve linear simultaneous equations?

  • Plot both equations on the same set of axes using straight line graphs y = mx + c
  • Find where the lines intersect (cross)
    • The x and y solutions to the simultaneous equations are the x and y coordinates of the point of intersection
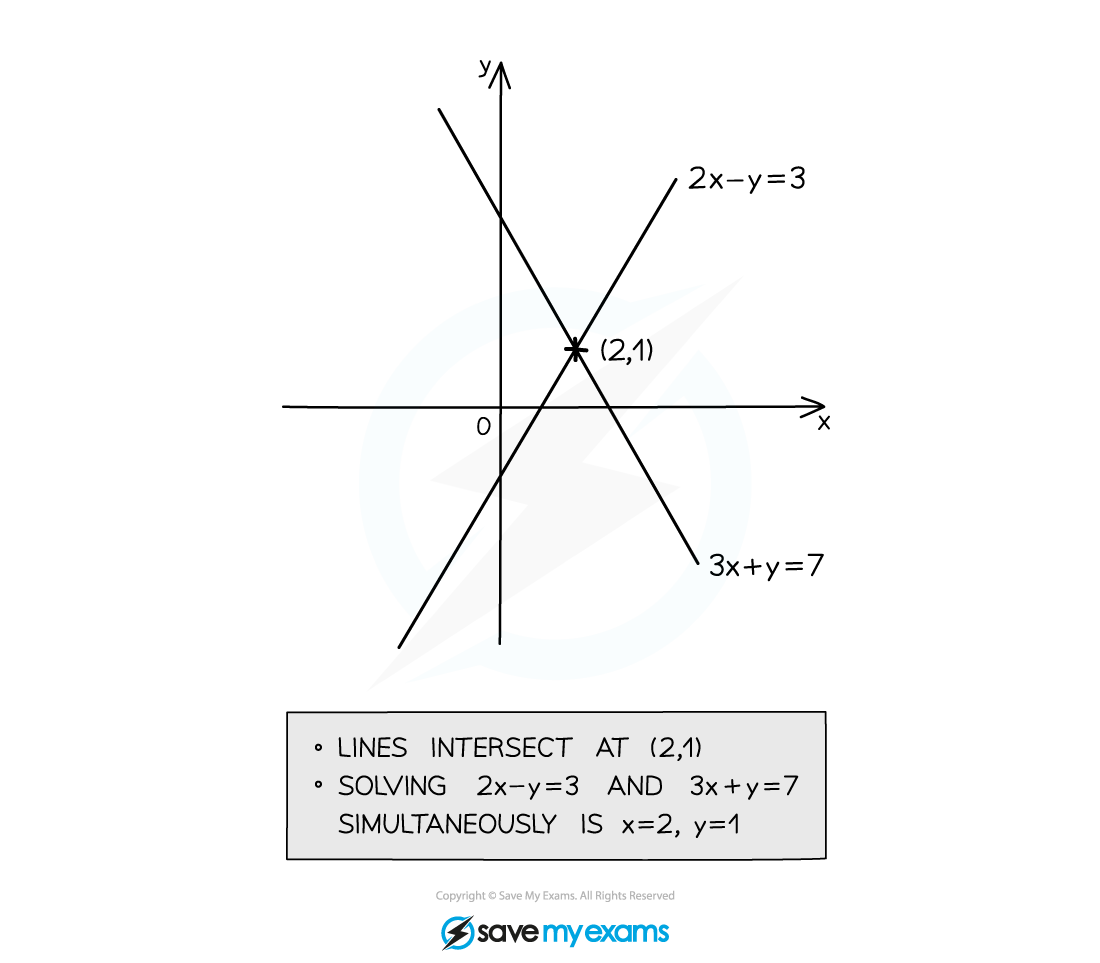
  • e.g. to solve 2x - y = 3 and 3x + y = 4 simultaneously, first plot them both (see graph)
    • find the point of intersection, (2, 1)
    • the solution is x = 2 and y = 1

Solving Equations Graphically Notes Diagram 1, A Level & AS Level Pure Maths Revision Notes

How do we use graphs to solve simultaneous equations where one is quadratic?

  • e.g. to solve y = x2 + 4x − 12 and y = 1 simultaneously, first plot them both (see graph)
    • find the two points of intersection (by reading off your scale), (-6.1 , 1) and (-2.1, 1) to 1 decimal place
    • the solutions from the graph are approximately x = -6.1 and y = 1 and x = 2.1 and y = 1
      • note their are two pairs of x, y solutions 
      • to find exact solutions, use algebra

Solving Equations Graphically Notes Diagram 2, A Level & AS Level Pure Maths Revision Notes

Examiner Tip

  • If solving an equation, give the x values only as your final answer
  • If solving a pair of linear simultaneous equations give an x and a y value as your final answer
  • If solving a pair of simultaneous equations where one is linear and one is quadratic, give two pairs of x and y values as your final answer

Worked example

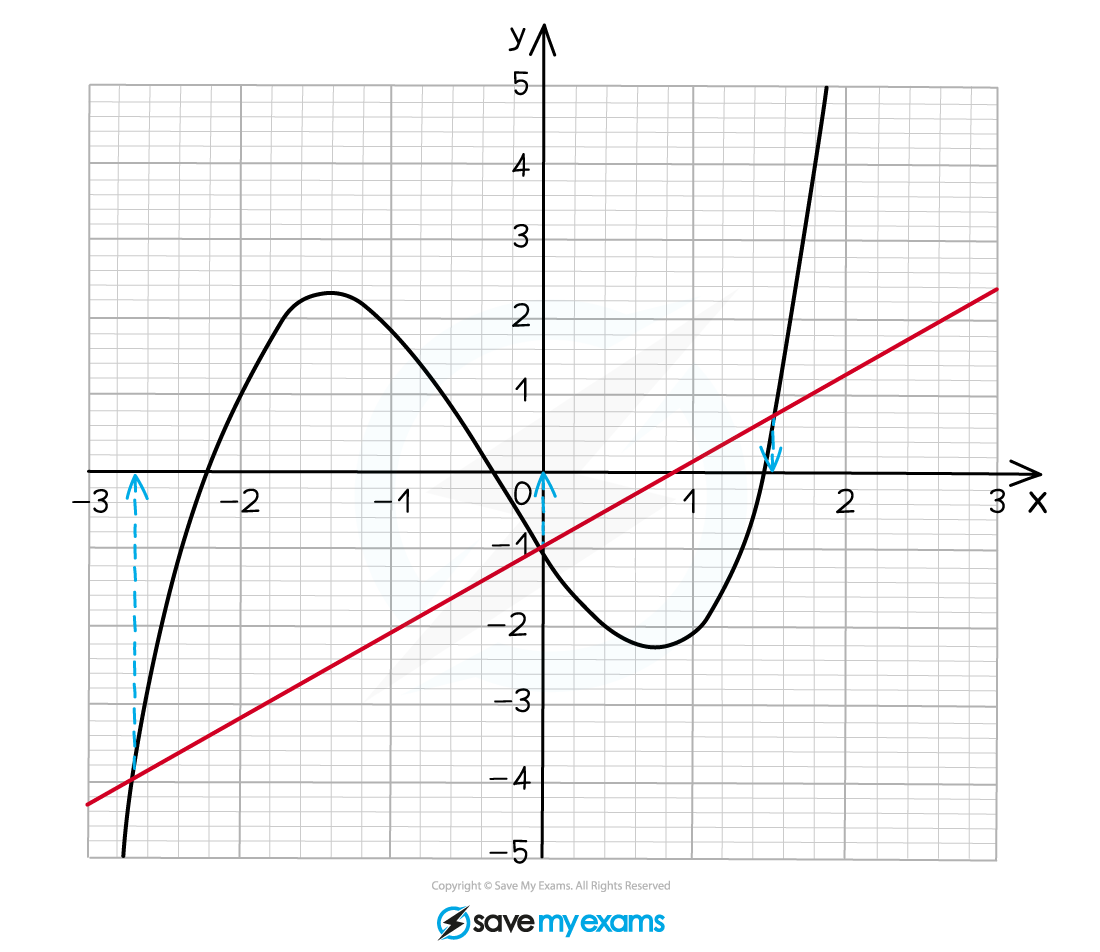
The graph of y equals x cubed plus x squared minus 3 x minus 1 is shown below.
Use the graph to estimate the solutions of the equation x cubed plus x squared minus 4 x equals 0. Give your answers to 1 decimal place.
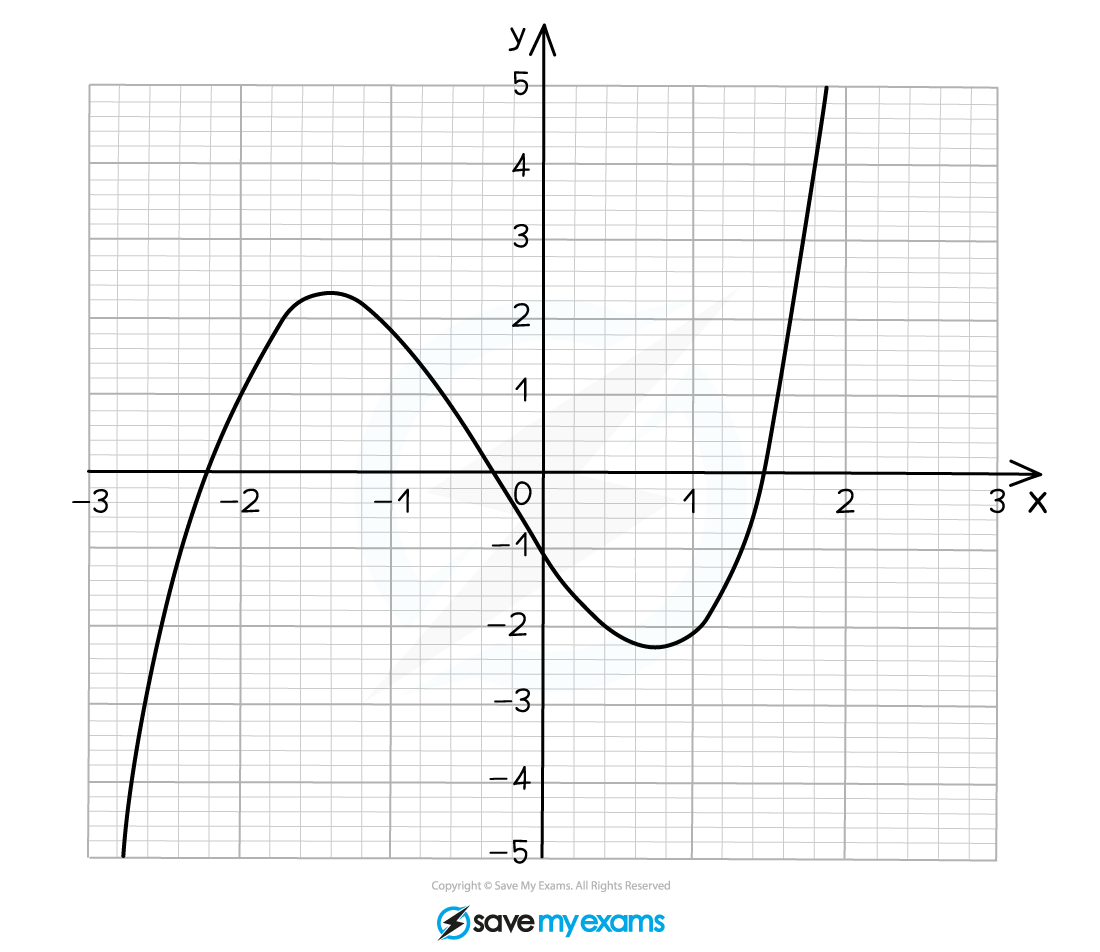
Cubic-Linear-Intersections-(before), IGCSE & GCSE Maths revision notes

We are given a different equation to the one plotted so we must rearrange it to f open parentheses x close parentheses equals m x plus c (where f open parentheses x close parentheses is the plotted graph)

table attributes columnalign right center left columnspacing 0px end attributes row cell x cubed plus x squared minus 4 x end cell equals 0 end table

table row blank blank cell plus x minus 1 space space space space space space space space space space space space space space space space space space space space space space space space plus x minus 1 end cell end table

table attributes columnalign right center left columnspacing 0px end attributes row cell x cubed plus x squared minus 3 x plus 1 end cell equals cell x minus 1 end cell end table

Now plot y equals x minus 1 on the graph- this is the solid red line on the graph below

Cubic-Linear-Intersections-(after), IGCSE & GCSE Maths revision notes

The solutions are the x coordinates of where the curve and the straight line cross so

bold italic x bold equals bold minus bold 2 bold. bold 6 bold comma bold space bold space bold italic x bold equals bold 0 bold comma bold space bold space bold italic x bold equals bold 1 bold. bold 6

Did this video help you?

Finding Gradients of Tangents

What is the gradient of a graph?

  • The gradient of a graph at any point is equal to the gradient of the tangent to the curve at that point
  • Remember that a tangent is a line that just touches a curve (and doesn’t cross it)

GoNL Notes fig4, downloadable IGCSE & GCSE Maths revision notes

How do I estimate the gradient under a graph?

  • To find an estimate for the gradient:
    • Draw a tangent to the curve
    • Find the gradient of the tangent using Gradient = RISE ÷ RUN

    cie-igcse-2-15

      • In the example above, the gradient at x = 4 would be fraction numerator negative 2.5 over denominator 4 end fraction equals negative 0.625
  • It is an estimate because the tangent has been drawn by eye and is not exact
    • (To find the exact gradient we would need to use differentiation)

What does the gradient represent?

  • In a y-x graph, the gradient represents the rate of change of y against x
  • This has many practical applications, for example;
    • in a distance-time graph, the gradient (rate of change of distance against time) is the speed
    • in a speed-time graph, the gradient (rate of change of speed against time) is the acceleration

Examiner Tip

  • This is particularly useful when working with Speed-Time and Distance-Time graphs if they are curves and not straight lines

Worked example

The graph below shows y space equals space cube root of x for 0 space less or equal than space x space less or equal than space 1.

estimating-areas-and-gradients-of-graphs-worked-example-1

Find an estimate of the gradient of the curve at the point where x space equals space 0.5.

Draw a tangent to the curve at the point where = 0.5.

estimating-areas-and-gradients-of-graphs-worked-example-1-image-2

Find suitable, easy to read coordinates and draw a right-angled triangle between them.

Find the difference in the y coordinates (rise) and the difference in the x coordinates (run).

estimating-areas-and-gradients-of-graphs-worked-example-1-image-3

 Divide the difference in (rise) by the difference in x. 

Gradient space equals space rise over run space equals fraction numerator space 0.3 over denominator 0.5 end fraction equals fraction numerator space 3 over denominator 5 end fraction

Estimate of gradient = 0.6

You've read 0 of your 10 free revision notes

Unlock more, it's free!

Join the 100,000+ Students that ❤️ Save My Exams

the (exam) results speak for themselves:

Did this page help you?

Daniel I

Author: Daniel I

Expertise: Maths

Daniel has taught maths for over 10 years in a variety of settings, covering GCSE, IGCSE, A-level and IB. The more he taught maths, the more he appreciated its beauty. He loves breaking tricky topics down into a way they can be easily understood by students, and creating resources that help to do this.