Syllabus Edition

First teaching 2021

Last exams 2024

|

Using Graphs (CIE IGCSE Maths: Core)

Revision Note

Test yourself
Mark

Author

Mark

Last updated

Drawing Graphs Using a Table

How do I draw a graph using a table of values?

  • Before you start, think what the graph might look like
  • Using the rules of BIDMAS/order of operations, substitute each x- value into the given function
    • To avoid errors, always put negative numbers in brackets and use the (-) key rather than the subtraction key
  • Plot points and join with a smooth curve
  • If there are any points that don't seem to fit with the shape of the rest of the curve, check your calculations for them again!

How do I draw a graph using the table function on my calculator?

  • Before you start, think what the graph might look like
  • Find the TABLE function on your calculator
  • Enter the function – f(x)
    • (use ALPHA button and x or X, depending on make/model)

      (Press = when finished)

      (If you are asked for another function, g(x), just press enter again)
  • Enter Start value, End value and Step size (gap between x values)
  • Press = and scroll up and down to see y values
  • Plot points and join with a smooth curve

Examiner Tip

  • When using the TABLE function of your calculator, double-check that your calculator's y-values are the same as any that are given in the question

Worked example

(a)
Complete the table of values for the graph of y equals 10 minus 8 x squared.

x negative 1.5 negative 1 negative 0.5 0 0.5 1 1.5
y   2         negative 8

Use the TABLE function on your calculator for
f open parentheses x close parentheses equals 10 minus 8 x squared, starting at -1.5, ending at 1.5 and with steps of 0.5
If your calculator does not have a TABLE function then substitute the values of x into the function one by one for the missing values, being careful to put negative numbers in brackets, e.g.
 
x equals negative 1.5 comma space y equals 10 minus 8 open parentheses negative 1.5 close parentheses squared

x negative 1.5 negative 1 negative 0.5 0 0.5 1 1.5
y -8 2 8 10 8 2 negative 8
 

(b)
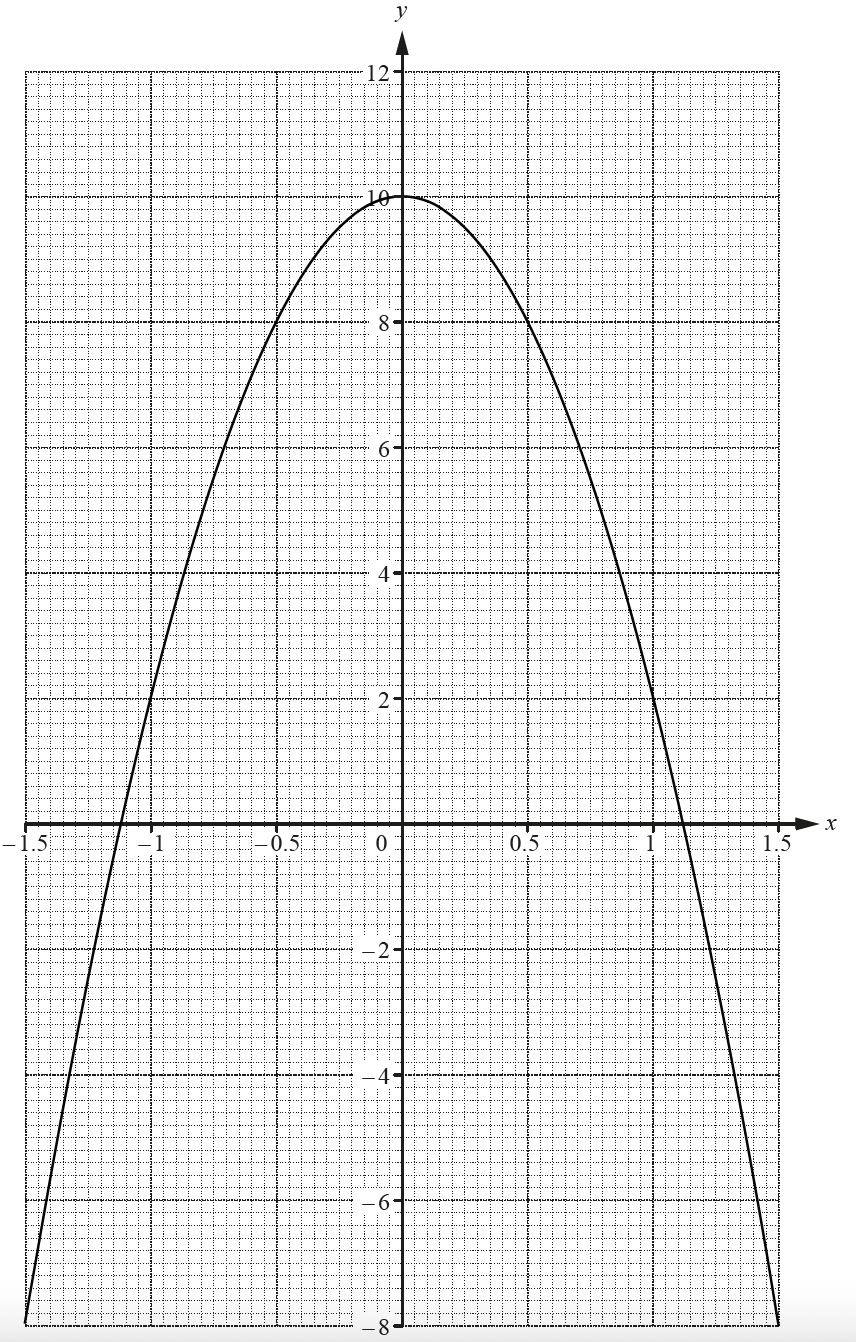
Plot the graph of y equals 10 minus 8 x squared for values of x from negative 1.5 to 1.5.


Carefully plot the points from your table of values on to a grid, noting any different scales on the axes

After plotting the points, join them with a smooth curve- do not use a ruler!

cie-igcse-2018-may-jun-1-7

(c)
Write down the equation of the line of symmetry of the curve.
 
There is a vertical line of symmetry about the y-axis
The equation of the y-axis is x = 0
x = 0

Solving Equations Using Graphs

How do we use graphs to solve equations?

  • Let's say the graph of y equals x squared minus 4 x minus 2 is plotted
    • To solve x squared minus 4 x minus 2 equals 0 (graph = zero) the solutions are the two x-intercepts (where the curve cuts the x-axis)
    • To solve x squared minus 4 x minus 2 equals x plus 1, (graph = function) plot y = x + 1 on the same axes and read off the x-coordinates of the two points of intersection
    • To solve x squared minus 4 x plus 3 equals 1 (not graph = function) add / subtract terms from both sides to get graph = function
      • e.g. subtract 5 from both sides to get x squared minus 4 x minus 2 equals negative 4 (graph = function), so plot y = -4 and read off x-coordinates of the points of intersection
  • Note that solutions can also be called roots 

How do we use graphs to solve linear simultaneous equations?

  • Plot both equations on the same set of axes using straight line graphs y = mx + c
  • Find where the lines intersect (cross)
    • The x and y solutions to the simultaneous equations are the x and y coordinates of the point of intersection
  • e.g. to solve 2x - y = 3 and 3x + y = 4 simultaneously, first plot them both (see graph)
    • find the point of intersection, (2, 1)
    • the solution is x = 2 and y = 1

Solving Equations Graphically Notes Diagram 1, A Level & AS Level Pure Maths Revision Notes

Examiner Tip

  • If solving an equation, give the x values only as your final answer
  • If solving a pair of linear simultaneous equations give an x and a y value as your final answer

Worked example

Use the graph of y equals 10 minus 8 x squared shown to estimate the solutions of the equations below.

cie-igcse-2018-may-jun-1-7

(a)
10 minus 8 x squared equals 0
 
This has the form "graph = 0" so find the x-intercepts (where the curve cuts the x-axis)
Use a suitable level of accuracy (at most 2 decimal places for this graph)
  
-1.12 and 1.12
 
These are the two solutions to the equation
x = -1.12 and x = 1.12
A range of solutions are usually accepted, such as "between 1.1 and 1.25"
 
(b)
10 minus 8 x squared equals 8
 
This has the form "graph = function" so plot y = 8 (a horizontal line at height 8)
Find the x-intercepts of this horizontal line and the graph
  
-0.5 and 0.5
 
These are the two solutions to the original equation
x = -0.5 and x = 0.5
No range of solutions are accepted here as the points are exact

You've read 0 of your 5 free revision notes this week

Sign up now. It’s free!

Join the 100,000+ Students that ❤️ Save My Exams

the (exam) results speak for themselves:

Did this page help you?

Mark

Author: Mark

Expertise: Maths

Mark graduated twice from the University of Oxford: once in 2009 with a First in Mathematics, then again in 2013 with a PhD (DPhil) in Mathematics. He has had nine successful years as a secondary school teacher, specialising in A-Level Further Maths and running extension classes for Oxbridge Maths applicants. Alongside his teaching, he has written five internal textbooks, introduced new spiralling school curriculums and trained other Maths teachers through outreach programmes.