Classifying Stationary Points (Edexcel IGCSE Maths A) : Revision Note

Did this video help you?
Classifying Stationary Points
What are the different types of stationary points?
You need to know two different types of stationary points:
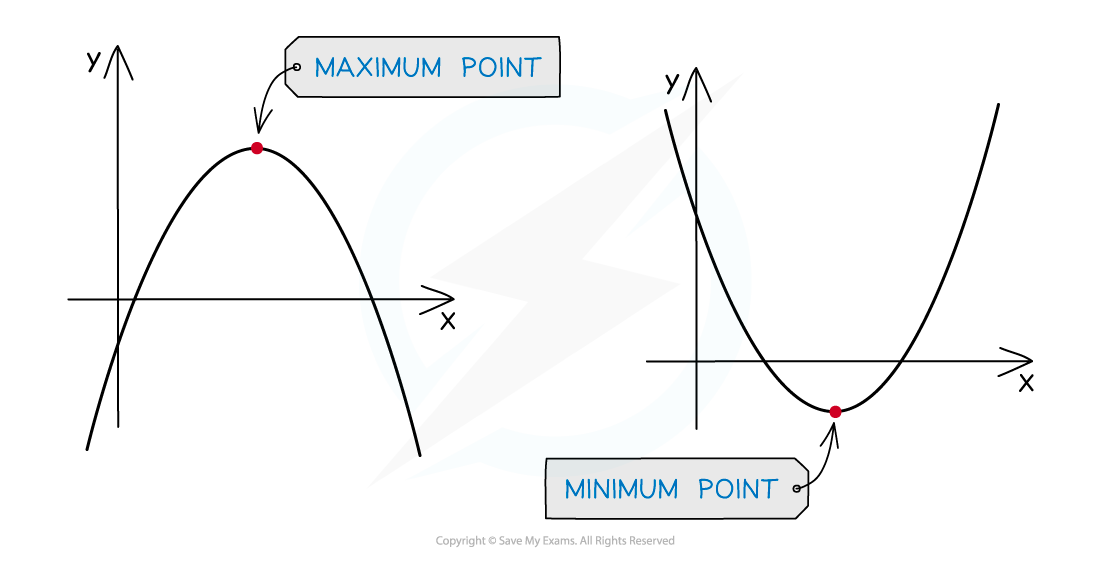
Maximum points (this is where the graph reaches a “peak”)
Minimum points (this is where the graph reaches a “trough”)
These are also called turning points
Deciding which is which is called classifying them (or finding the nature of them)
If a graph has multiple turning points, the one you are interested in can be described as a local maximum or minimum point
Other parts of the graph may still reach higher/lower values elsewhere
How do I classify turning points using graphs?
You can use the shape of common graphs to classify different turning points
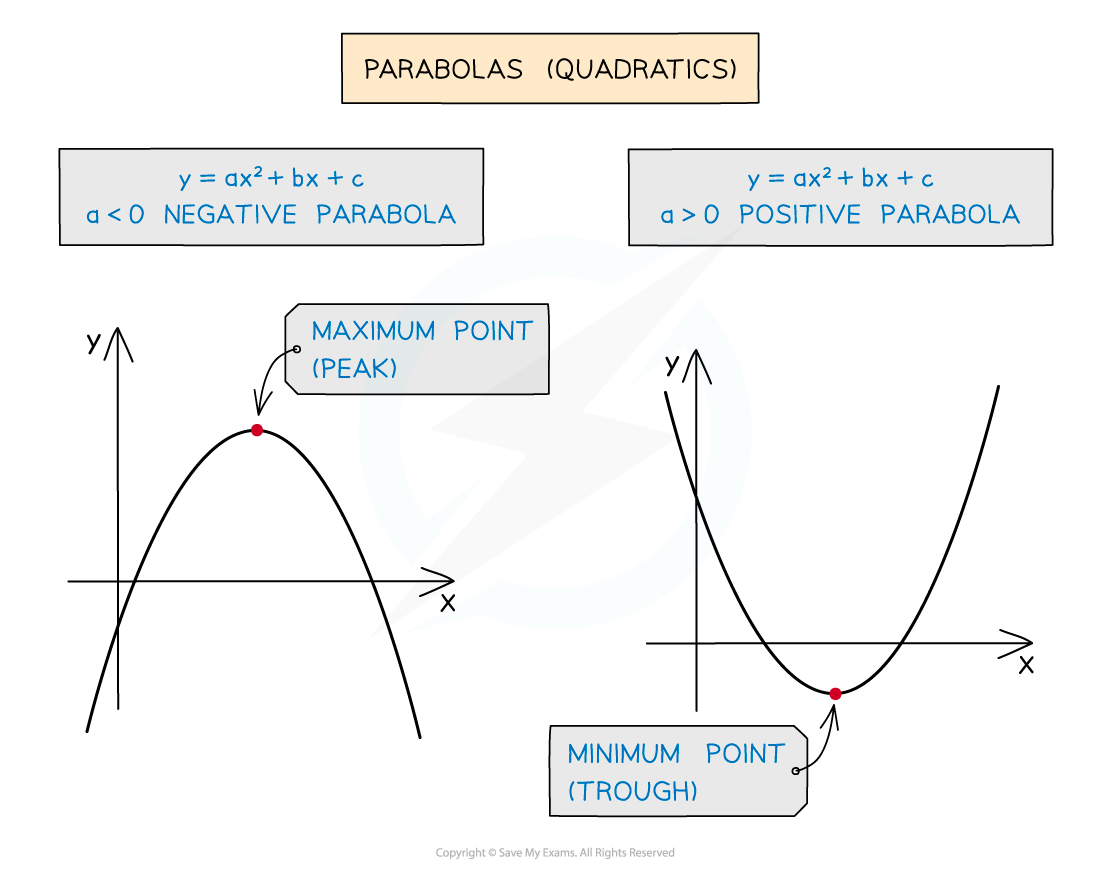
To classify the turning point on a quadratic curve (parabola), remember that:
A positive quadratic (positive x2 term) must have a minimum point
A negative quadratic (negative x2 term) must have a maximum point
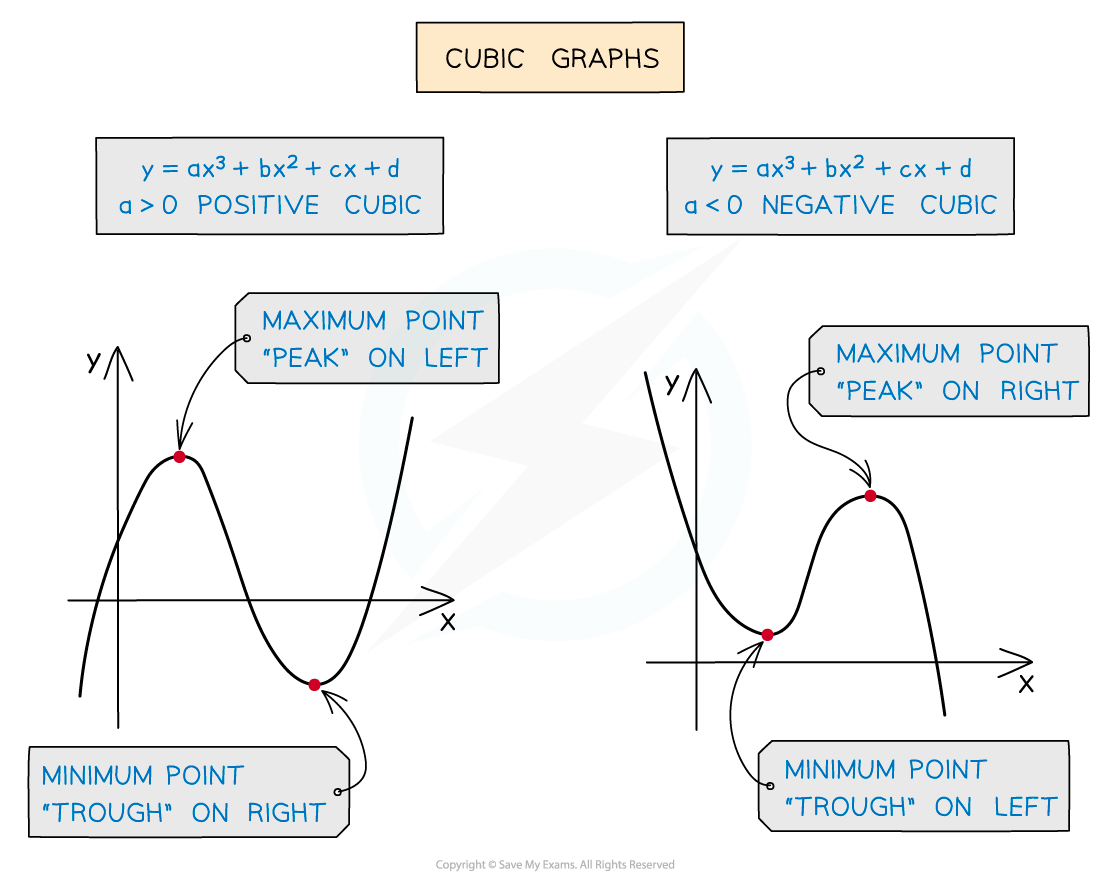
To classify two different turning points on a cubic curve, remember that:
A positive cubic has a maximum point on the left and a minimum on the right
A negative cubic has a minimum point on the left and a maximum on the right
Worked Example
The turning points on the curve with equation ![]() are (-2, 21) and (1, -6).
are (-2, 21) and (1, -6).
Determine the nature of these turning points.
Make a quick sketch of the curve
It is a positive cubic so you know that it will start at the bottom left, have two turning points and go towards the top right
You know the coordinates of the turning points and the y-intercept: (0, 1)
(the sketch does not have to be perfect!)
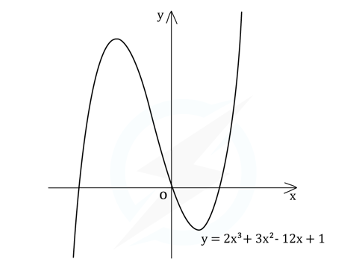
From the graph, which is a positive cubic,
(-2, 21) is to the left of (1, -6)
Therefore, (-2, 21) is a maximum point and (1, -6) is a minimum point

You've read 0 of your 5 free revision notes this week
Sign up now. It’s free!
Did this page help you?
