Drawing Cumulative Frequency Diagrams (Edexcel IGCSE Maths A (Modular)): Revision Note
Exam code: 4XMAF/4XMAH

Did this video help you?
Drawing cumulative frequency diagrams
What is a cumulative frequency diagram?
A cumulative frequency diagram is a way of representing grouped continuous data
A cumulative frequency diagram can be used to estimate other statistical values
For example the median, quartiles or percentiles
How do I draw a cumulative frequency diagram?
This is best explained with an example
The times taken to complete a short general knowledge quiz taken by 50 students are shown in the table below:
Time taken (
 seconds)
Frequency
format('truetype')%3Bfont-weight%3Anormal%3Bfont-style%3Anormal%3B%7D%3C%2Fstyle%3E%3C%2Fdefs%3E%3Ctext%20font-family%3D%22Times%20New%20Roman%22%20font-size%3D%2218%22%20text-anchor%3D%22middle%22%20x%3D%229.5%22%20y%3D%2216%22%3E25%3C%2Ftext%3E%3Ctext%20font-family%3D%22math1d3114856d6c6df443e3168d768%22%20font-size%3D%2216%22%20text-anchor%3D%22middle%22%20x%3D%2226.5%22%20y%3D%2216%22%3E%26%23x2264%3B%3C%2Ftext%3E%3Ctext%20font-family%3D%22Times%20New%20Roman%22%20font-size%3D%2218%22%20font-style%3D%22italic%22%20text-anchor%3D%22middle%22%20x%3D%2237.5%22%20y%3D%2216%22%3Es%3C%2Ftext%3E%3Ctext%20font-family%3D%22math1d3114856d6c6df443e3168d768%22%20font-size%3D%2216%22%20text-anchor%3D%22middle%22%20x%3D%2250.5%22%20y%3D%2216%22%3E%26lt%3B%3C%2Ftext%3E%3Ctext%20font-family%3D%22Times%20New%20Roman%22%20font-size%3D%2218%22%20text-anchor%3D%22middle%22%20x%3D%2267.5%22%20y%3D%2216%22%3E30%3C%2Ftext%3E%3C%2Fsvg%3E)
3
format('truetype')%3Bfont-weight%3Anormal%3Bfont-style%3Anormal%3B%7D%3C%2Fstyle%3E%3C%2Fdefs%3E%3Ctext%20font-family%3D%22Times%20New%20Roman%22%20font-size%3D%2218%22%20text-anchor%3D%22middle%22%20x%3D%229.5%22%20y%3D%2216%22%3E30%3C%2Ftext%3E%3Ctext%20font-family%3D%22math1d3114856d6c6df443e3168d768%22%20font-size%3D%2216%22%20text-anchor%3D%22middle%22%20x%3D%2226.5%22%20y%3D%2216%22%3E%26%23x2264%3B%3C%2Ftext%3E%3Ctext%20font-family%3D%22Times%20New%20Roman%22%20font-size%3D%2218%22%20font-style%3D%22italic%22%20text-anchor%3D%22middle%22%20x%3D%2237.5%22%20y%3D%2216%22%3Es%3C%2Ftext%3E%3Ctext%20font-family%3D%22math1d3114856d6c6df443e3168d768%22%20font-size%3D%2216%22%20text-anchor%3D%22middle%22%20x%3D%2250.5%22%20y%3D%2216%22%3E%26lt%3B%3C%2Ftext%3E%3Ctext%20font-family%3D%22Times%20New%20Roman%22%20font-size%3D%2218%22%20text-anchor%3D%22middle%22%20x%3D%2267.5%22%20y%3D%2216%22%3E35%3C%2Ftext%3E%3C%2Fsvg%3E)
8
format('truetype')%3Bfont-weight%3Anormal%3Bfont-style%3Anormal%3B%7D%3C%2Fstyle%3E%3C%2Fdefs%3E%3Ctext%20font-family%3D%22Times%20New%20Roman%22%20font-size%3D%2218%22%20text-anchor%3D%22middle%22%20x%3D%229.5%22%20y%3D%2216%22%3E35%3C%2Ftext%3E%3Ctext%20font-family%3D%22math1d3114856d6c6df443e3168d768%22%20font-size%3D%2216%22%20text-anchor%3D%22middle%22%20x%3D%2226.5%22%20y%3D%2216%22%3E%26%23x2264%3B%3C%2Ftext%3E%3Ctext%20font-family%3D%22Times%20New%20Roman%22%20font-size%3D%2218%22%20font-style%3D%22italic%22%20text-anchor%3D%22middle%22%20x%3D%2237.5%22%20y%3D%2216%22%3Es%3C%2Ftext%3E%3Ctext%20font-family%3D%22math1d3114856d6c6df443e3168d768%22%20font-size%3D%2216%22%20text-anchor%3D%22middle%22%20x%3D%2250.5%22%20y%3D%2216%22%3E%26lt%3B%3C%2Ftext%3E%3Ctext%20font-family%3D%22Times%20New%20Roman%22%20font-size%3D%2218%22%20text-anchor%3D%22middle%22%20x%3D%2267.5%22%20y%3D%2216%22%3E40%3C%2Ftext%3E%3C%2Fsvg%3E)
17
format('truetype')%3Bfont-weight%3Anormal%3Bfont-style%3Anormal%3B%7D%3C%2Fstyle%3E%3C%2Fdefs%3E%3Ctext%20font-family%3D%22Times%20New%20Roman%22%20font-size%3D%2218%22%20text-anchor%3D%22middle%22%20x%3D%229.5%22%20y%3D%2216%22%3E40%3C%2Ftext%3E%3Ctext%20font-family%3D%22math1d3114856d6c6df443e3168d768%22%20font-size%3D%2216%22%20text-anchor%3D%22middle%22%20x%3D%2226.5%22%20y%3D%2216%22%3E%26%23x2264%3B%3C%2Ftext%3E%3Ctext%20font-family%3D%22Times%20New%20Roman%22%20font-size%3D%2218%22%20font-style%3D%22italic%22%20text-anchor%3D%22middle%22%20x%3D%2237.5%22%20y%3D%2216%22%3Es%3C%2Ftext%3E%3Ctext%20font-family%3D%22math1d3114856d6c6df443e3168d768%22%20font-size%3D%2216%22%20text-anchor%3D%22middle%22%20x%3D%2250.5%22%20y%3D%2216%22%3E%26lt%3B%3C%2Ftext%3E%3Ctext%20font-family%3D%22Times%20New%20Roman%22%20font-size%3D%2218%22%20text-anchor%3D%22middle%22%20x%3D%2267.5%22%20y%3D%2216%22%3E45%3C%2Ftext%3E%3C%2Fsvg%3E)
12
format('truetype')%3Bfont-weight%3Anormal%3Bfont-style%3Anormal%3B%7D%3C%2Fstyle%3E%3C%2Fdefs%3E%3Ctext%20font-family%3D%22Times%20New%20Roman%22%20font-size%3D%2218%22%20text-anchor%3D%22middle%22%20x%3D%229.5%22%20y%3D%2216%22%3E45%3C%2Ftext%3E%3Ctext%20font-family%3D%22math1d3114856d6c6df443e3168d768%22%20font-size%3D%2216%22%20text-anchor%3D%22middle%22%20x%3D%2226.5%22%20y%3D%2216%22%3E%26%23x2264%3B%3C%2Ftext%3E%3Ctext%20font-family%3D%22Times%20New%20Roman%22%20font-size%3D%2218%22%20font-style%3D%22italic%22%20text-anchor%3D%22middle%22%20x%3D%2237.5%22%20y%3D%2216%22%3Es%3C%2Ftext%3E%3Ctext%20font-family%3D%22math1d3114856d6c6df443e3168d768%22%20font-size%3D%2216%22%20text-anchor%3D%22middle%22%20x%3D%2250.5%22%20y%3D%2216%22%3E%26lt%3B%3C%2Ftext%3E%3Ctext%20font-family%3D%22Times%20New%20Roman%22%20font-size%3D%2218%22%20text-anchor%3D%22middle%22%20x%3D%2267.5%22%20y%3D%2216%22%3E50%3C%2Ftext%3E%3C%2Fsvg%3E)
7
format('truetype')%3Bfont-weight%3Anormal%3Bfont-style%3Anormal%3B%7D%3C%2Fstyle%3E%3C%2Fdefs%3E%3Ctext%20font-family%3D%22Times%20New%20Roman%22%20font-size%3D%2218%22%20text-anchor%3D%22middle%22%20x%3D%229.5%22%20y%3D%2216%22%3E50%3C%2Ftext%3E%3Ctext%20font-family%3D%22math1d3114856d6c6df443e3168d768%22%20font-size%3D%2216%22%20text-anchor%3D%22middle%22%20x%3D%2226.5%22%20y%3D%2216%22%3E%26%23x2264%3B%3C%2Ftext%3E%3Ctext%20font-family%3D%22Times%20New%20Roman%22%20font-size%3D%2218%22%20font-style%3D%22italic%22%20text-anchor%3D%22middle%22%20x%3D%2237.5%22%20y%3D%2216%22%3Es%3C%2Ftext%3E%3Ctext%20font-family%3D%22math1d3114856d6c6df443e3168d768%22%20font-size%3D%2216%22%20text-anchor%3D%22middle%22%20x%3D%2250.5%22%20y%3D%2216%22%3E%26lt%3B%3C%2Ftext%3E%3Ctext%20font-family%3D%22Times%20New%20Roman%22%20font-size%3D%2218%22%20text-anchor%3D%22middle%22%20x%3D%2267.5%22%20y%3D%2216%22%3E55%3C%2Ftext%3E%3C%2Fsvg%3E)
3
Total
50
Then the cumulative frequency is the running total of the frequencies
Time taken (
seconds)Frequency
Cumulative Frequency
3
3
8
3 + 8 = 11
17
11 + 17 = 28
12
28 + 12 = 40
7
40 + 7 = 47
3
47 + 3 = 50
Total
50
We can now draw the cumulative frequency diagram
The most important part is that cumulative frequency is plotted against the end (upper bound) of the class interval
The end of the class interval is the x-coordinate
The cumulative frequency is the y-coordinate
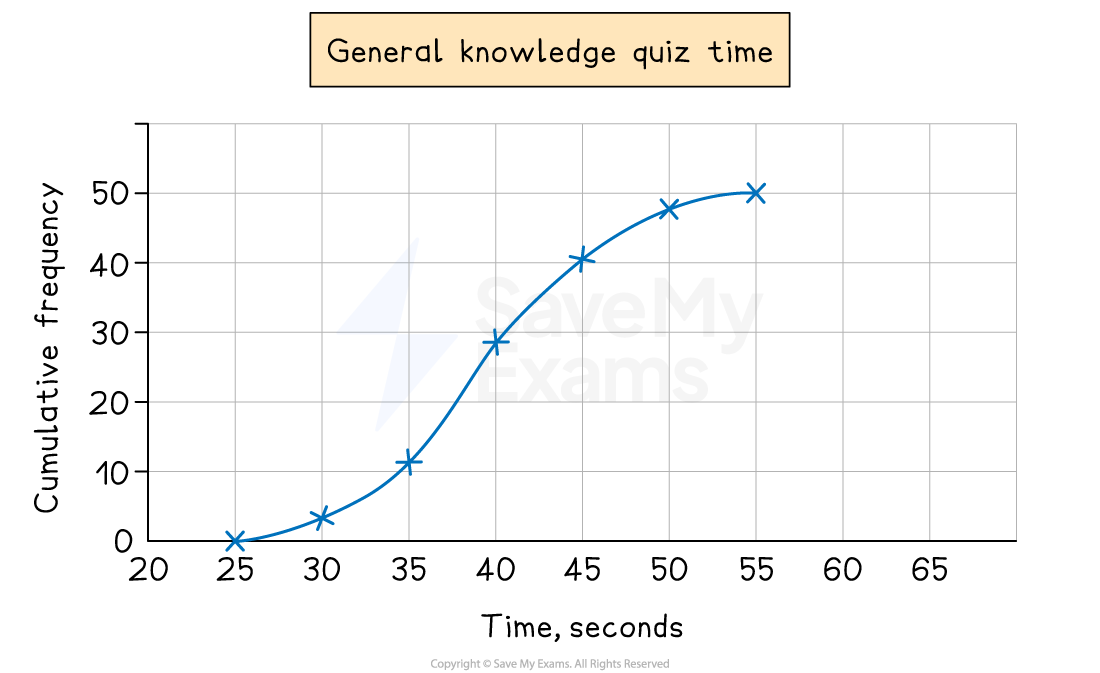
For the above example the first two points to plot would be (30, 3) and (35, 11)
To explain this, consider the second row (
)The 8 students in this group could have taken any time between 30 and 35 seconds
They cannot all be guaranteed to have been accounted for until we reach 35 seconds
Once all points from the table are plotted, a point for the start needs to be added
This will be at the lowest time from the table
i.e. at 25 seconds with a cumulative frequency of 0
Plot the point (25, 0)
Join points up with a smooth curve (this takes some practice)
Make sure it goes through all of the marked points
In general a cumulative frequency diagram has a stretched-S-shape appearance
A cumulative frequency diagram will never come back towards the x-axis
Here is the final cumulative frequency diagram for the quiz times

Unlock more, it's free!
Join the 100,000+ Students that ❤️ Save My Exams
the (exam) results speak for themselves:

Was this revision note helpful?
