Interpreting Histograms (Edexcel IGCSE Maths A (Modular)) : Revision Note

Did this video help you?
Interpreting Histograms
How do I interpret a histogram?
It is important to remember that the frequency density (y-) axis does not tell us frequency
The area of the bar is equal to the frequency
Note that a very simple histogram may have equal class widths
In this case the y-axis may be labelled 'frequency' instead of 'frequency density'
If 'frequency' is on the y-axis, then you can use the heights of the bars to directly determine the frequencies
You may be asked to estimate the frequency of part of a bar/class interval within a histogram
Find the area of the bar for the part of the interval required
Once area is known, frequency can be found as above
You can use histograms for two data sets to compare the data distributions
but only if they have the same class intervals and the same frequency density scales
Examiner Tips and Tricks
The frequency density axis will not always be labelled
Look carefully at the scale, it is unlikely to be 1 unit to 1 square
Worked Example
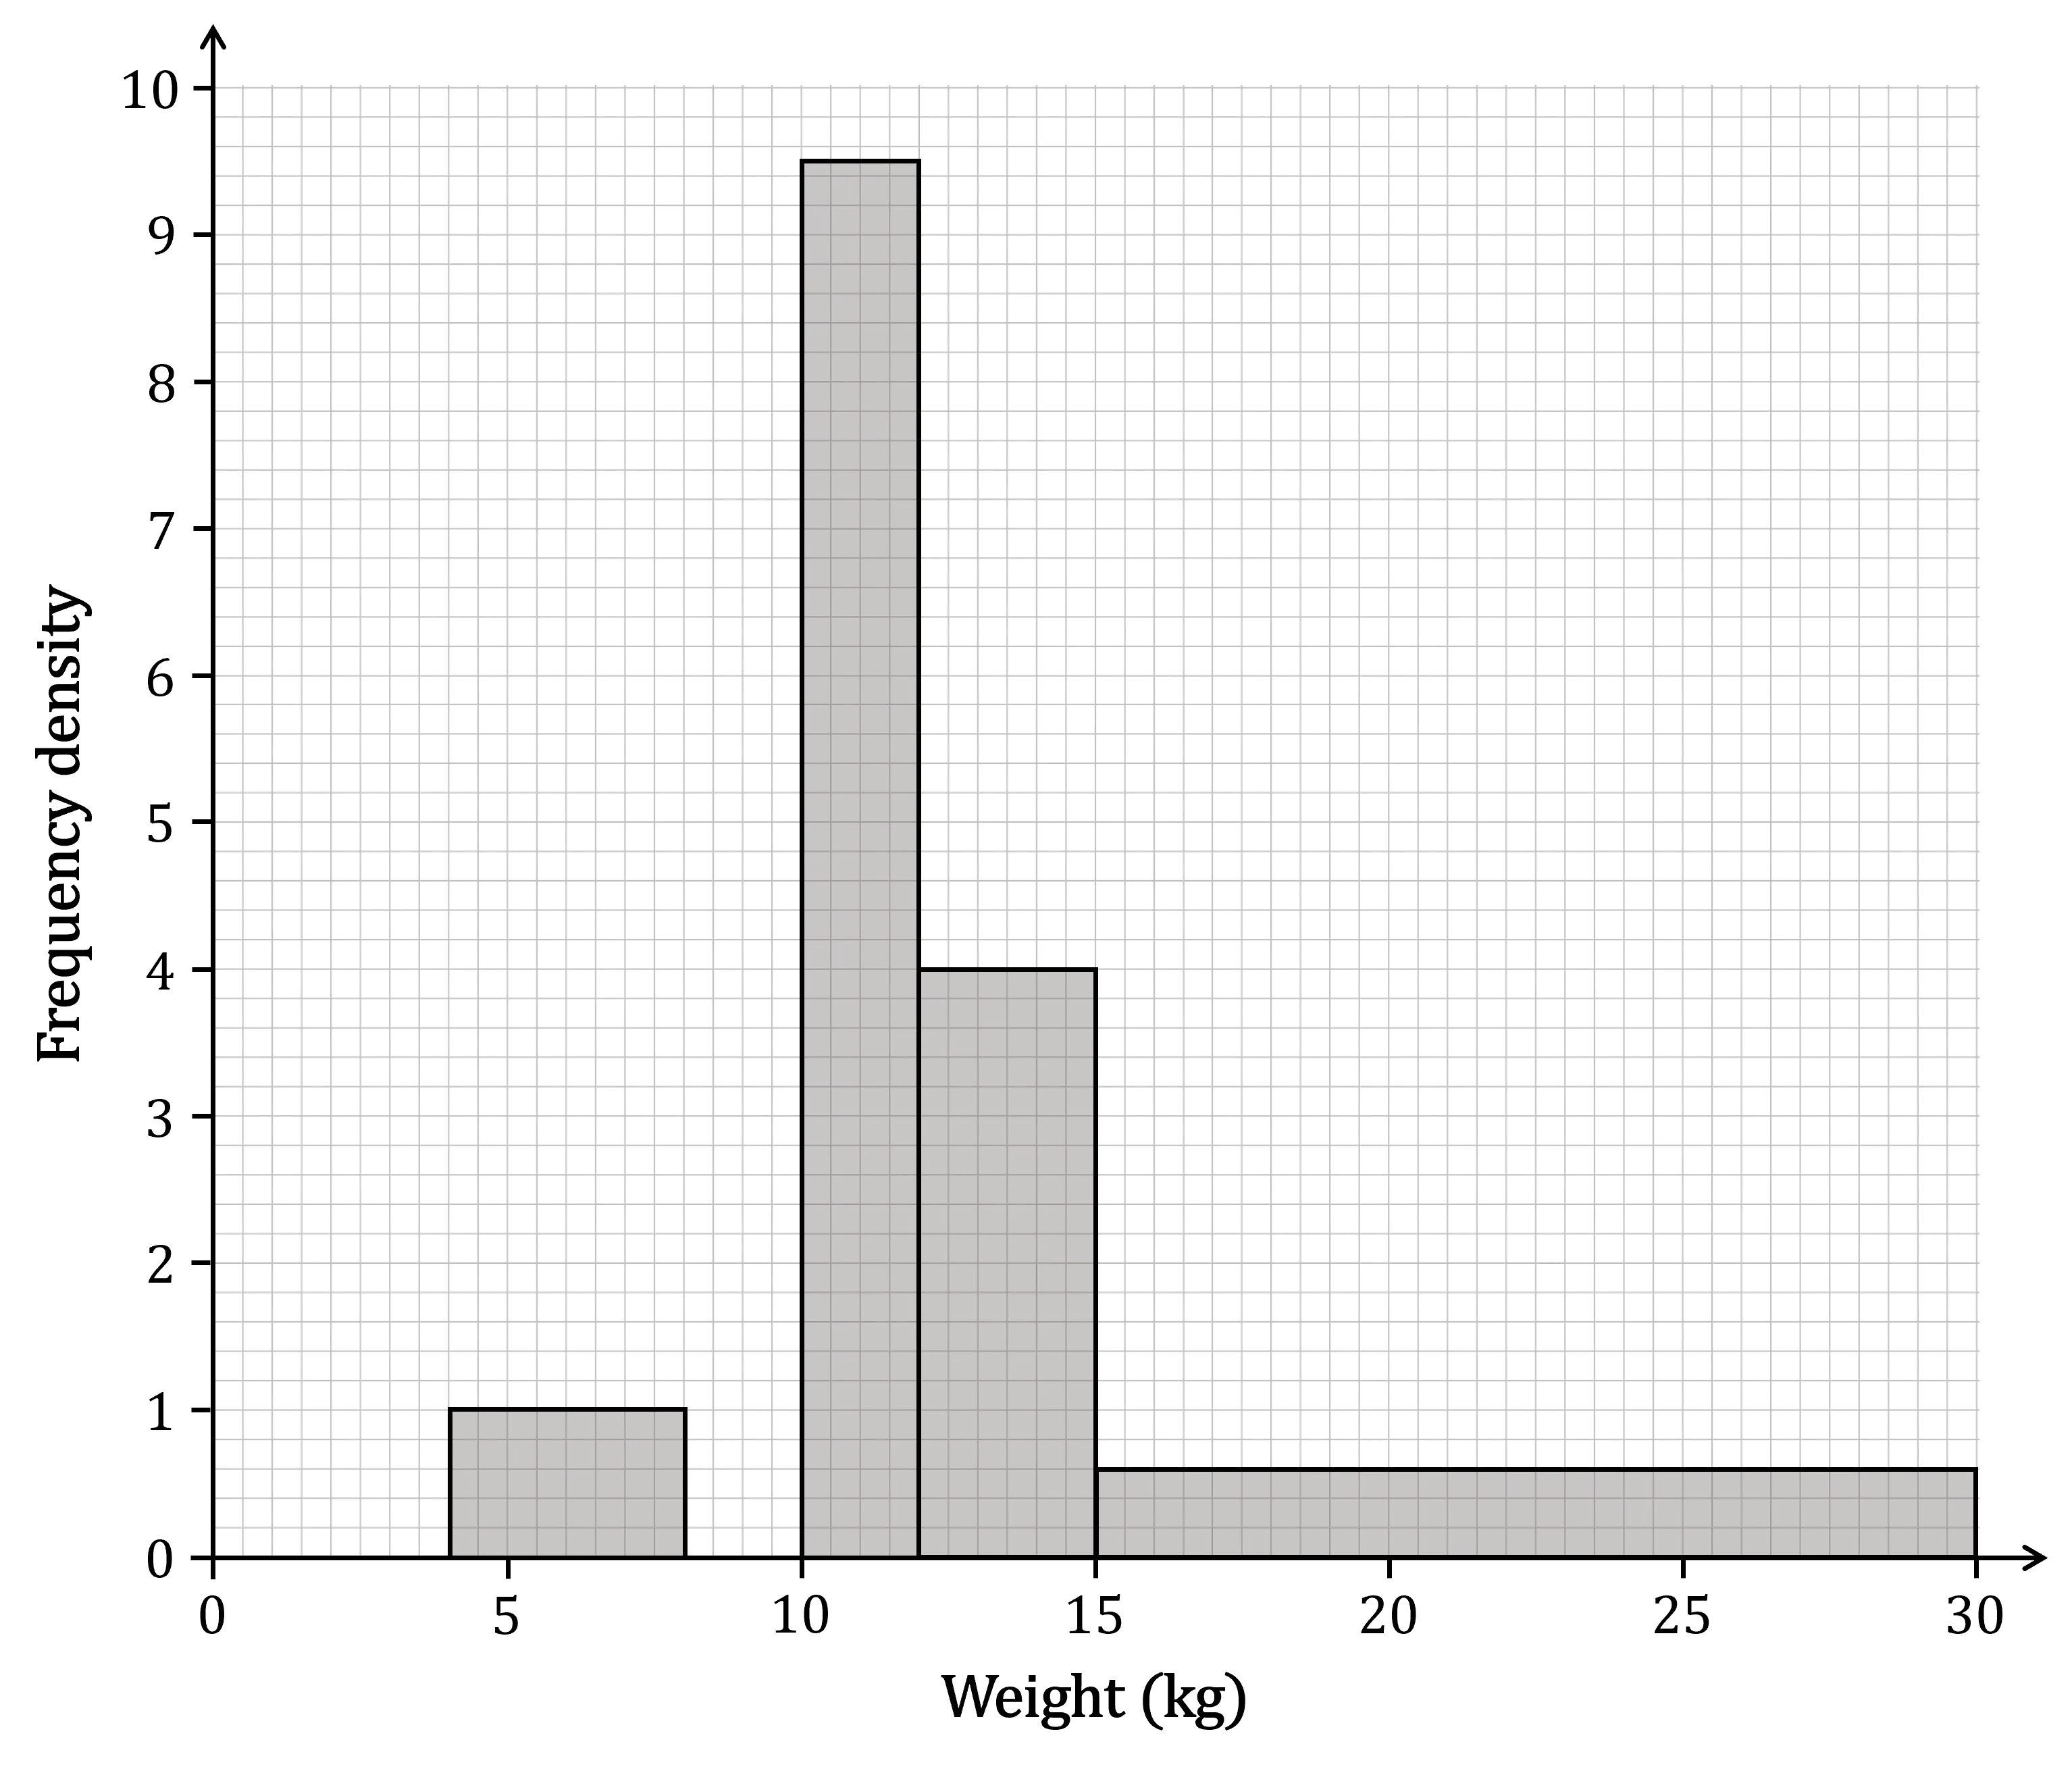
The table below and the corresponding histogram show the weight, in kg, of some newborn bottlenose dolphins.
Weight | Frequency |
4 ≤ w < 8 | 4 |
8 ≤ w < 10 | 16 |
10 ≤ w < 12 | 19 |
12 ≤ w < 15 | 12 |
15 ≤ w < 30 |
(a) Use the histogram to complete the table.
The frequency for the 15 ≤ w < 30 class interval is missing
The bar for that class interval on the histogram has a
height (frequency density) of 0.6
width of 30-15 = 15
Rearrange ![]() to get
to get
![]()
![]()
Weight | Frequency |
4 ≤ w < 8 | 4 |
8 ≤ w < 10 | 16 |
10 ≤ w < 12 | 19 |
12 ≤ w < 15 | 12 |
15 ≤ w < 30 | 9 |
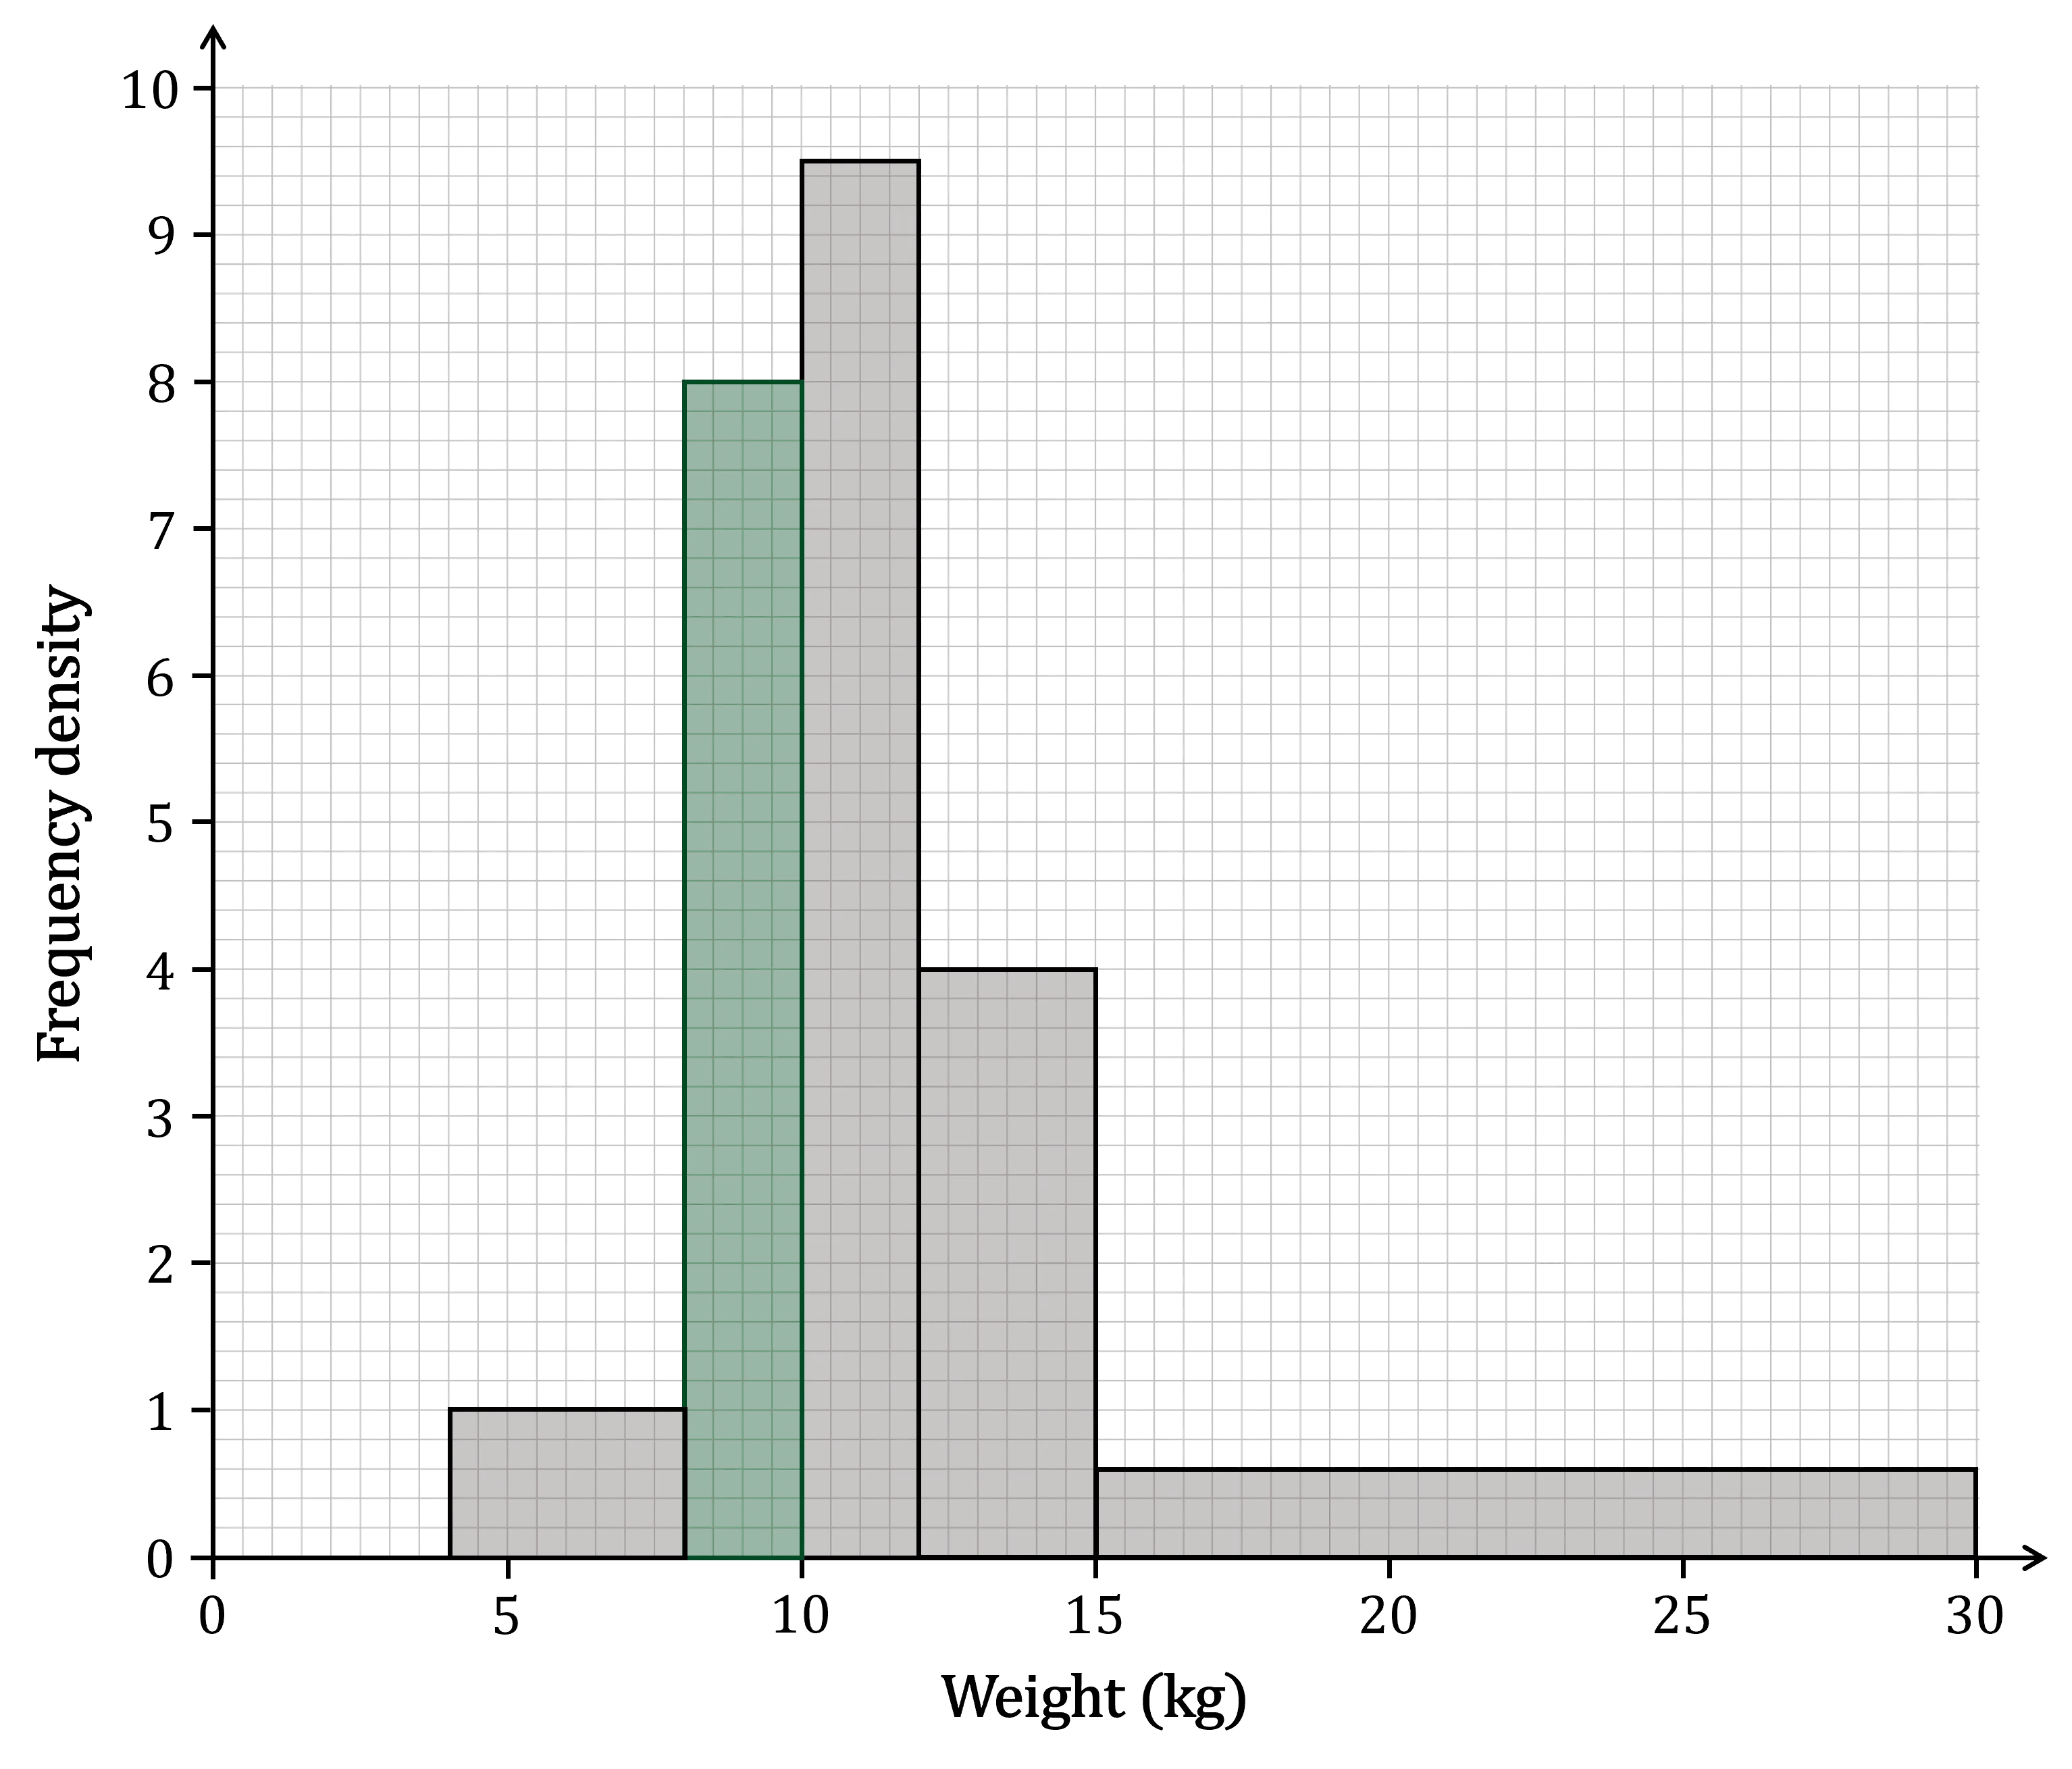
(b) Use the table to complete the histogram.
The bar for the 4 ≤ w < 8 class interval is missing
That class interval has a
frequency of 16
width of 10-8 = 2
Use ![]() to find the frequency density
to find the frequency density
![]()
Draw a bar with that height on the histogram, between 8 and 10 on the horizontal axis
(c) Estimate the number of dolphins whose weight is greater than 13 kg.
We know from part a) that there are 9 dolphins in the 15 ≤ w < 30 class interval
So we need to estimate the number of dolphins that are in the interval 13 ≤ w < 15
For 13 ≤ w < 15, the histogram shows that
the frequency density is 4
the width is 15-13 = 2

Now use ![]() to estimate the number of dolphins in the 13 ≤ w < 15 interval
to estimate the number of dolphins in the 13 ≤ w < 15 interval
(Note that using the histogram in this way is actually a form of linear interpolation)
![]()
This is only an estimate because we don't actually know that dolphins are evenly distributed across the entire 12 ≤ w < 15 class interval
Now the total number of dolphins with a weight greater than 13 kg can be estimated
![]()
There are approximately 17 dolphins with a weight greater than 13 kg

You've read 0 of your 5 free revision notes this week
Sign up now. It’s free!
Did this page help you?
