Speed-Time Graphs (Edexcel IGCSE Maths A (Modular)): Revision Note
Exam code: 4XMAF/4XMAH

Did this video help you?
Speed-time graphs
How do I use a speed-time graph?
Kinematics is the study of motion of objects
It looks at how an object moves over time
Speed-time graphs show the speed of an object at different times
Speed is on the vertical axis
Time is on the horizontal axis
The gradient of the graph is the acceleration
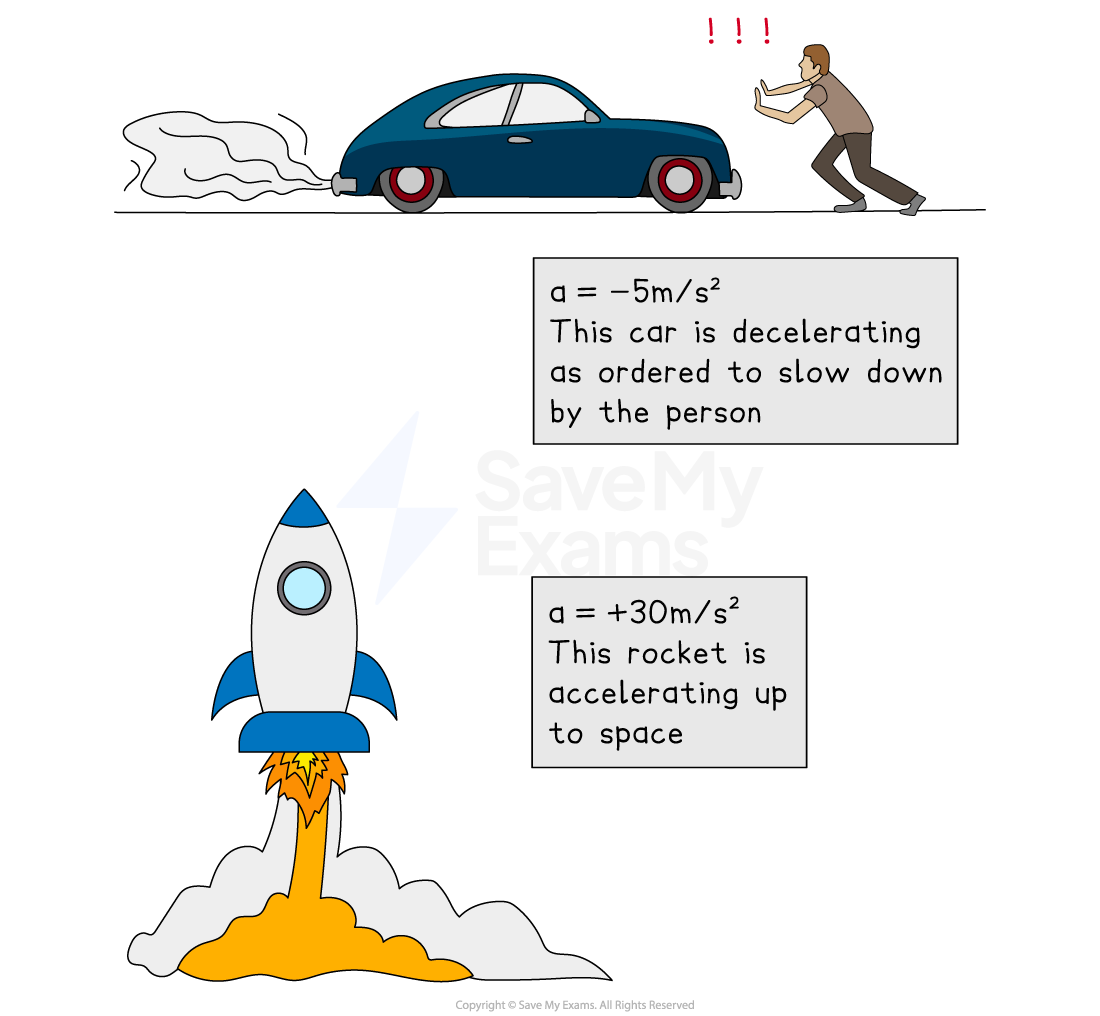
A positive gradient shows positive acceleration (speeding up)
A negative gradient shows negative acceleration, (slowing down)
This is also called deceleration
Horizontal lines indicate moving at a constant speed
The object is neither speeding up or slowing down
If the constant speed is zero, then it is at rest
A straight line shows constant acceleration
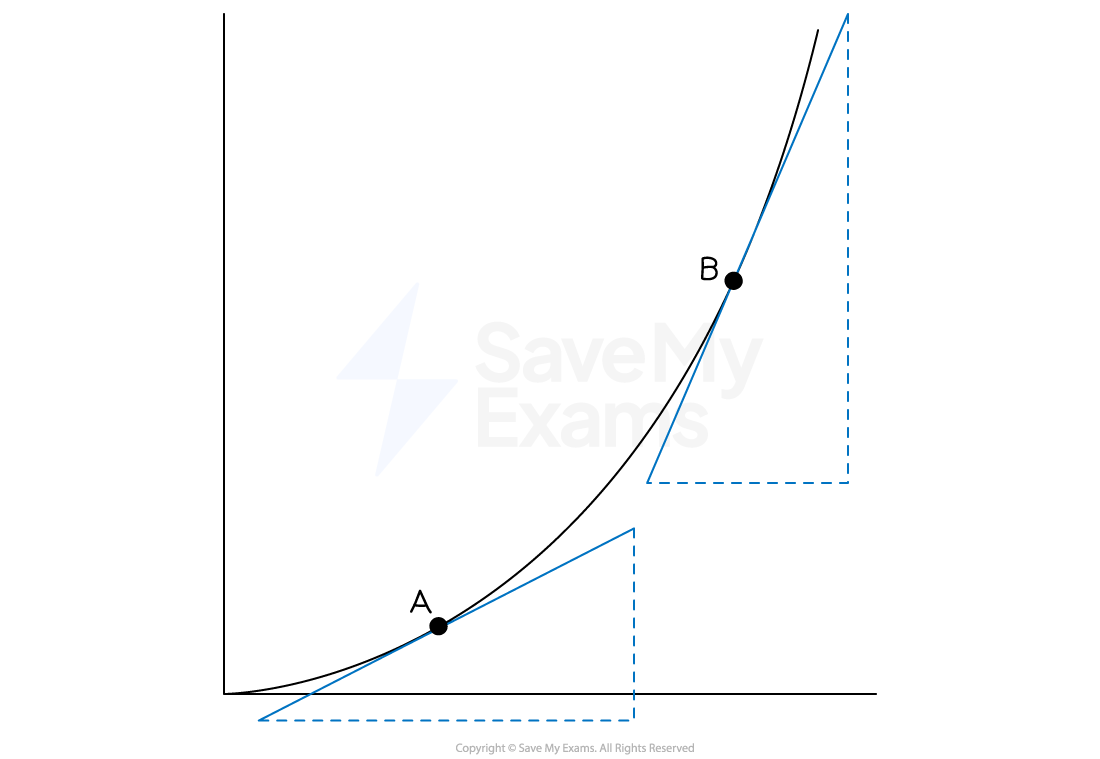
A curve shows changing acceleration
To find the acceleration at a particular point on the graph
draw a tangent to the graph at this point and find its gradient
The distance covered by the object is the area under the graph
Split the area into simple shapes, e.g. rectangles and triangles
Find the area of each shape and add them together
Examiner Tips and Tricks
Always check the vertical axis to see if you are given a speed-time graph or a distance-time graph!
Worked Example
The speed-time graph for a car travelling between two sets of traffic lights is shown below.
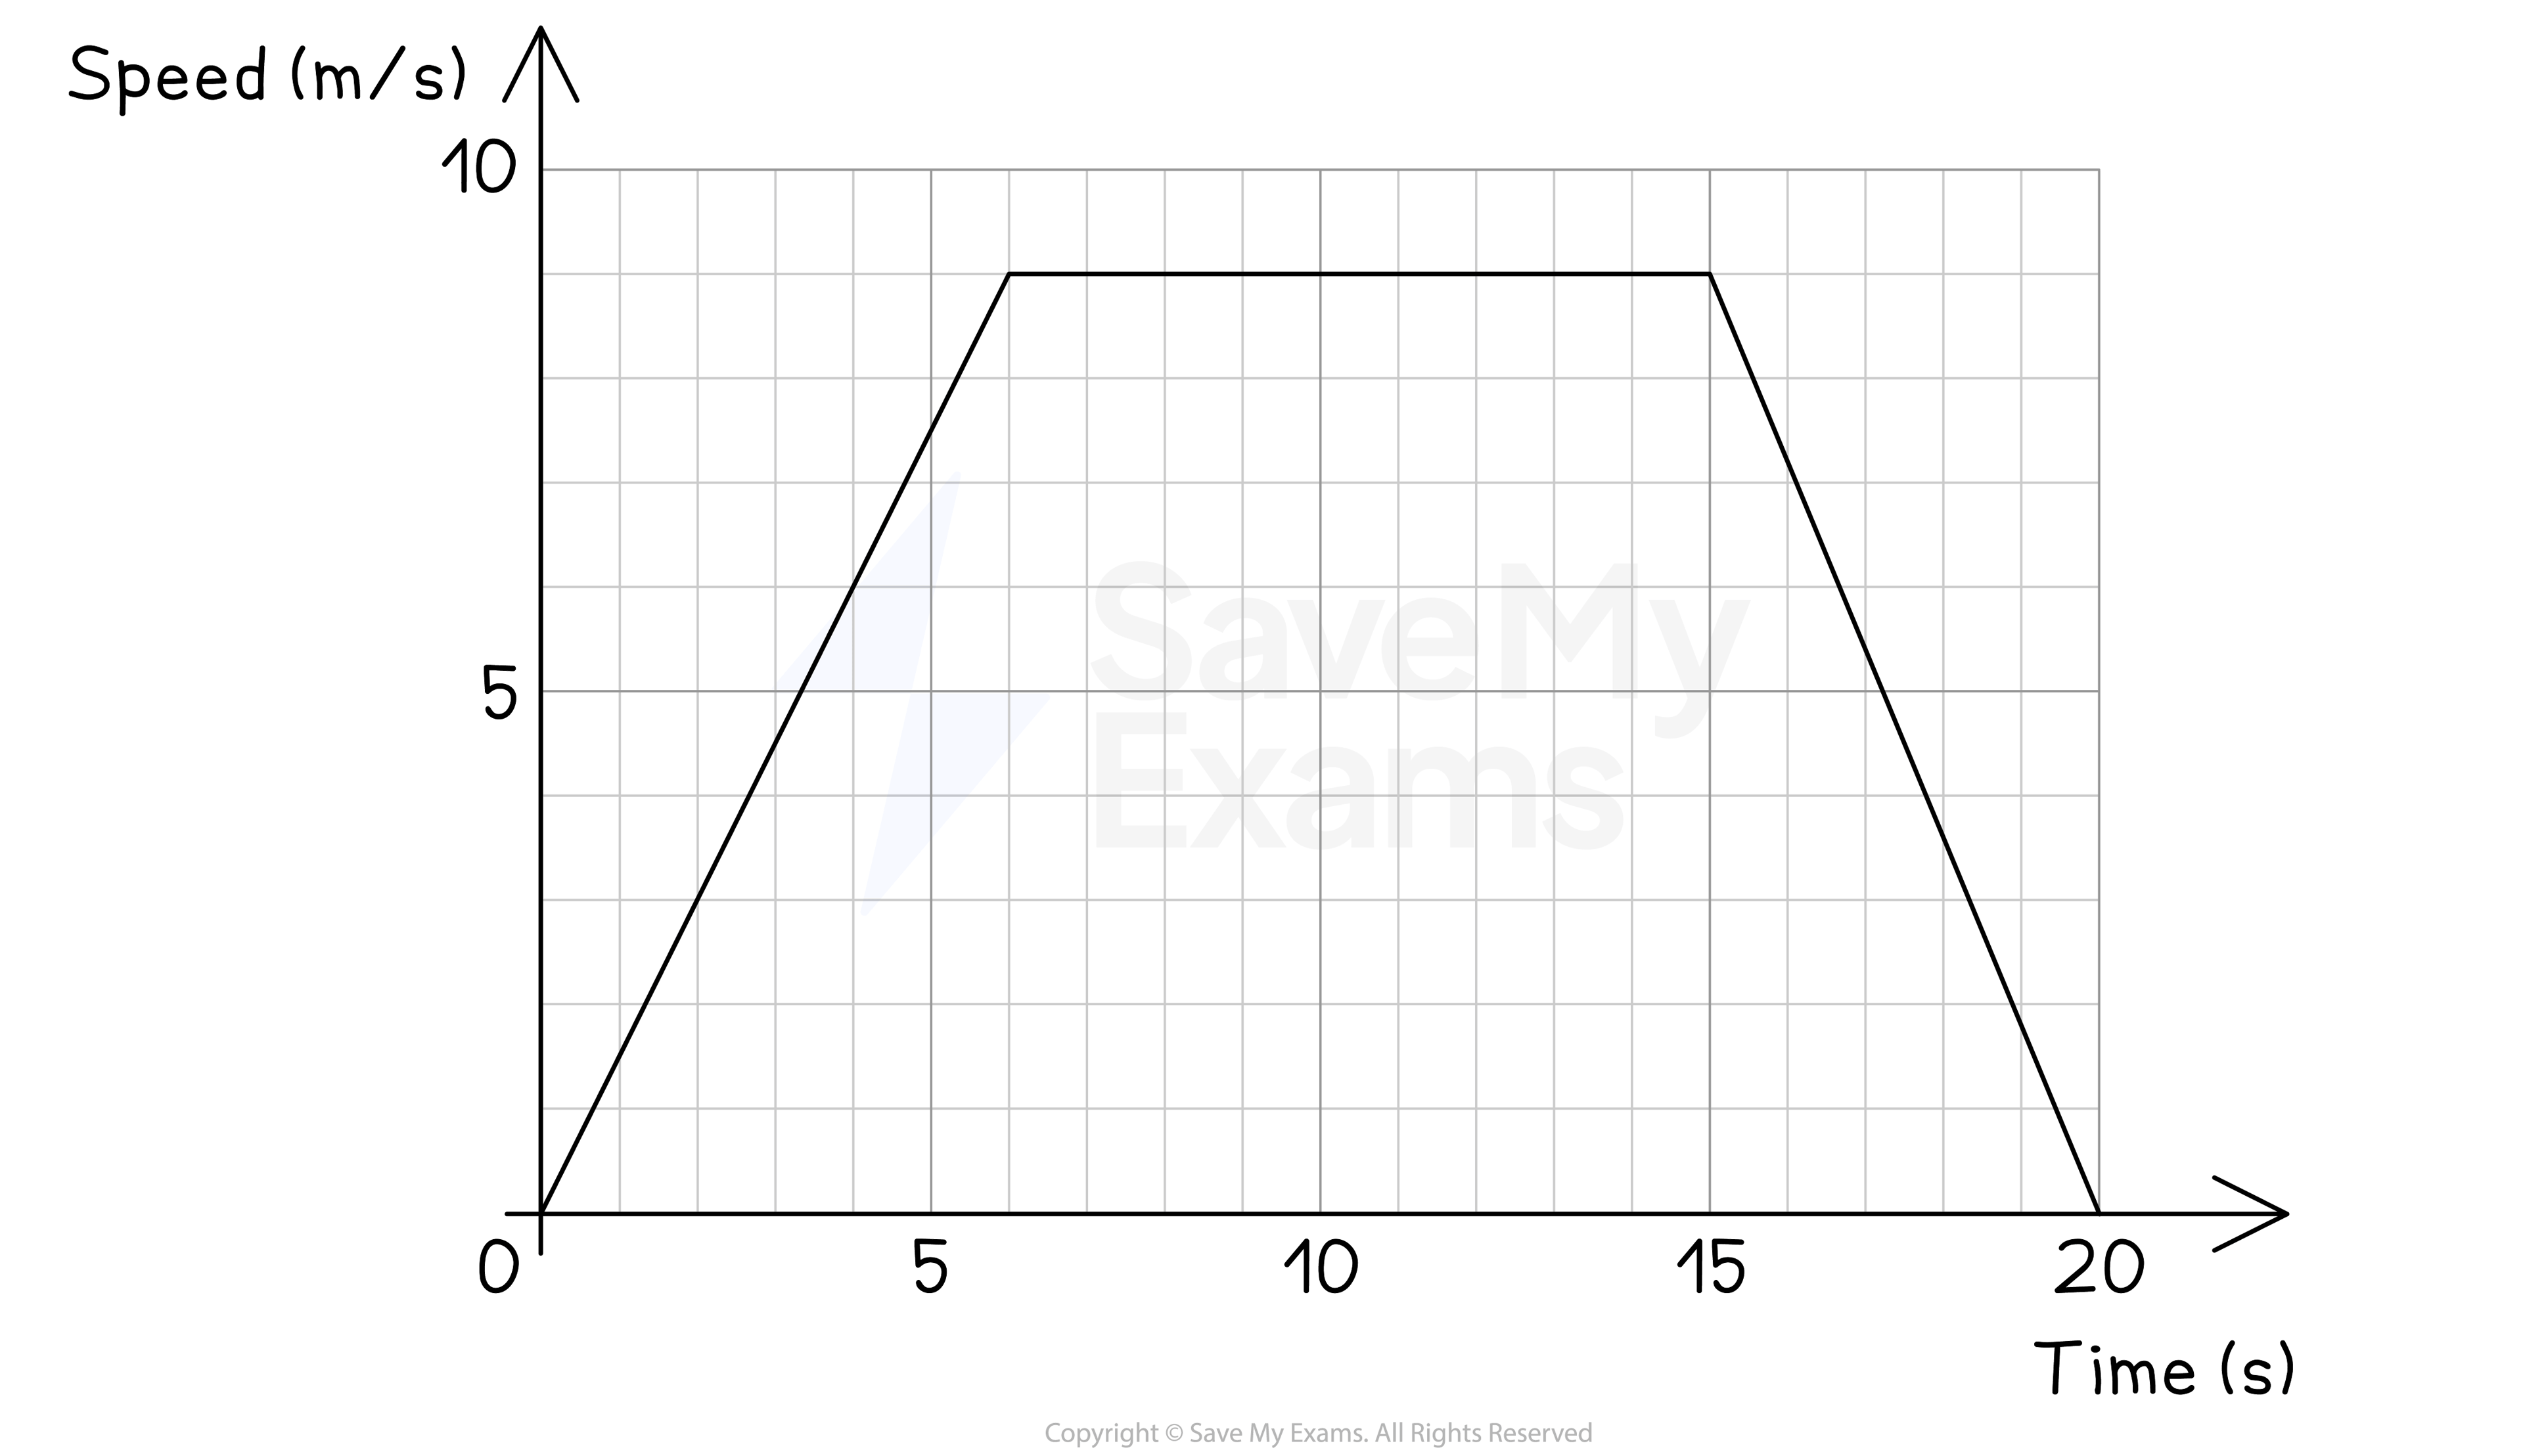
(a) For how long was the car travelling at a constant speed?
Answer:
Constant speed is represented by horizontal lines
There is a horizontal line from 6 seconds to 15 seconds
15 - 6 = 9
9 seconds
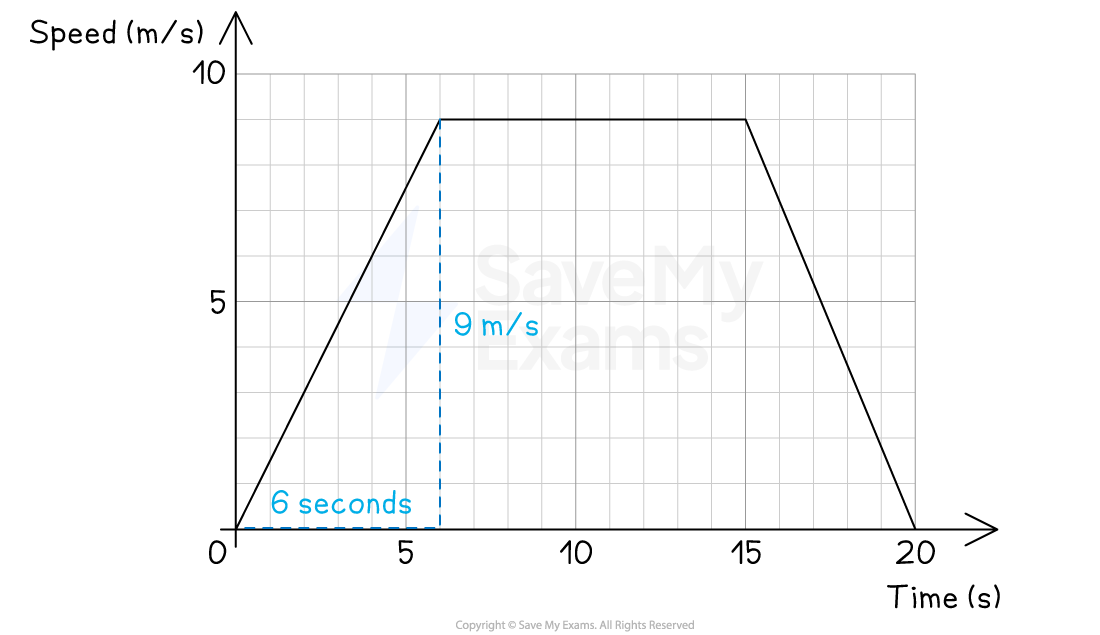
(b) Calculate the acceleration during the first 6 seconds.
Answer:
In a speed-time graph the acceleration is the gradient of the graph
![]()
![]()
Acceleration = 1.5 m/s2
(c) Work out the distance covered by the car.
Answer:
In a speed-time graph the distance travelled is equal to the area under the graph
The graph is a trapezium so use the formula ![]()
![]()
Distance travelled = 130.5 m

Unlock more, it's free!
Join the 100,000+ Students that ❤️ Save My Exams
the (exam) results speak for themselves:

Was this revision note helpful?
