Rates-of-Change Graphs (Edexcel IGCSE Maths A (Modular)) : Revision Note

Rates of Change of Graphs
What is a rate-of-change graph?
A rate-of-change graph usually shows how a variable changes with time
The following are examples of rates-of-change graphs:
Speed against time
Speed is the rate of change of distance as time increases
Acceleration against time
Acceleration is the rate of change of velocity as time increases
The depth of water against time (e.g. in a container as it is filled with water)
Can rates-of-change graphs not be against time?
More generally, rate-of-change graphs can show any two different variables plotted against each other, not just time
E.g. the volume of air inside an inflating balloon plotted against the balloon's radius
This shows the rate of change of volume as radius increases
E.g. the number of ice-creams sold plotted against the weather temperature
This shows the rate of change of number of ice-creams as temperature increases
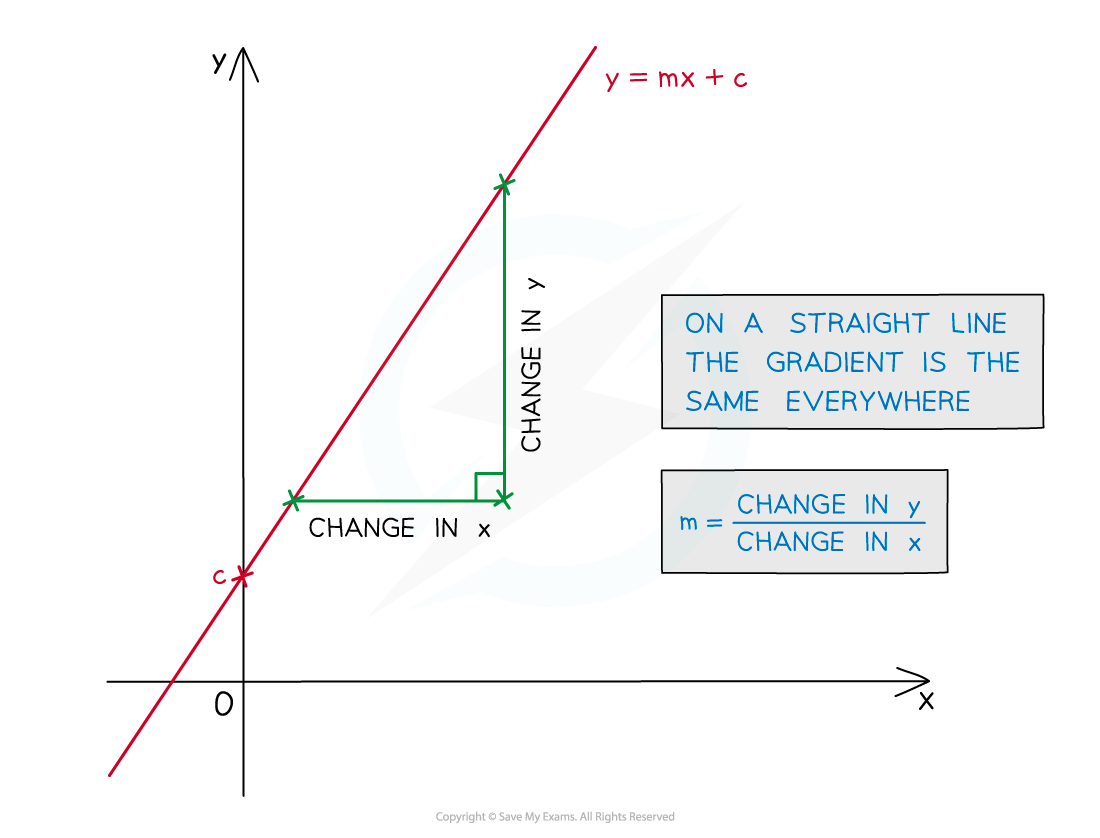
How can I use gradients to find rates of change?
The gradient of the graph of y against x represents:
the amount of change in y for every 1 unit of increase in the x-direction
This is the amount of y per unit of x
This is called the rate of change of y against x
The units of gradients are the units of the y-axis, divided by the units of the x-axis
E.g. If the graph shows volume in cm3 on the y-axis and time in seconds on the x-axis, the rate of change is measured in cm3/s (or cm3s-1)
If the graph is a straight line the rate of change is constant
If the graph is horizontal, the rate of change is zero
y is not changing as x changes
How can I use tangents to find rates of change?
If the graph is a curve, you can draw a tangent at a point on the graph and find its gradient
This will be an estimate of the rate of change of y against x
The rate of change is greater when the graph is steeper
In the below image
tangents drawn at points A and B show the graph is steeper at B
therefore the rate of change at B is greater

On a distance-time graph, a tangent at a point on the curve can be used to estimate the velocity at that particular time
On a speed-time graph, a tangent at a point on the curve can be used to estimate the acceleration at that particular time
Examiner Tips and Tricks
The units of the gradient can help you understand what is happening in the context of an exam question
For example, if the y-axis is in dollars and the x-axis is in hours, the gradient represents the change in dollars per hour
Worked Example
(a) Each of the graphs below show the depth of water, d cm, in different containers that are being filled from a running tap of water.
Match each of the graphs 1, 2, 3, 4 with the containers A, B, C, D.
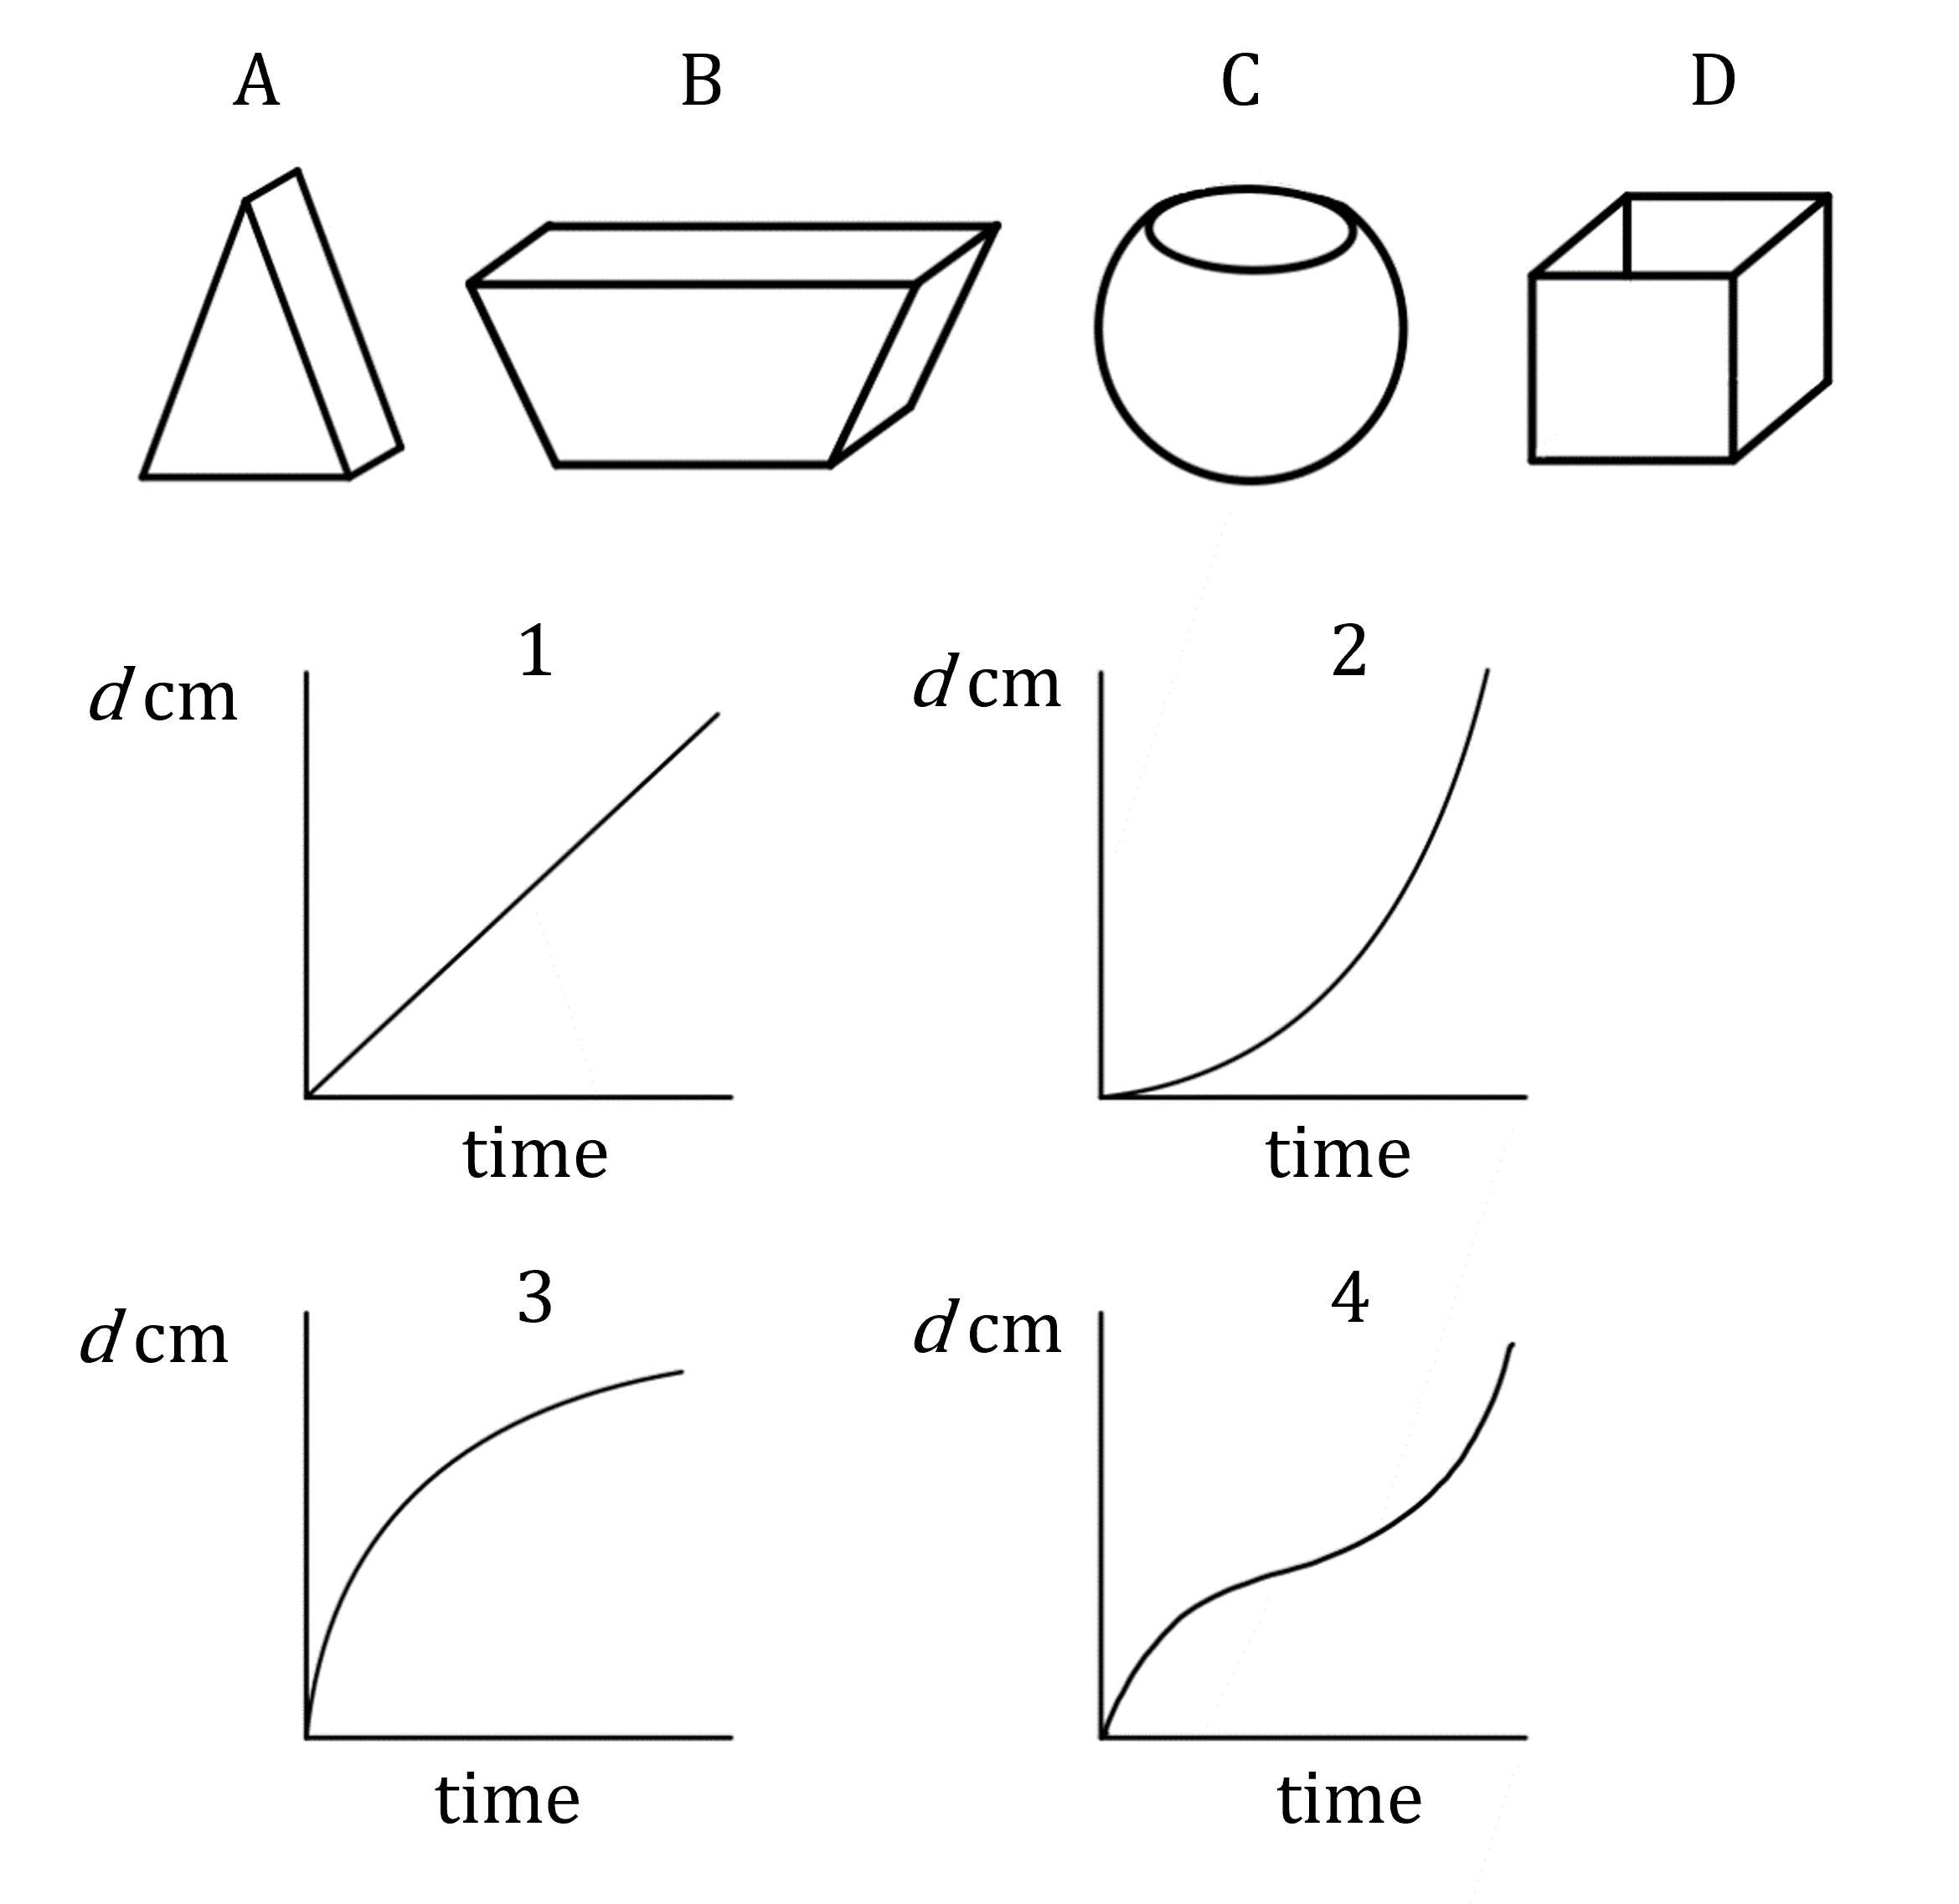
Considering graph 1: the gradient is constant
This means the rate of change is constant
So the depth increases at the same rate throughout
This matches container D which has vertical sides, so depth increases uniformly
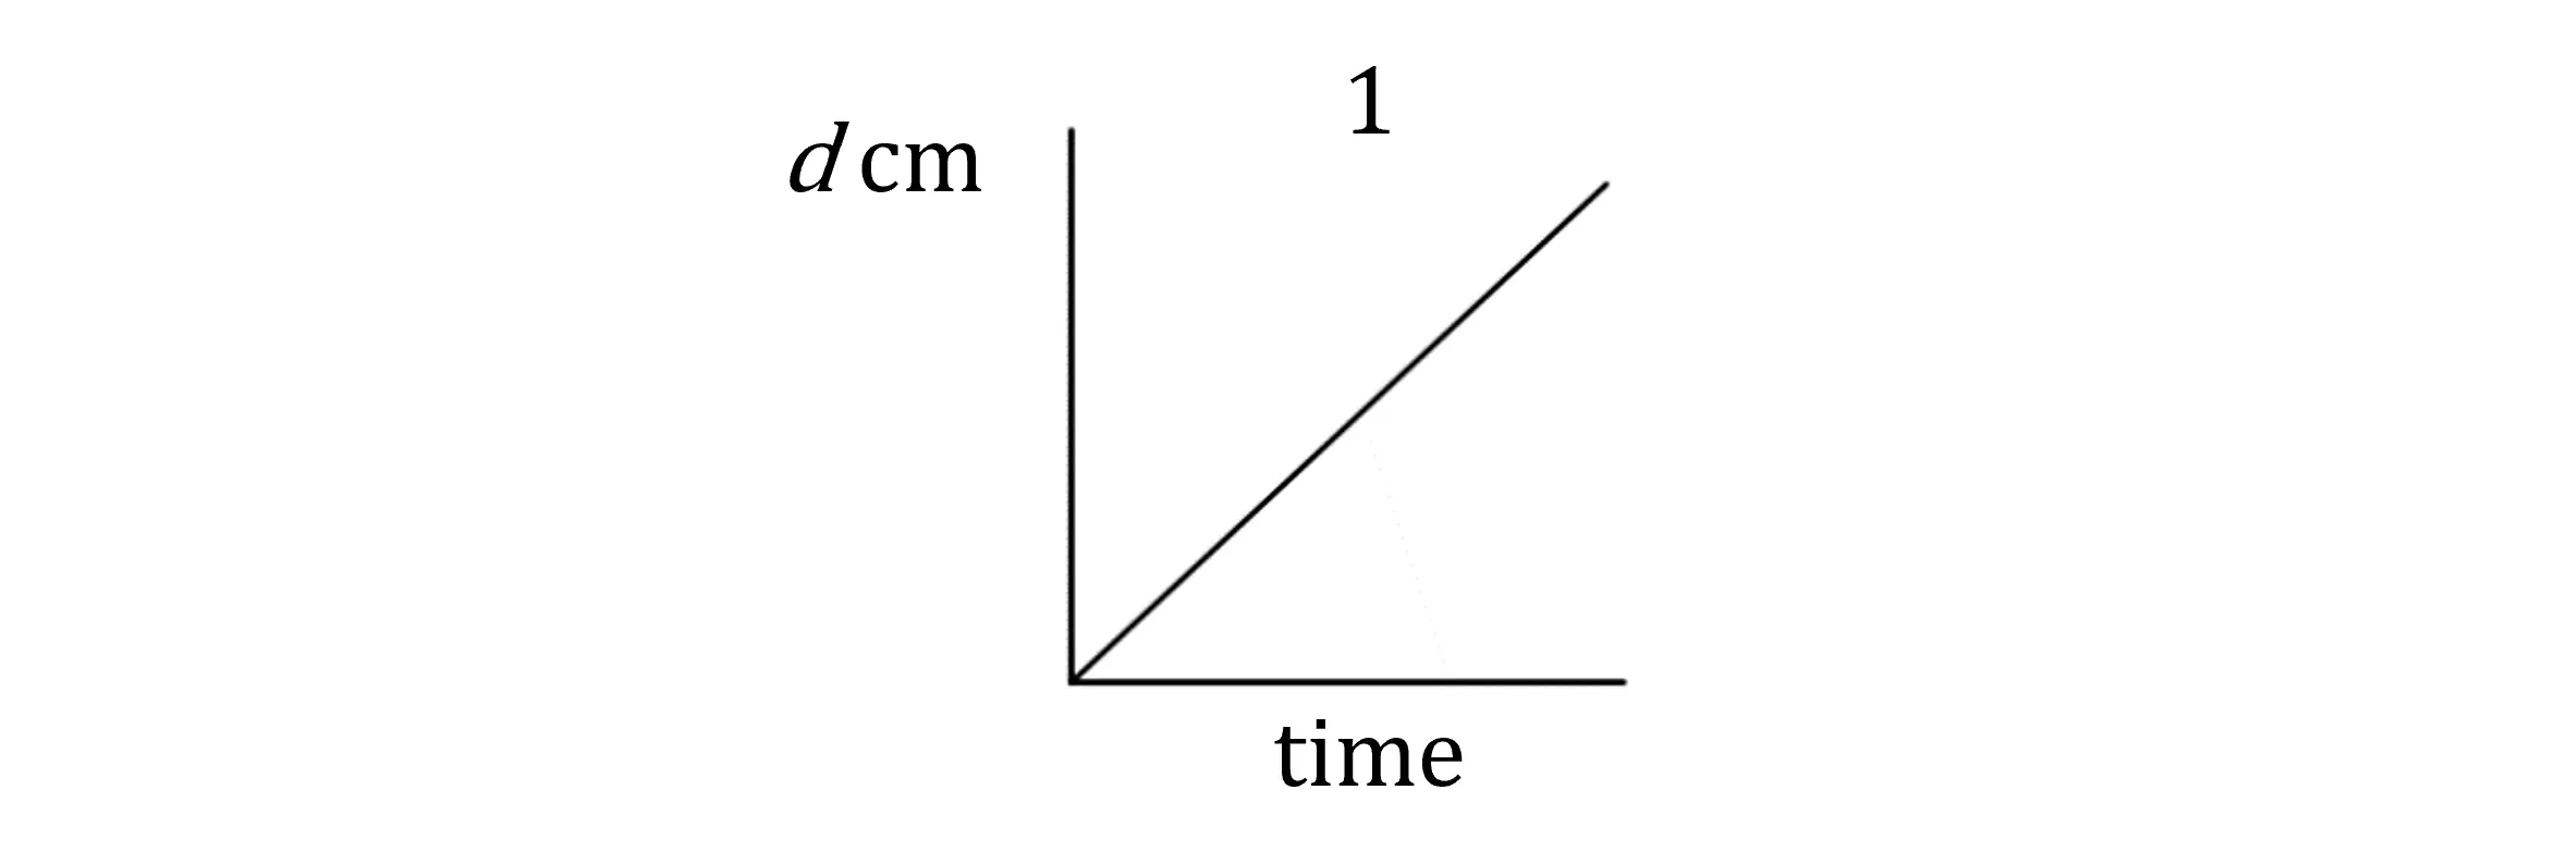
Graph 1 is container D
Considering graph 2: the gradient starts shallow and becomes steeper, meaning that the depth increases faster and faster at the end
This matches container A, which gets narrower towards the top, causing the depth to increase faster at the end

Graph 2 is container A
Considering graph 3: the gradient starts steep and becomes shallower, meaning that the depth increases at a slower and slower rate as time increases
This matches container B, which gets wider towards the top, causing the depth to increase more slowly at the end
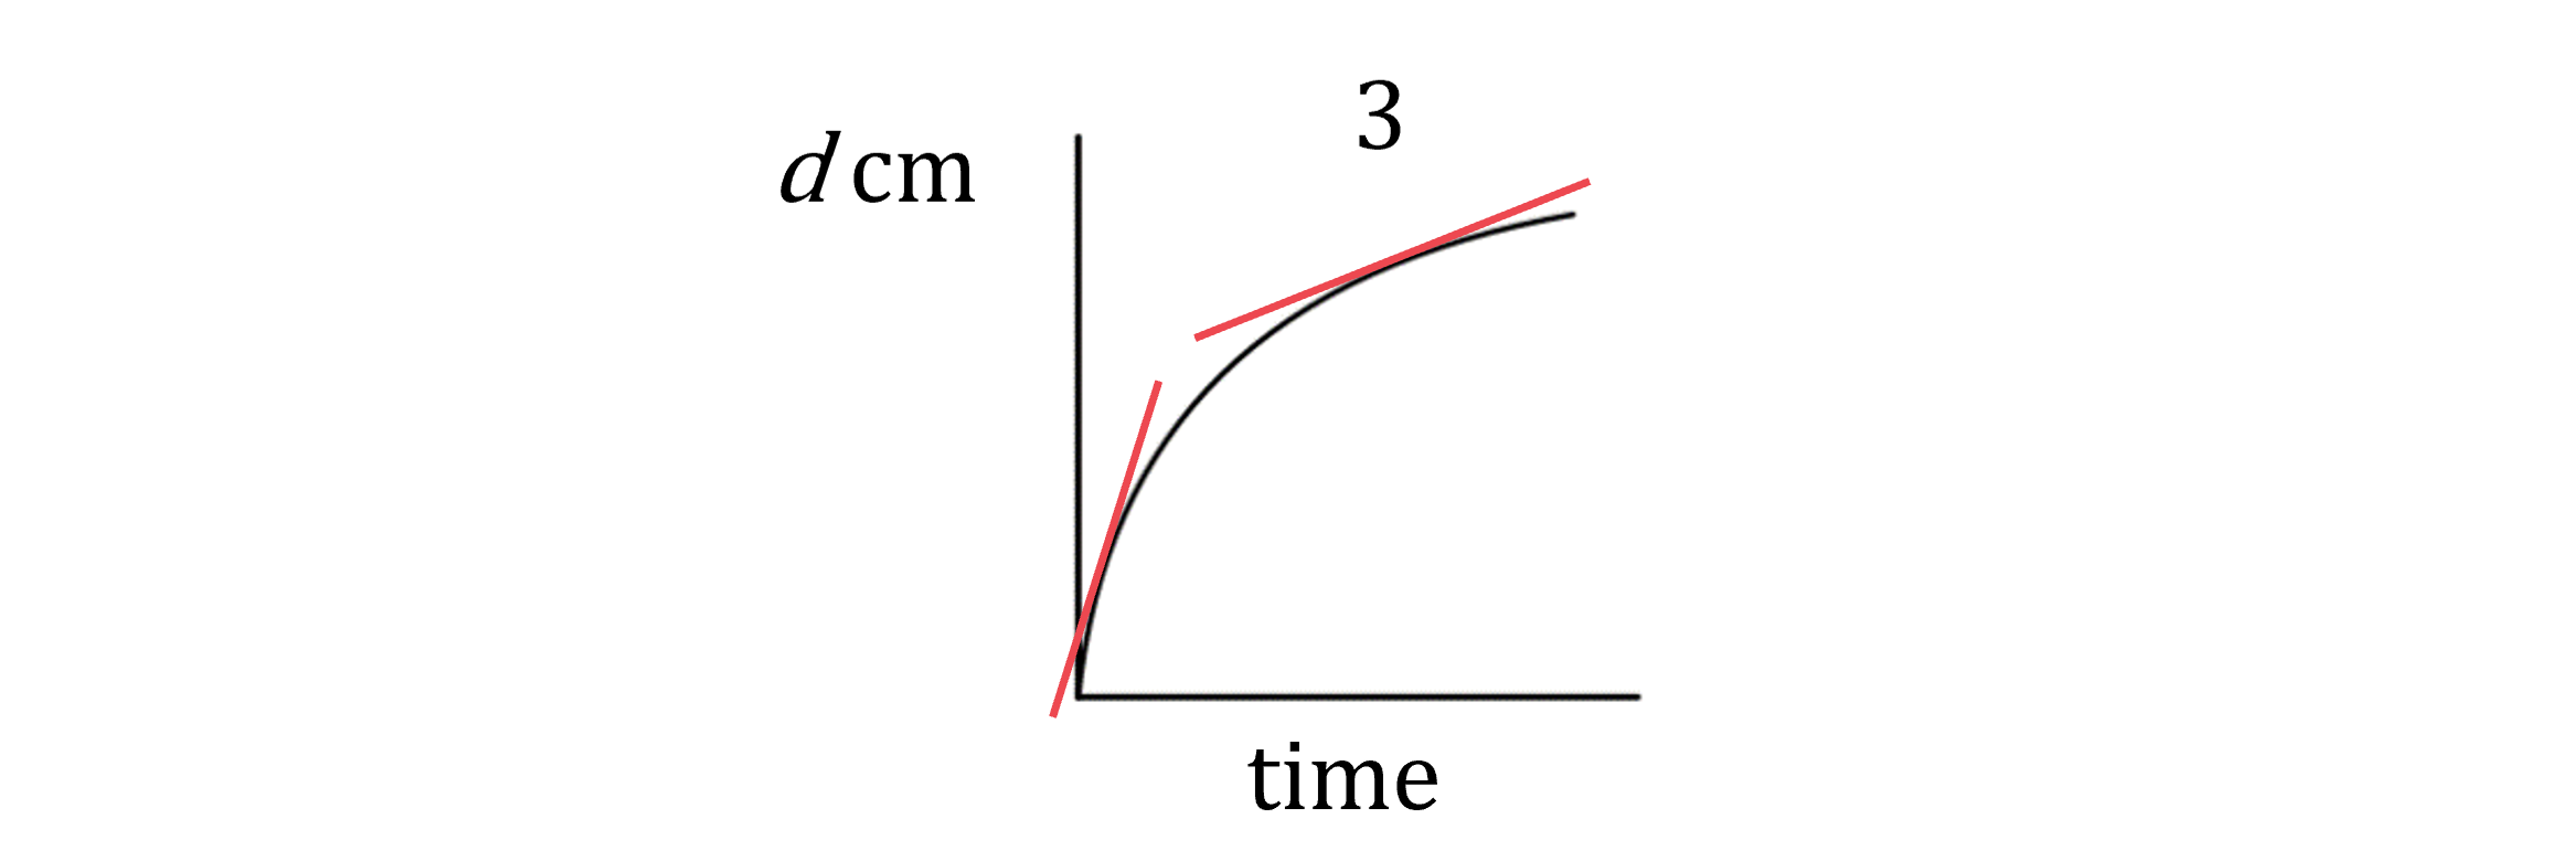
Graph 3 is container B
Considering graph 4: the gradient starts steep, then becomes shallow, then becomes steep again. This means that the depth increases quickly, then slowly, then quickly again
This matches container C, which is narrow at the bottom (fast depth increase), gets wider in the middle (slower depth increase) and narrow again at the top (faster depth increase)
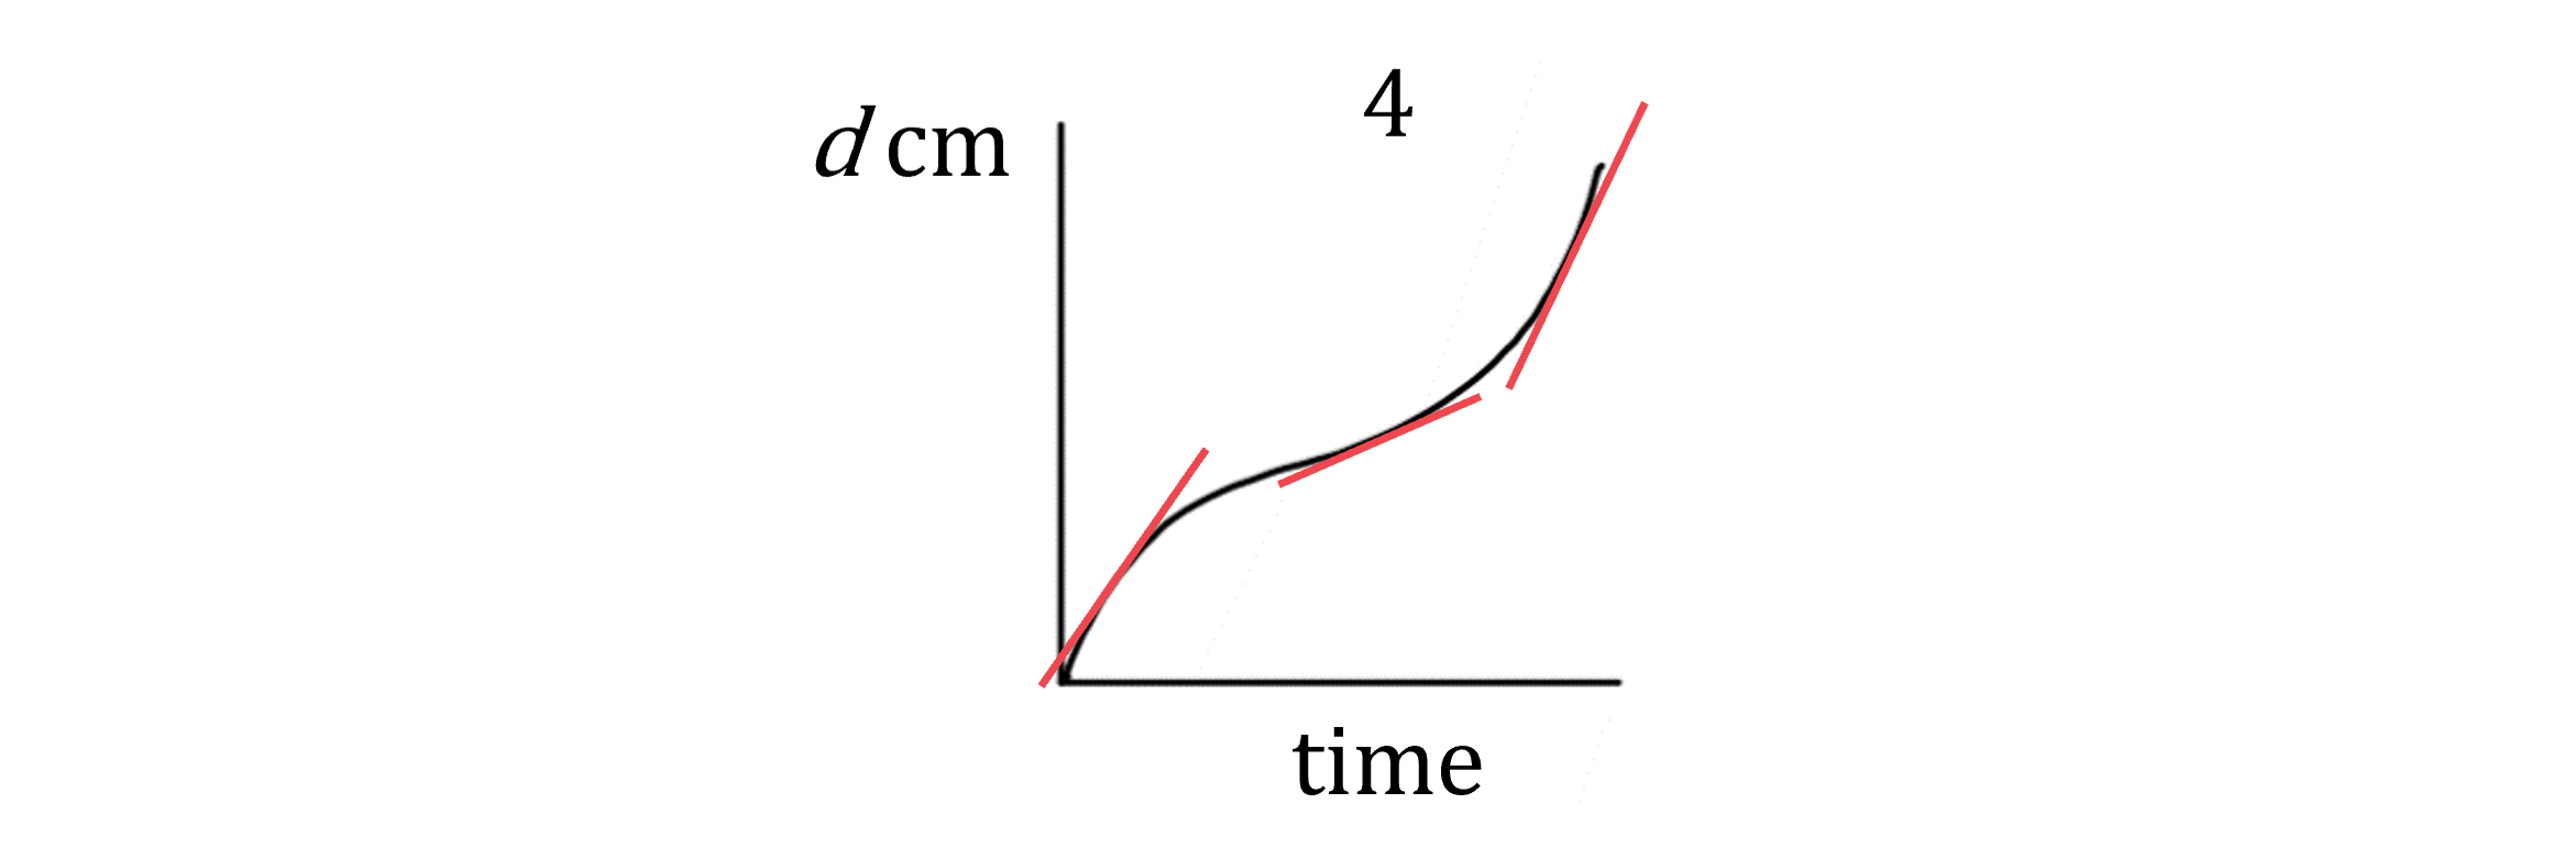
Graph 4 is container C
(b) The graph below shows a model of the volume, v litres, of diesel fuel in the tank of George’s truck after it has travelled a distance of d kilometres.
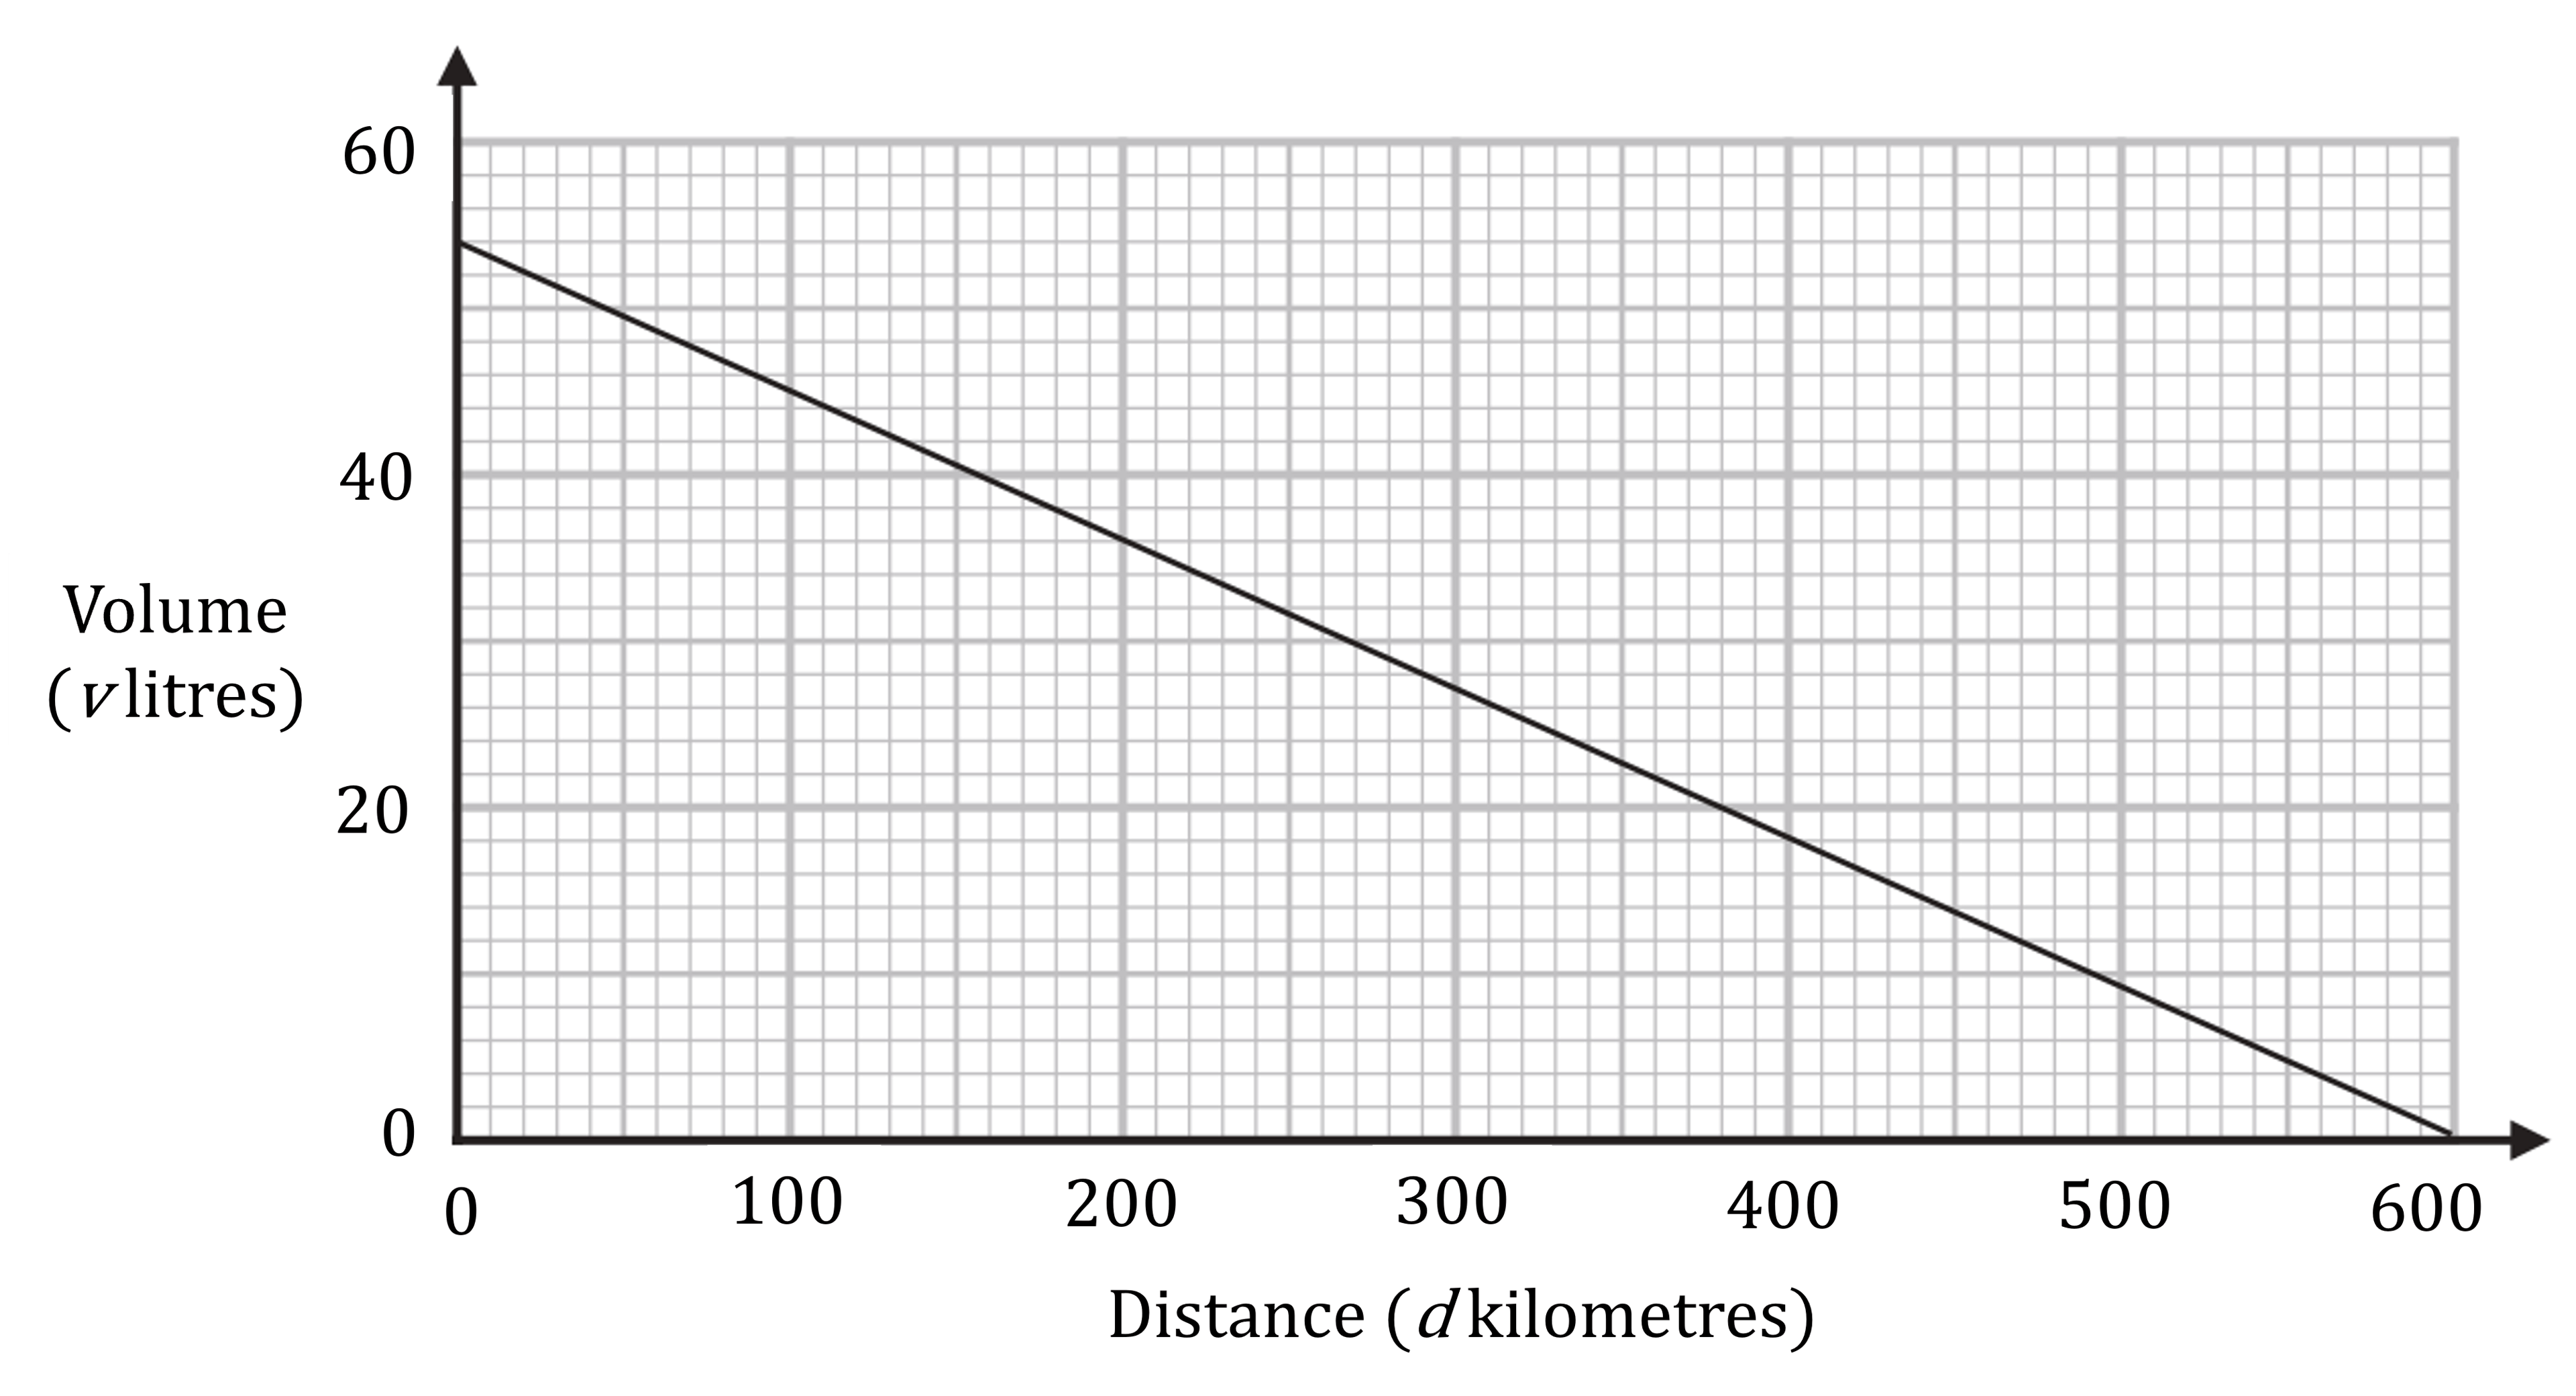
(i) Find the gradient of the graph, stating its units clearly.
![]()
![]()
-0.09 litres per kilometre
(ii) Interpret what the gradient of this graph represents.
Consider the units of the gradient: litres per kilometre
An increase in 1 kilometres causes a decreases of 0.09 litres in diesel fuel
The gradient represents the amount of diesel fuel used to travel one kilometre
Travelling 1 km uses up 0.09 litres of diesel fuel
(iii) Give one reason why this model may not be realistic.
Fuel may not be consumed at a constant rate
(The rate may vary as the driver accelerates)
(The rate may be different at the beginning when the truck weighs more)

You've read 0 of your 5 free revision notes this week
Sign up now. It’s free!
Did this page help you?
