Trigonometric Graphs (Edexcel IGCSE Maths A (Modular)) : Revision Note

Did this video help you?
Drawing Trig Graphs
What are trig graphs?
Trigonometric (trig) graphs are the graphs of
The variable
 is like an angle
but the angle can now go beyond acute to become obtuse and reflex
Trig graphs have repeating (periodic) shapes and symmetries that you need to know
How do I draw the graph of y = sin x?
The graph of
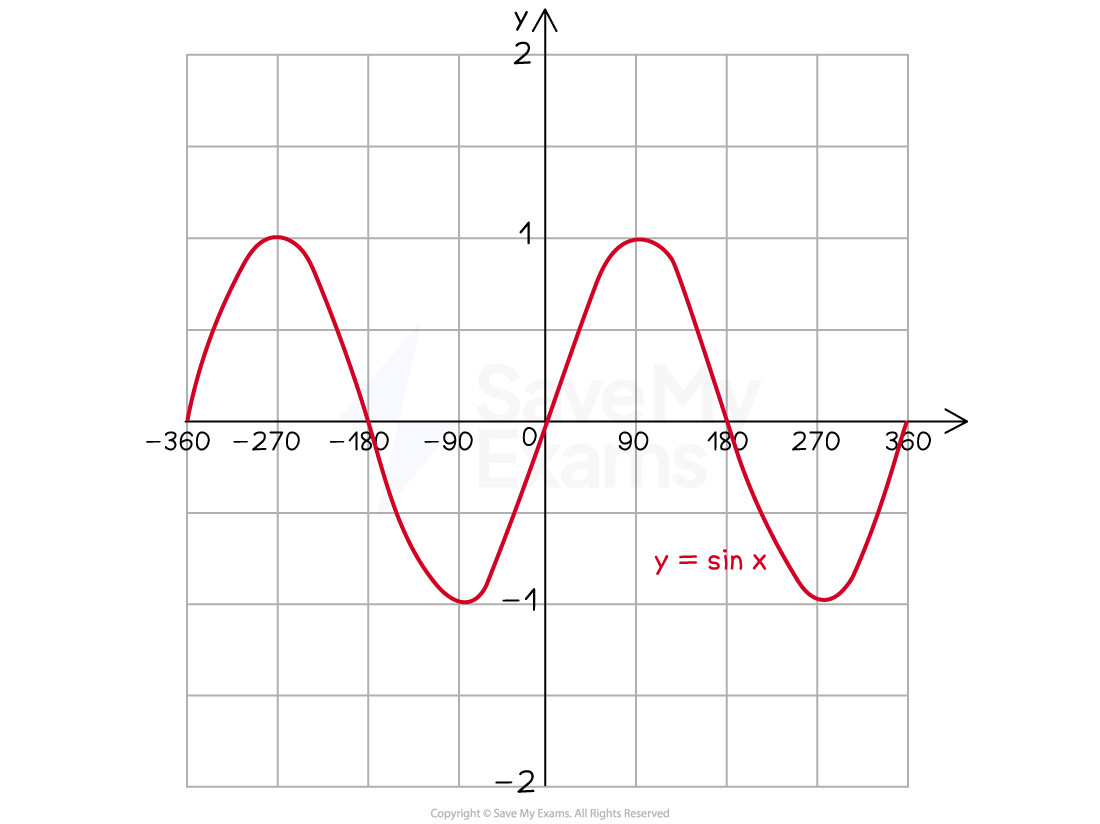
format('truetype')%3Bfont-weight%3Anormal%3Bfont-style%3Anormal%3B%7Dtext%7Bfill%3A%23000000%3B%3C%2Fstyle%3E%3C%2Fdefs%3E%3Ctext%20font-family%3D%22Times%20New%20Roman%22%20font-size%3D%2218%22%20font-style%3D%22italic%22%20text-anchor%3D%22middle%22%20x%3D%224.5%22%20y%3D%2216%22%3Ey%3C%2Ftext%3E%3Ctext%20font-family%3D%22math17f39f8317fbdb1988ef4c628eb%22%20font-size%3D%2216%22%20text-anchor%3D%22middle%22%20x%3D%2218.5%22%20y%3D%2216%22%3E%3D%3C%2Ftext%3E%3Ctext%20font-family%3D%22Times%20New%20Roman%22%20font-size%3D%2218%22%20text-anchor%3D%22middle%22%20x%3D%2237.5%22%20y%3D%2216%22%3Esin%3C%2Ftext%3E%3Ctext%20font-family%3D%22Times%20New%20Roman%22%20font-size%3D%2218%22%20font-style%3D%22italic%22%20text-anchor%3D%22middle%22%20x%3D%2256.5%22%20y%3D%2216%22%3Ex%3C%2Ftext%3E%3C%2Fsvg%3E) is a wave that oscillates between heights of 1 and -1 and repeats every 360° (its period is 360°)
is a wave that oscillates between heights of 1 and -1 and repeats every 360° (its period is 360°)It goes through the origin, (0, 0)
Then every 90° it cycles through the heights 1, 0, -1, 0, ...
How do I draw the graph of y = cos x?
The graph of
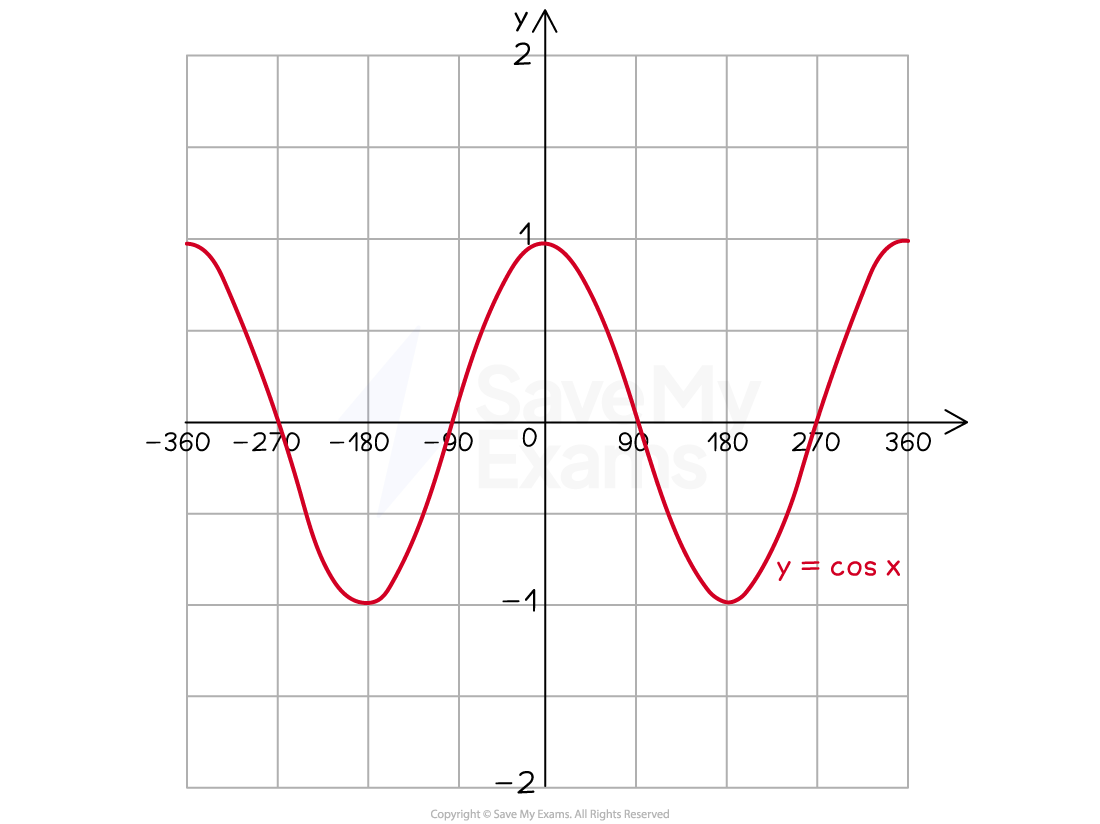
format('truetype')%3Bfont-weight%3Anormal%3Bfont-style%3Anormal%3B%7D%3C%2Fstyle%3E%3C%2Fdefs%3E%3Ctext%20font-family%3D%22Times%20New%20Roman%22%20font-size%3D%2218%22%20font-style%3D%22italic%22%20text-anchor%3D%22middle%22%20x%3D%224.5%22%20y%3D%2216%22%3Ey%3C%2Ftext%3E%3Ctext%20font-family%3D%22math17f39f8317fbdb1988ef4c628eb%22%20font-size%3D%2216%22%20text-anchor%3D%22middle%22%20x%3D%2218.5%22%20y%3D%2216%22%3E%3D%3C%2Ftext%3E%3Ctext%20font-family%3D%22Times%20New%20Roman%22%20font-size%3D%2218%22%20text-anchor%3D%22middle%22%20x%3D%2239.5%22%20y%3D%2216%22%3Ecos%3C%2Ftext%3E%3Ctext%20font-family%3D%22Times%20New%20Roman%22%20font-size%3D%2218%22%20font-style%3D%22italic%22%20text-anchor%3D%22middle%22%20x%3D%2259.5%22%20y%3D%2216%22%3Ex%3C%2Ftext%3E%3C%2Fsvg%3E) is a wave that oscillates between heights of 1 and -1 and repeats every 360° (its period is 360°)
is a wave that oscillates between heights of 1 and -1 and repeats every 360° (its period is 360°)It has a y-intercept of 1, coordinates (0, 1)
Then every 90° it cycles through the heights 0, -1, 0, 1, ...
- is the same as translating by 90 to the left
How do I draw the graph of y = tan x?
The graph of
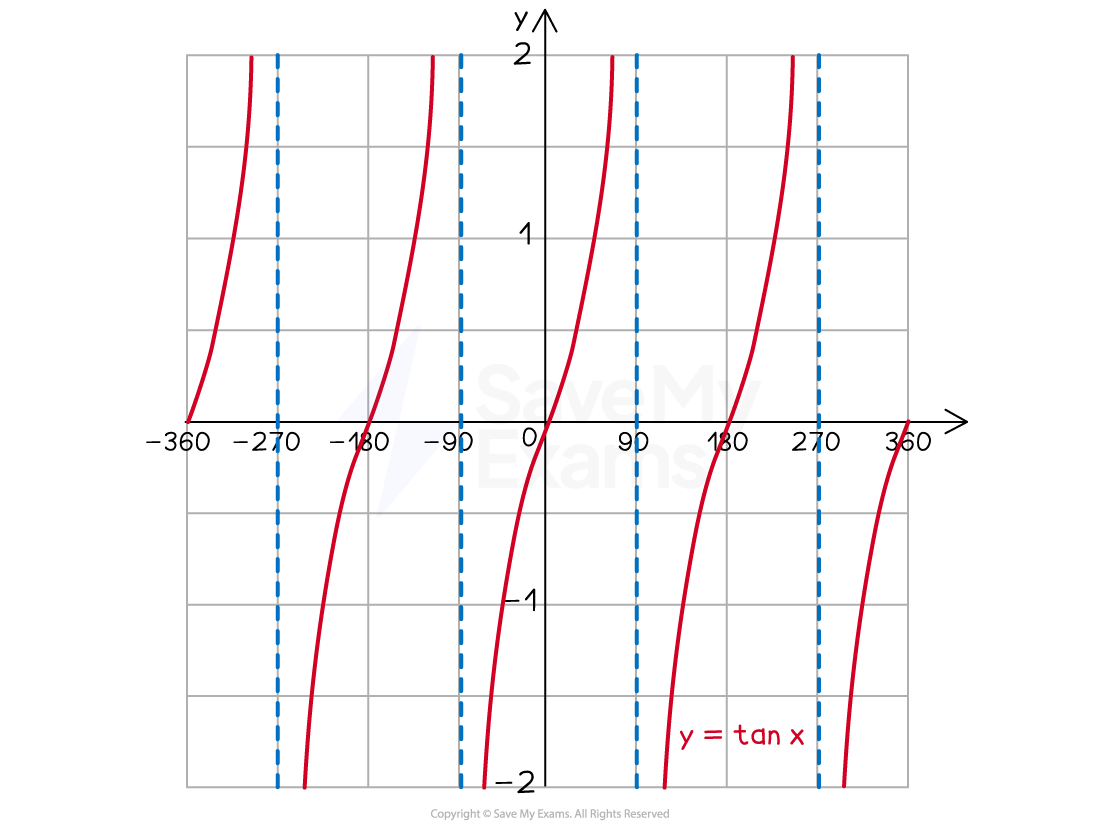
format('truetype')%3Bfont-weight%3Anormal%3Bfont-style%3Anormal%3B%7D%3C%2Fstyle%3E%3C%2Fdefs%3E%3Ctext%20font-family%3D%22Times%20New%20Roman%22%20font-size%3D%2218%22%20font-style%3D%22italic%22%20text-anchor%3D%22middle%22%20x%3D%224.5%22%20y%3D%2216%22%3Ey%3C%2Ftext%3E%3Ctext%20font-family%3D%22math17f39f8317fbdb1988ef4c628eb%22%20font-size%3D%2216%22%20text-anchor%3D%22middle%22%20x%3D%2218.5%22%20y%3D%2216%22%3E%3D%3C%2Ftext%3E%3Ctext%20font-family%3D%22Times%20New%20Roman%22%20font-size%3D%2218%22%20text-anchor%3D%22middle%22%20x%3D%2238.5%22%20y%3D%2216%22%3Etan%3C%2Ftext%3E%3Ctext%20font-family%3D%22Times%20New%20Roman%22%20font-size%3D%2218%22%20font-style%3D%22italic%22%20text-anchor%3D%22middle%22%20x%3D%2257.5%22%20y%3D%2216%22%3Ex%3C%2Ftext%3E%3C%2Fsvg%3E) is not a wave but consists of branches that repeat every 180° (its period is 180°)
is not a wave but consists of branches that repeat every 180° (its period is 180°)This is half the period of
 and
and 
There are dotted vertical lines that separate the branches called asymptotes
These are every 180° at
format('truetype')%3Bfont-weight%3Anormal%3Bfont-style%3Anormal%3B%7D%3C%2Fstyle%3E%3C%2Fdefs%3E%3Ctext%20font-family%3D%22Times%20New%20Roman%22%20font-size%3D%2218%22%20font-style%3D%22italic%22%20text-anchor%3D%22middle%22%20x%3D%224.5%22%20y%3D%2216%22%3Ex%3C%2Ftext%3E%3Ctext%20font-family%3D%22math123919e9c7f188e0f3ae690e7e2%22%20font-size%3D%2216%22%20text-anchor%3D%22middle%22%20x%3D%2218.5%22%20y%3D%2216%22%3E%3D%3C%2Ftext%3E%3Ctext%20font-family%3D%22Times%20New%20Roman%22%20font-size%3D%2218%22%20text-anchor%3D%22middle%22%20x%3D%2236.5%22%20y%3D%2216%22%3E90%3C%2Ftext%3E%3Ctext%20font-family%3D%22math123919e9c7f188e0f3ae690e7e2%22%20font-size%3D%2216%22%20text-anchor%3D%22middle%22%20x%3D%2249.5%22%20y%3D%2216%22%3E%26%23xB0%3B%3C%2Ftext%3E%3C%2Fsvg%3E) ,
, format('truetype')%3Bfont-weight%3Anormal%3Bfont-style%3Anormal%3B%7D%3C%2Fstyle%3E%3C%2Fdefs%3E%3Ctext%20font-family%3D%22Times%20New%20Roman%22%20font-size%3D%2218%22%20font-style%3D%22italic%22%20text-anchor%3D%22middle%22%20x%3D%224.5%22%20y%3D%2216%22%3Ex%3C%2Ftext%3E%3Ctext%20font-family%3D%22math123919e9c7f188e0f3ae690e7e2%22%20font-size%3D%2216%22%20text-anchor%3D%22middle%22%20x%3D%2218.5%22%20y%3D%2216%22%3E%3D%3C%2Ftext%3E%3Ctext%20font-family%3D%22Times%20New%20Roman%22%20font-size%3D%2218%22%20text-anchor%3D%22middle%22%20x%3D%2240.5%22%20y%3D%2216%22%3E270%3C%2Ftext%3E%3Ctext%20font-family%3D%22math123919e9c7f188e0f3ae690e7e2%22%20font-size%3D%2216%22%20text-anchor%3D%22middle%22%20x%3D%2258.5%22%20y%3D%2216%22%3E%26%23xB0%3B%3C%2Ftext%3E%3C%2Fsvg%3E) , ...
, ...The curve cannot touch these, but get closer and closer to them
A branch starts down at a height of
format('truetype')%3Bfont-weight%3Anormal%3Bfont-style%3Anormal%3B%7D%3C%2Fstyle%3E%3C%2Fdefs%3E%3Ctext%20font-family%3D%22math11c7de139cdcfeb650a17967e57%22%20font-size%3D%2216%22%20text-anchor%3D%22middle%22%20x%3D%226.5%22%20y%3D%2216%22%3E%26%23x2212%3B%3C%2Ftext%3E%3Ctext%20font-family%3D%22math11c7de139cdcfeb650a17967e57%22%20font-size%3D%2216%22%20text-anchor%3D%22middle%22%20x%3D%2222.5%22%20y%3D%2216%22%3E%26%23x221E%3B%3C%2Ftext%3E%3C%2Fsvg%3E) and goes up to a height of
and goes up to a height of format('truetype')%3Bfont-weight%3Anormal%3Bfont-style%3Anormal%3B%7D%3C%2Fstyle%3E%3C%2Fdefs%3E%3Ctext%20font-family%3D%22math113932401f86416e52c77b91ea2%22%20font-size%3D%2216%22%20text-anchor%3D%22middle%22%20x%3D%226.5%22%20y%3D%2216%22%3E%2B%3C%2Ftext%3E%3Ctext%20font-family%3D%22math113932401f86416e52c77b91ea2%22%20font-size%3D%2216%22%20text-anchor%3D%22middle%22%20x%3D%2222.5%22%20y%3D%2216%22%3E%26%23x221E%3B%3C%2Ftext%3E%3C%2Fsvg%3E)
- goes through the origin, (0, 0)
Worked Example
On the axes provided, sketch the graph of ![]() for
for ![]() .
.
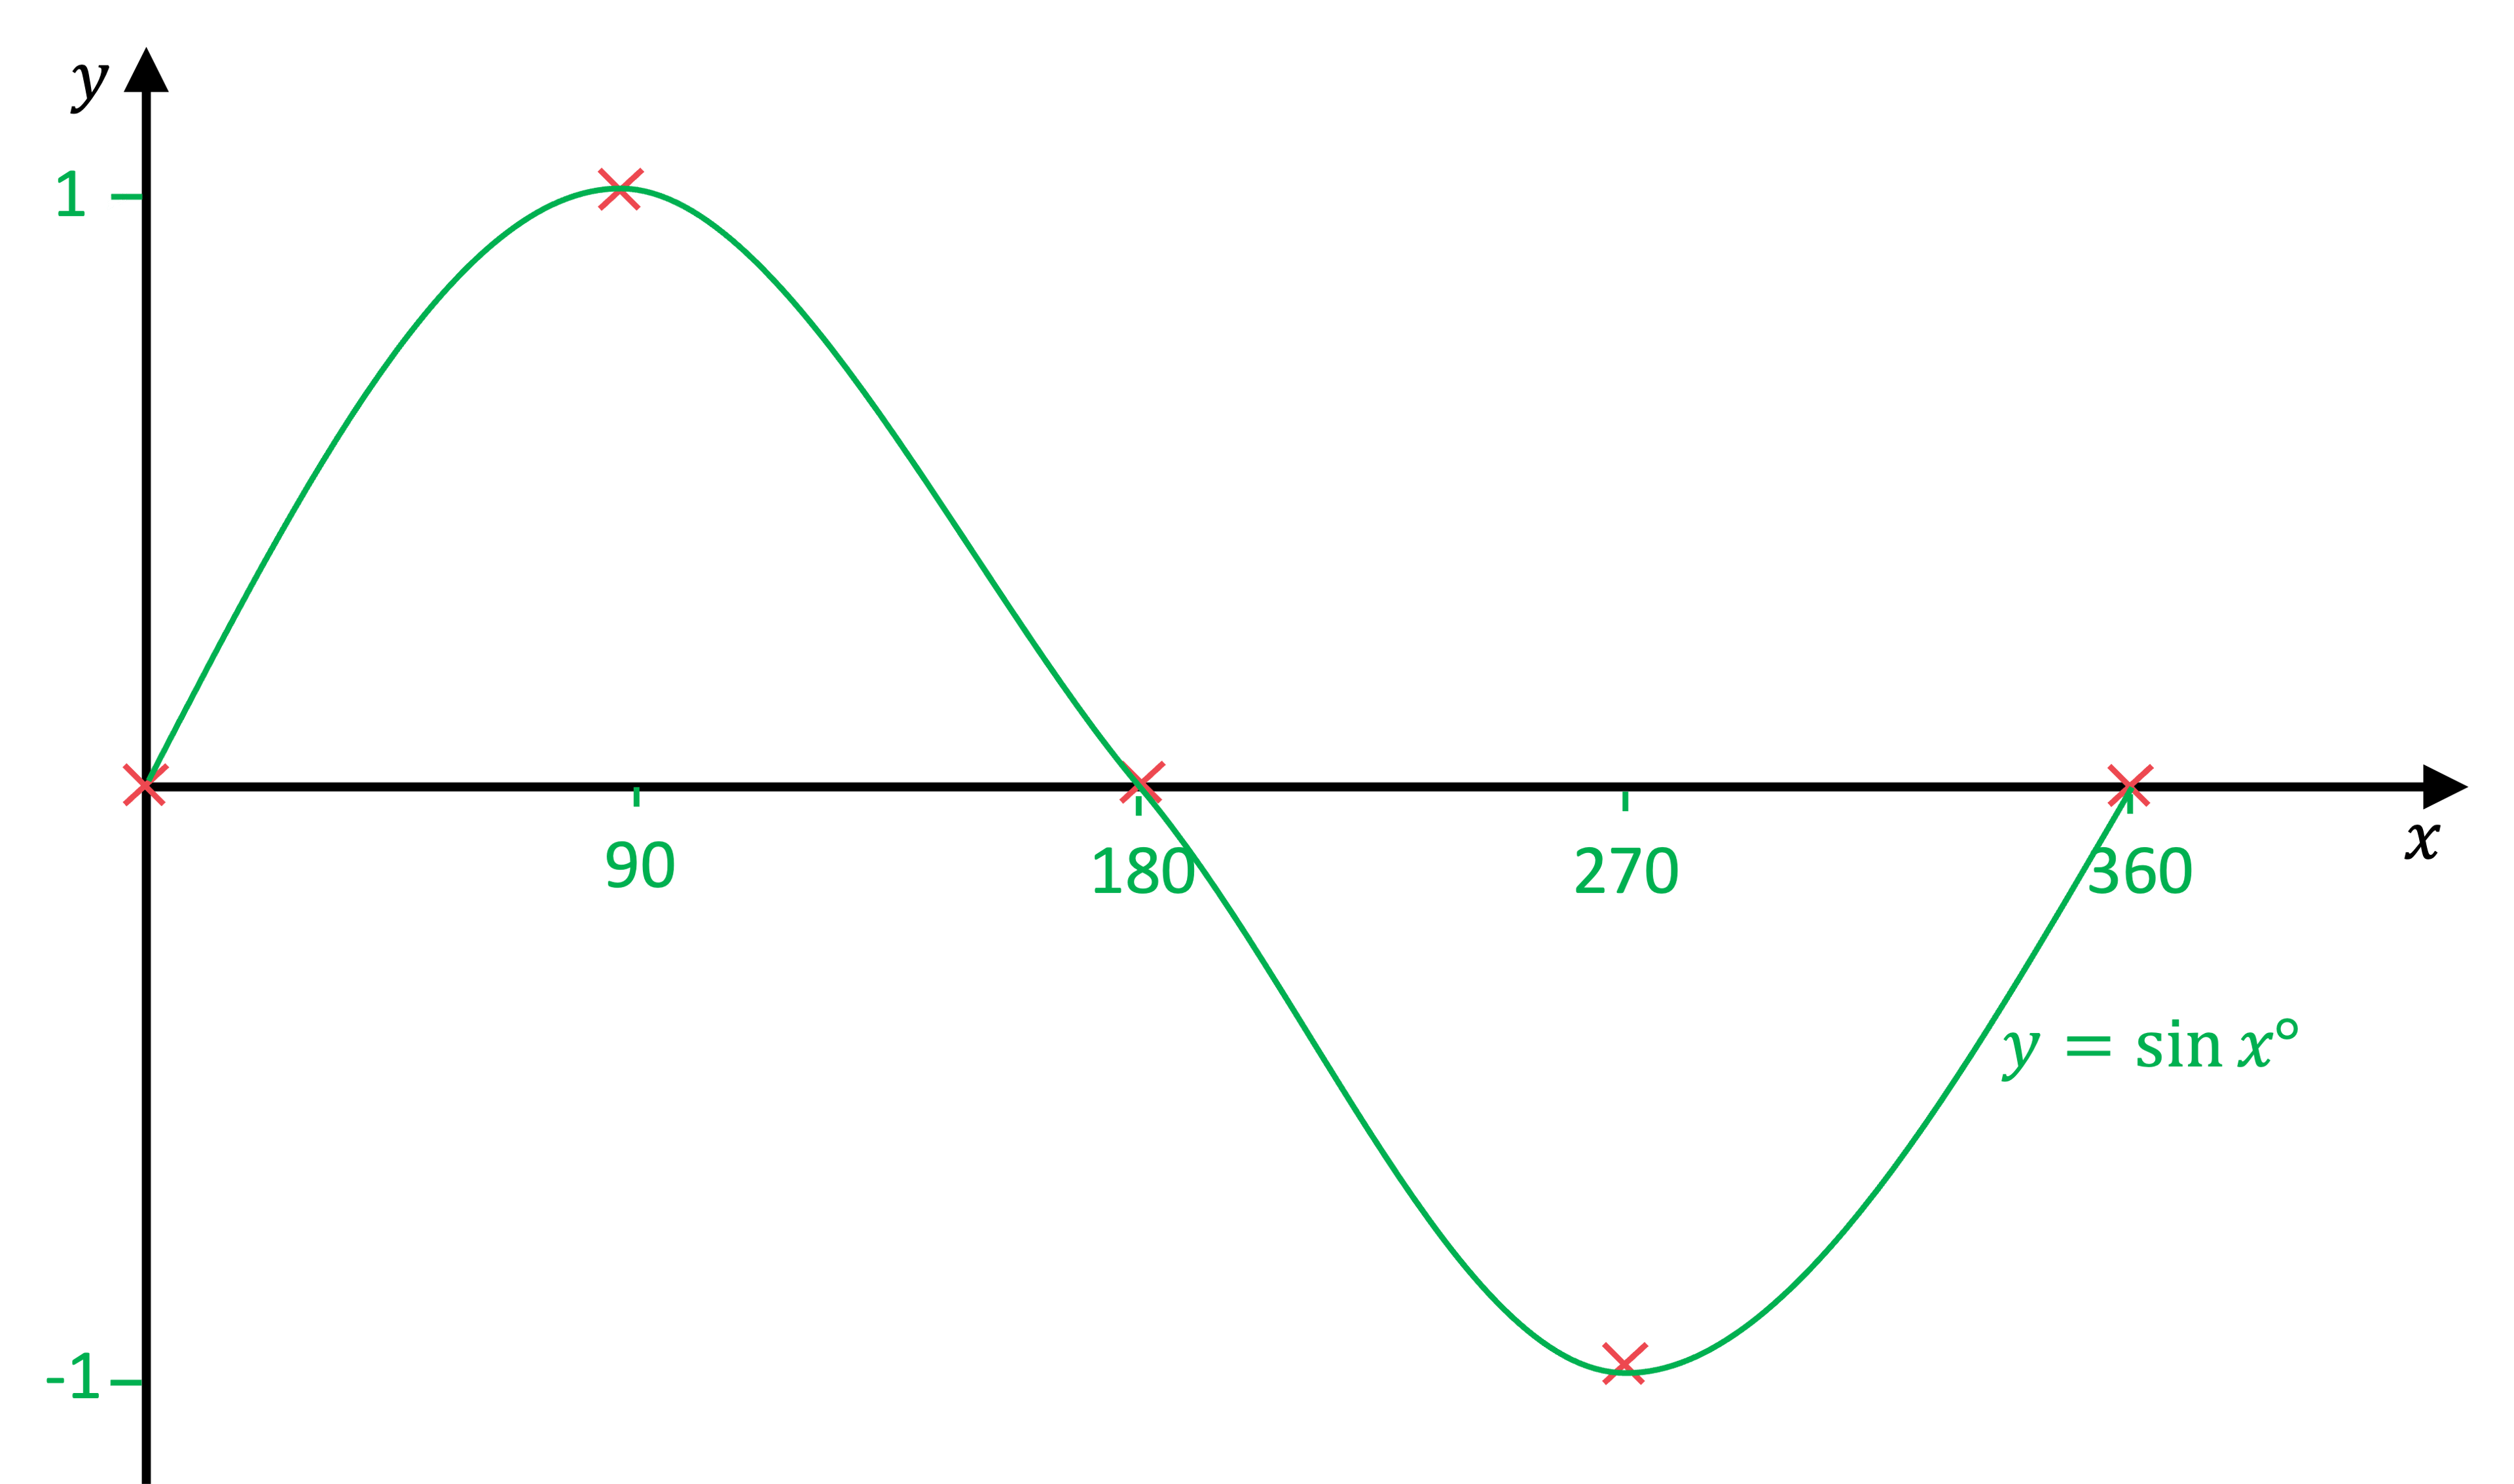
Mark 1 and −1 on the y-axis
Mark 0, 90, 180, 270 and 360 on the x-axis (try to space them evenly apart)
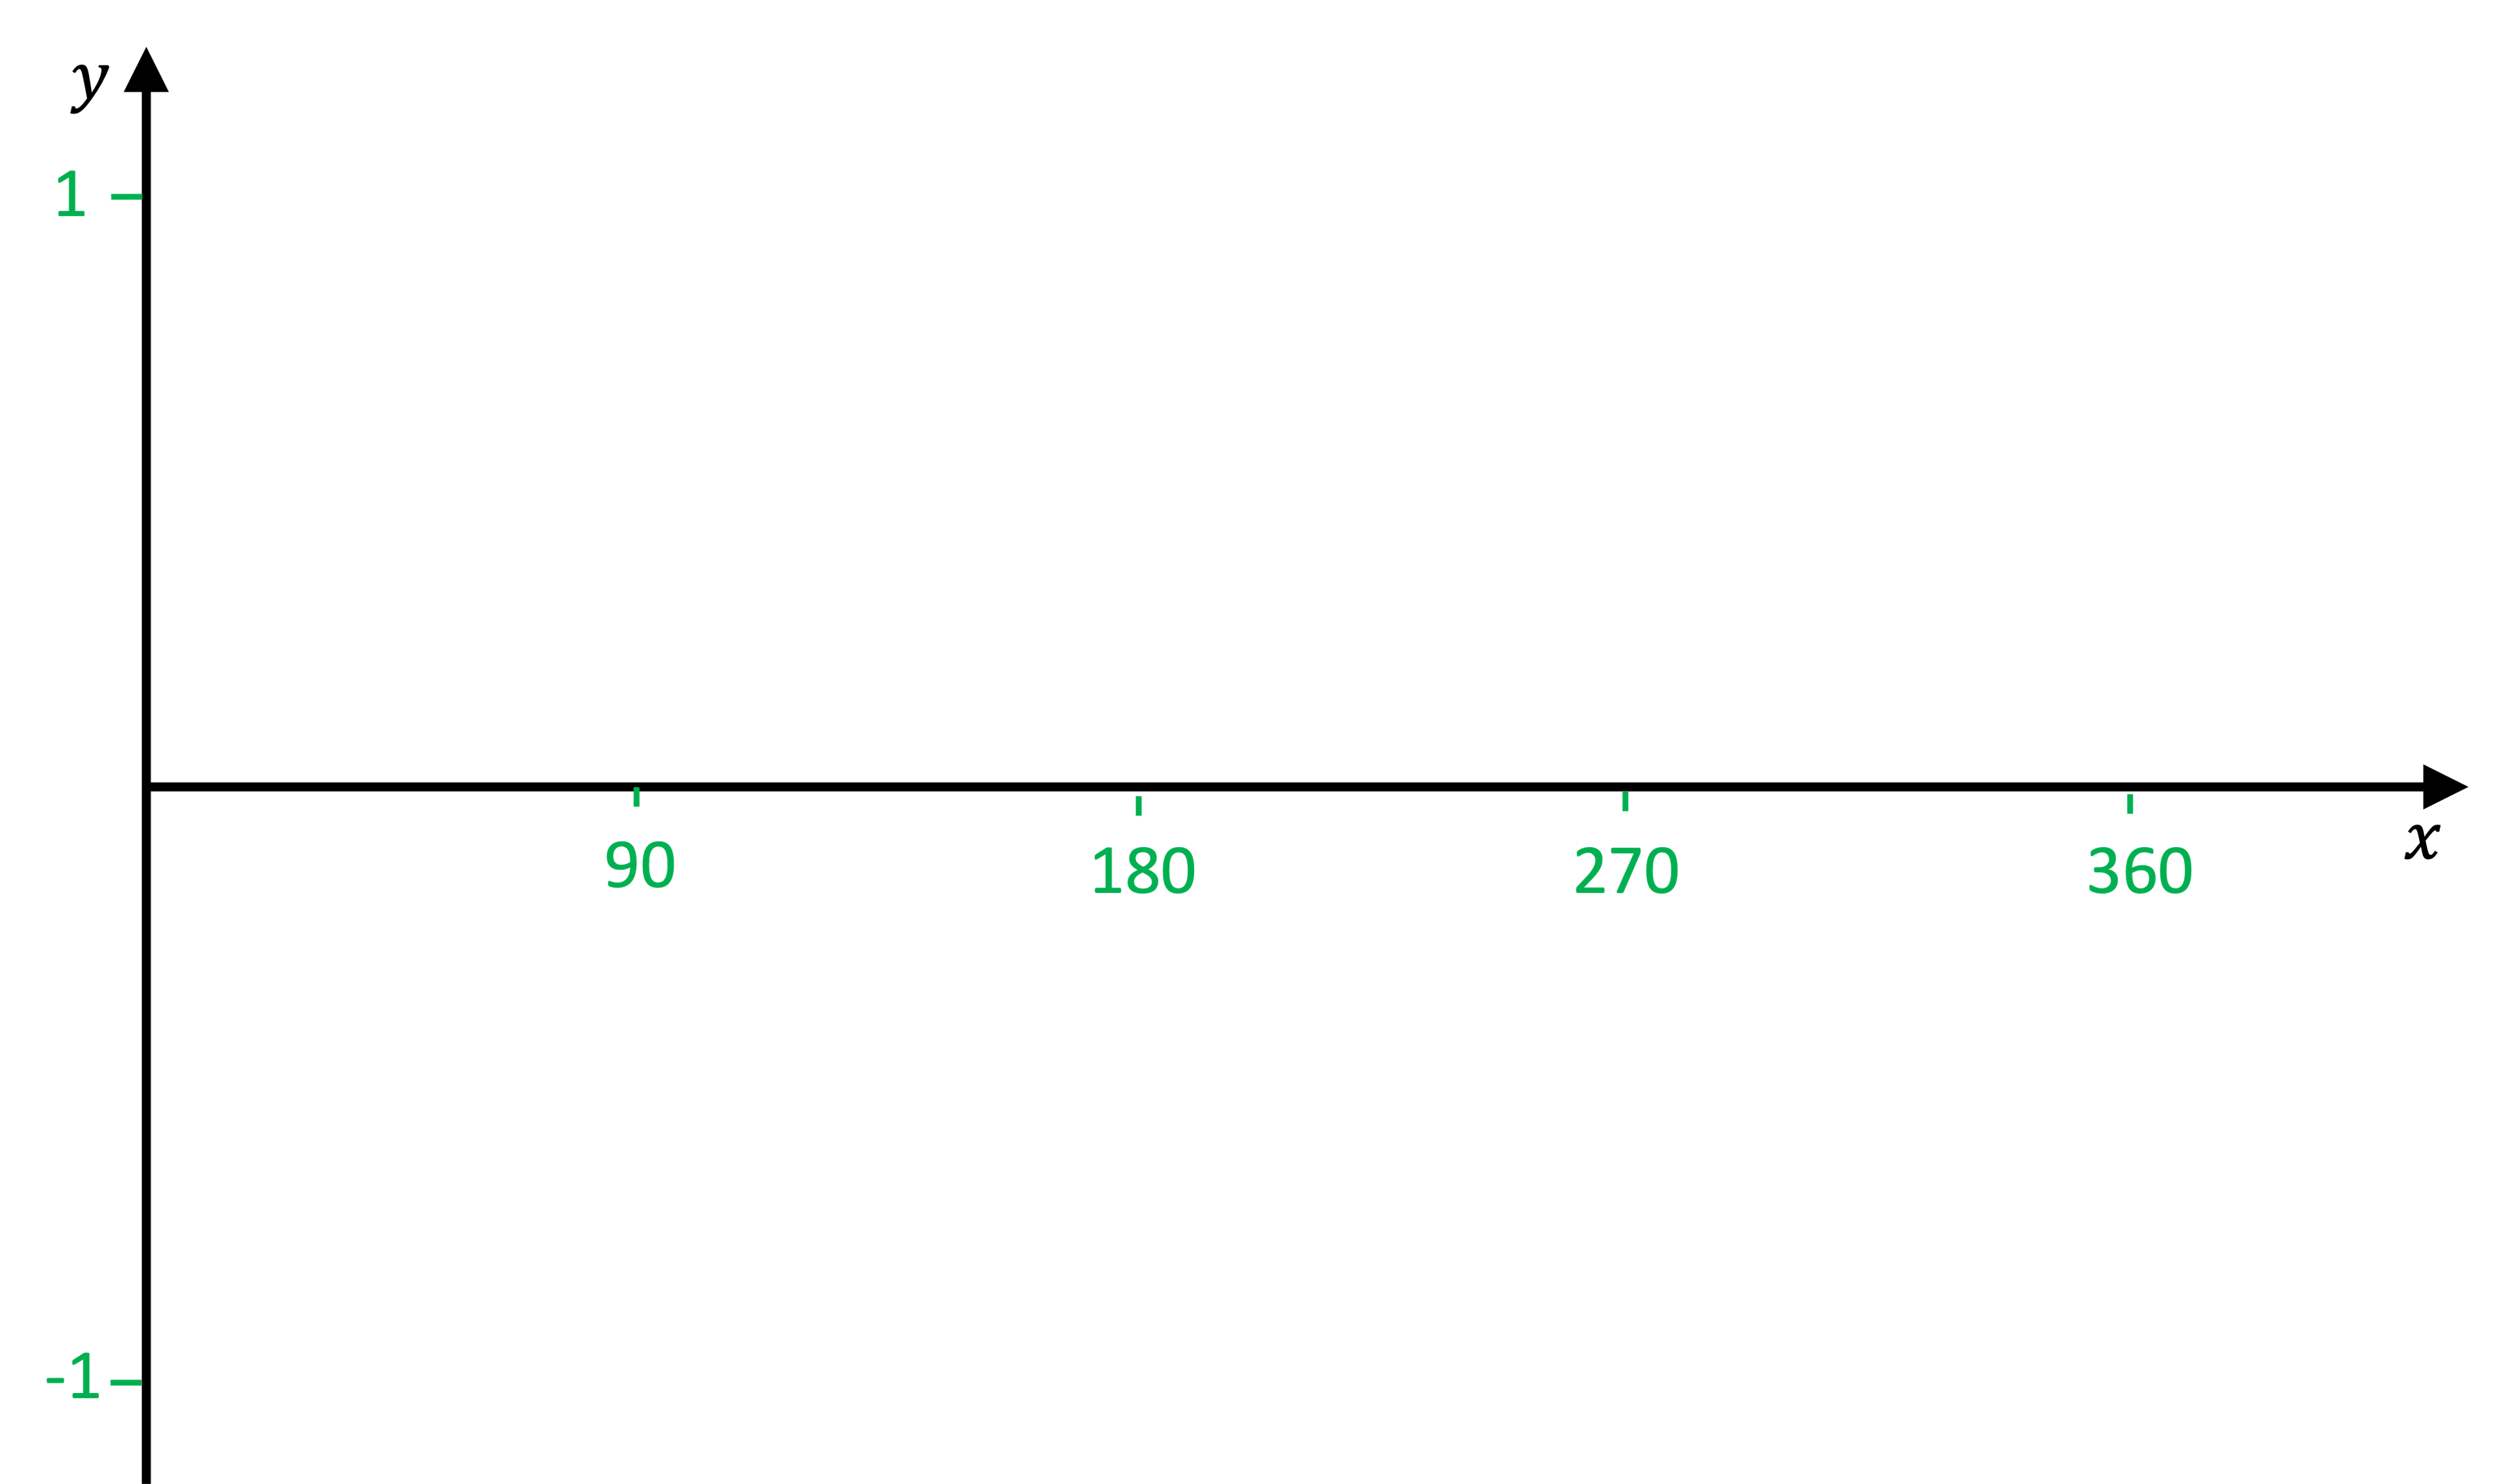
![]() starts at (0, 0) then every 90° it cycles though heights of 1, 0 , −1, 0, ...
starts at (0, 0) then every 90° it cycles though heights of 1, 0 , −1, 0, ...
Mark these points on the axes
Join the points with a smooth line
Label the curve with its equation

You've read 0 of your 5 free revision notes this week
Sign up now. It’s free!
Did this page help you?
