Drawing Graphs from Tables (Edexcel IGCSE Maths A (Modular)) : Revision Note

Did this video help you?
Drawing Graphs Using a Table
How do I draw a graph using a table of values?
To create a table of values
substitute different x-values into the equation
This gives the y-values
To plot the points
use the x and y-values to mark crosses on the grid at the coordinates (x , y )
Each point is expected to be plotted to an accuracy within half of the smallest square on the grid
Draw a single smooth freehand curve
Go through all the plotted points
Make it the shape you would expect
For example, quadratic curves have a vertical line of symmetry
Do not use a ruler for curves!
Which numbers should I be careful with?
For quadratic graphs, be careful substituting in negative numbers
Always put brackets around negative values and use BIDMAS
For example, substitute x = -3 into y = -x2 + 8x
This becomes y = -(-3)2 + 8(-3)
which simplifies to -9 - 24
so y = - 33
For reciprocal graphs like
format('truetype')%3Bfont-weight%3Anormal%3Bfont-style%3Anormal%3B%7Dtext%7Bfill%3A%23000000%3B%3C%2Fstyle%3E%3C%2Fdefs%3E%3Ctext%20font-family%3D%22Times%20New%20Roman%22%20font-size%3D%2218%22%20font-style%3D%22italic%22%20text-anchor%3D%22middle%22%20x%3D%224.5%22%20y%3D%2230%22%3Ey%3C%2Ftext%3E%3Ctext%20font-family%3D%22math17f39f8317fbdb1988ef4c628eb%22%20font-size%3D%2216%22%20text-anchor%3D%22middle%22%20x%3D%2218.5%22%20y%3D%2230%22%3E%3D%3C%2Ftext%3E%3Cline%20stroke%3D%22%23000000%22%20stroke-linecap%3D%22square%22%20stroke-width%3D%221%22%20x1%3D%2229.5%22%20x2%3D%2242.5%22%20y1%3D%2223.5%22%20y2%3D%2223.5%22%2F%3E%3Ctext%20font-family%3D%22Times%20New%20Roman%22%20font-size%3D%2218%22%20text-anchor%3D%22middle%22%20x%3D%2236.5%22%20y%3D%2216%22%3E1%3C%2Ftext%3E%3Ctext%20font-family%3D%22Times%20New%20Roman%22%20font-size%3D%2218%22%20font-style%3D%22italic%22%20text-anchor%3D%22middle%22%20x%3D%2235.5%22%20y%3D%2241%22%3Ex%3C%2Ftext%3E%3C%2Fsvg%3E) , or
, or format('truetype')%3Bfont-weight%3Anormal%3Bfont-style%3Anormal%3B%7D%3C%2Fstyle%3E%3C%2Fdefs%3E%3Ctext%20font-family%3D%22Times%20New%20Roman%22%20font-size%3D%2218%22%20font-style%3D%22italic%22%20text-anchor%3D%22middle%22%20x%3D%224.5%22%20y%3D%2230%22%3Ey%3C%2Ftext%3E%3Ctext%20font-family%3D%22math17f39f8317fbdb1988ef4c628eb%22%20font-size%3D%2216%22%20text-anchor%3D%22middle%22%20x%3D%2218.5%22%20y%3D%2230%22%3E%3D%3C%2Ftext%3E%3Cline%20stroke%3D%22%23000000%22%20stroke-linecap%3D%22square%22%20stroke-width%3D%221%22%20x1%3D%2229.5%22%20x2%3D%2249.5%22%20y1%3D%2223.5%22%20y2%3D%2223.5%22%2F%3E%3Ctext%20font-family%3D%22Times%20New%20Roman%22%20font-size%3D%2218%22%20text-anchor%3D%22middle%22%20x%3D%2239.5%22%20y%3D%2216%22%3E1%3C%2Ftext%3E%3Ctext%20font-family%3D%22Times%20New%20Roman%22%20font-size%3D%2218%22%20font-style%3D%22italic%22%20text-anchor%3D%22middle%22%20x%3D%2235.5%22%20y%3D%2242%22%3Ex%3C%2Ftext%3E%3Ctext%20font-family%3D%22Times%20New%20Roman%22%20font-size%3D%2213%22%20text-anchor%3D%22middle%22%20x%3D%2244.5%22%20y%3D%2237%22%3E2%3C%2Ftext%3E%3C%2Fsvg%3E) , do not include x = 0
, do not include x = 0You cannot divide by zero
You get an error on your calculator
There is no value at x = 0
The L-shaped branches can't cross the y-axis
There will be a vertical asymptote at x = 0
An example is given below with
| -3 | -2 | -1 | 0 | 1 | 2 | 3 |
|
|
|
| No value |
|
|
|
You should also be careful when there is a combination of different types of function
E.g.
format('truetype')%3Bfont-weight%3Anormal%3Bfont-style%3Anormal%3B%7D%3C%2Fstyle%3E%3C%2Fdefs%3E%3Ctext%20font-family%3D%22Times%20New%20Roman%22%20font-size%3D%2218%22%20font-style%3D%22italic%22%20text-anchor%3D%22middle%22%20x%3D%224.5%22%20y%3D%2230%22%3Ey%3C%2Ftext%3E%3Ctext%20font-family%3D%22math190bc3972c7934354efb2af01e7%22%20font-size%3D%2216%22%20text-anchor%3D%22middle%22%20x%3D%2218.5%22%20y%3D%2230%22%3E%3D%3C%2Ftext%3E%3Ctext%20font-family%3D%22Times%20New%20Roman%22%20font-size%3D%2218%22%20font-style%3D%22italic%22%20text-anchor%3D%22middle%22%20x%3D%2231.5%22%20y%3D%2230%22%3Ex%3C%2Ftext%3E%3Ctext%20font-family%3D%22Times%20New%20Roman%22%20font-size%3D%2213%22%20text-anchor%3D%22middle%22%20x%3D%2240.5%22%20y%3D%2225%22%3E2%3C%2Ftext%3E%3Ctext%20font-family%3D%22math190bc3972c7934354efb2af01e7%22%20font-size%3D%2216%22%20text-anchor%3D%22middle%22%20x%3D%2252.5%22%20y%3D%2230%22%3E%26%23x2212%3B%3C%2Ftext%3E%3Cline%20stroke%3D%22%23000000%22%20stroke-linecap%3D%22square%22%20stroke-width%3D%221%22%20x1%3D%2263.5%22%20x2%3D%2276.5%22%20y1%3D%2223.5%22%20y2%3D%2223.5%22%2F%3E%3Ctext%20font-family%3D%22Times%20New%20Roman%22%20font-size%3D%2218%22%20text-anchor%3D%22middle%22%20x%3D%2270.5%22%20y%3D%2216%22%3E1%3C%2Ftext%3E%3Ctext%20font-family%3D%22Times%20New%20Roman%22%20font-size%3D%2218%22%20font-style%3D%22italic%22%20text-anchor%3D%22middle%22%20x%3D%2269.5%22%20y%3D%2241%22%3Ex%3C%2Ftext%3E%3Ctext%20font-family%3D%22math190bc3972c7934354efb2af01e7%22%20font-size%3D%2216%22%20text-anchor%3D%22middle%22%20x%3D%2287.5%22%20y%3D%2230%22%3E%2B%3C%2Ftext%3E%3Ctext%20font-family%3D%22Times%20New%20Roman%22%20font-size%3D%2218%22%20text-anchor%3D%22middle%22%20x%3D%22100.5%22%20y%3D%2230%22%3E4%3C%2Ftext%3E%3C%2Fsvg%3E) has a quadratic term and a reciprocal term
has a quadratic term and a reciprocal termThis makes it harder to know the shape of the graph
But you can still use a table of values to plot them
Just be aware of points like x = 0 as described above, where there will be no value
How do I use the table function on my calculator?
Calculators can create tables of values for you
Find the table function
Type in the graph equation (called the function, f(x))
Use the alpha button then X or x
Press = when finished
If you are asked for another function, g(x), press = to ignore it
Enter the start value
The first x-value in the table
Press =
Enter the end value
The last x-value in the table
Enter the step size
How big the steps (gaps) are from one x-value to the next
Press =
Then scroll up and down to see all the y-values
Examiner Tips and Tricks
If you find a point that doesn't seem to fit the shape of the curve, check your working!
If any y-values are given in the question, check that your calculations agrees with them
Worked Example
(a) Complete the table of values for the graph of ![]() .
.
|
|
|
|
|
|
|
|
|
|
|
|
|
|
|
|
Use the table function on your calculator for ![]()
Start at -1.5, end at 1.5 and use steps of 0.5
Alternatively, substitute the x-values into the equation, for example x = -1.5
format('truetype')%3Bfont-weight%3Anormal%3Bfont-style%3Anormal%3B%7D%40font-face%7Bfont-family%3A'round_brackets18549f92a457f2409'%3Bsrc%3Aurl(data%3Afont%2Ftruetype%3Bcharset%3Dutf-8%3Bbase64%2CAAEAAAAMAIAAAwBAT1MvMjwHLFQAAADMAAAATmNtYXDf7xCrAAABHAAAADxjdnQgBAkDLgAAAVgAAAASZ2x5ZmAOz2cAAAFsAAABJGhlYWQOKih8AAACkAAAADZoaGVhCvgVwgAAAsgAAAAkaG10eCA6AAIAAALsAAAADGxvY2EAAARLAAAC%2BAAAABBtYXhwBIgEWQAAAwgAAAAgbmFtZXHR30MAAAMoAAACOXBvc3QDogHPAAAFZAAAACBwcmVwupWEAAAABYQAAAAHAAAGcgGQAAUAAAgACAAAAAAACAAIAAAAAAAAAQIAAAAAAAAAAAAAAAAAAAAAAAAAAAAAAAAAAAAAACAgICAAAAAo8AMGe%2F57AAAHPgGyAAAAAAACAAEAAQAAABQAAwABAAAAFAAEACgAAAAGAAQAAQACACgAKf%2F%2FAAAAKAAp%2F%2F%2F%2F2f%2FZAAEAAAAAAAAAAAFUAFYBAAAsAKgDgAAyAAcAAAACAAAAKgDVA1UAAwAHAAA1MxEjEyMRM9XVq4CAKgMr%2FQAC1QABAAD%2B0AIgBtAACQBNGAGwChCwA9SwAxCwAtSwChCwBdSwBRCwANSwAxCwBzywAhCwCDwAsAoQsAPUsAMQsAfUsAoQsAXUsAoQsADUsAMQsAI8sAcQsAg8MTAREAEzABEQASMAAZCQ%2FnABkJD%2BcALQ%2FZD%2BcAGQAnACcAGQ%2FnAAAQAA%2FtACIAbQAAkATRgBsAoQsAPUsAMQsALUsAoQsAXUsAUQsADUsAMQsAc8sAIQsAg8ALAKELAD1LADELAH1LAKELAF1LAKELAA1LADELACPLAHELAIPDEwARABIwAREAEzAAIg%2FnCQAZD%2BcJABkALQ%2FZD%2BcAGQAnACcAGQ%2FnAAAQAAAAEAAPW2NYFfDzz1AAMIAP%2F%2F%2F%2F%2FVre7u%2F%2F%2F%2F%2F9Wt7u4AAP7QA7cG0AAAAAoAAgABAAAAAAABAAAHPv5OAAAXcAAA%2F%2F4DtwABAAAAAAAAAAAAAAAAAAAAAwDVAAACIAAAAiAAAAAAAAAAAAAkAAAAowAAASQAAQAAAAMACgACAAAAAAACAIAEAAAAAAAEAABNAAAAAAAAABUBAgAAAAAAAAABAD4AAAAAAAAAAAACAA4APgAAAAAAAAADAFwATAAAAAAAAAAEAD4AqAAAAAAAAAAFABYA5gAAAAAAAAAGAB8A%2FAAAAAAAAAAIABwBGwABAAAAAAABAD4AAAABAAAAAAACAA4APgABAAAAAAADAFwATAABAAAAAAAEAD4AqAABAAAAAAAFABYA5gABAAAAAAAGAB8A%2FAABAAAAAAAIABwBGwADAAEECQABAD4AAAADAAEECQACAA4APgADAAEECQADAFwATAADAAEECQAEAD4AqAADAAEECQAFABYA5gADAAEECQAGAB8A%2FAADAAEECQAIABwBGwBSAG8AdQBuAGQAIABiAHIAYQBjAGsAZQB0AHMAIAB3AGkAdABoACAAYQBzAGMAZQBuAHQAIAAxADgANQA0AFIAZQBnAHUAbABhAHIATQBhAHQAaABzACAARgBvAHIAIABNAG8AcgBlACAAUgBvAHUAbgBkACAAYgByAGEAYwBrAGUAdABzACAAdwBpAHQAaAAgAGEAcwBjAGUAbgB0ACAAMQA4ADUANABSAG8AdQBuAGQAIABiAHIAYQBjAGsAZQB0AHMAIAB3AGkAdABoACAAYQBzAGMAZQBuAHQAIAAxADgANQA0AFYAZQByAHMAaQBvAG4AIAAyAC4AMFJvdW5kX2JyYWNrZXRzX3dpdGhfYXNjZW50XzE4NTQATQBhAHQAaABzACAARgBvAHIAIABNAG8AcgBlAAAAAAMAAAAAAAADnwHPAAAAAAAAAAAAAAAAAAAAAAAAAAC5B%2F8AAY2FAA%3D%3D)format('truetype')%3Bfont-weight%3Anormal%3Bfont-style%3Anormal%3B%7Dtext%7Bfill%3A%23000000%3B%3C%2Fstyle%3E%3C%2Fdefs%3E%3Ctext%20fill%3D%22%23000000%22%20font-family%3D%22Times%20New%20Roman%22%20font-size%3D%2218%22%20font-style%3D%22italic%22%20text-anchor%3D%22middle%22%20x%3D%224.5%22%20y%3D%2217%22%3Ey%3C%2Ftext%3E%3Ctext%20fill%3D%22%23000000%22%20font-family%3D%22math12496fedf31ce8c35183db047fb%22%20font-size%3D%2216%22%20text-anchor%3D%22middle%22%20x%3D%2218.5%22%20y%3D%2217%22%3E%3D%3C%2Ftext%3E%3Ctext%20fill%3D%22%23000000%22%20font-family%3D%22Times%20New%20Roman%22%20font-size%3D%2218%22%20text-anchor%3D%22middle%22%20x%3D%2236.5%22%20y%3D%2217%22%3E10%3C%2Ftext%3E%3Ctext%20fill%3D%22%23000000%22%20font-family%3D%22math12496fedf31ce8c35183db047fb%22%20font-size%3D%2216%22%20text-anchor%3D%22middle%22%20x%3D%2253.5%22%20y%3D%2217%22%3E%26%23x2212%3B%3C%2Ftext%3E%3Ctext%20fill%3D%22%23000000%22%20font-family%3D%22Times%20New%20Roman%22%20font-size%3D%2218%22%20text-anchor%3D%22middle%22%20x%3D%2266.5%22%20y%3D%2217%22%3E8%3C%2Ftext%3E%3Ctext%20fill%3D%22%23000000%22%20font-family%3D%22round_brackets18549f92a457f2409%22%20font-size%3D%2218%22%20text-anchor%3D%22middle%22%20x%3D%2274.5%22%20y%3D%2217%22%3E(%3C%2Ftext%3E%3Ctext%20fill%3D%22%23000000%22%20font-family%3D%22round_brackets18549f92a457f2409%22%20font-size%3D%2218%22%20text-anchor%3D%22middle%22%20x%3D%22115.5%22%20y%3D%2217%22%3E)%3C%2Ftext%3E%3Ctext%20fill%3D%22%23000000%22%20font-family%3D%22math12496fedf31ce8c35183db047fb%22%20font-size%3D%2216%22%20text-anchor%3D%22middle%22%20x%3D%2283.5%22%20y%3D%2217%22%3E%26%23x2212%3B%3C%2Ftext%3E%3Ctext%20fill%3D%22%23000000%22%20font-family%3D%22Times%20New%20Roman%22%20font-size%3D%2218%22%20text-anchor%3D%22middle%22%20x%3D%2294.5%22%20y%3D%2217%22%3E1%3C%2Ftext%3E%3Ctext%20fill%3D%22%23000000%22%20font-family%3D%22math12496fedf31ce8c35183db047fb%22%20font-size%3D%2216%22%20text-anchor%3D%22middle%22%20x%3D%22101.5%22%20y%3D%2217%22%3E.%3C%2Ftext%3E%3Ctext%20fill%3D%22%23000000%22%20font-family%3D%22Times%20New%20Roman%22%20font-size%3D%2218%22%20text-anchor%3D%22middle%22%20x%3D%22108.5%22%20y%3D%2217%22%3E5%3C%2Ftext%3E%3Ctext%20fill%3D%22%23000000%22%20font-family%3D%22Times%20New%20Roman%22%20font-size%3D%2213%22%20text-anchor%3D%22middle%22%20x%3D%22122.5%22%20y%3D%2212%22%3E2%3C%2Ftext%3E%3Ctext%20fill%3D%22%23000000%22%20font-family%3D%22math12496fedf31ce8c35183db047fb%22%20font-size%3D%2216%22%20text-anchor%3D%22middle%22%20x%3D%2218.5%22%20y%3D%2243%22%3E%3D%3C%2Ftext%3E%3Ctext%20fill%3D%22%23000000%22%20font-family%3D%22Times%20New%20Roman%22%20font-size%3D%2218%22%20text-anchor%3D%22middle%22%20x%3D%2236.5%22%20y%3D%2243%22%3E10%3C%2Ftext%3E%3Ctext%20fill%3D%22%23000000%22%20font-family%3D%22math12496fedf31ce8c35183db047fb%22%20font-size%3D%2216%22%20text-anchor%3D%22middle%22%20x%3D%2253.5%22%20y%3D%2243%22%3E%26%23x2212%3B%3C%2Ftext%3E%3Ctext%20fill%3D%22%23000000%22%20font-family%3D%22Times%20New%20Roman%22%20font-size%3D%2218%22%20text-anchor%3D%22middle%22%20x%3D%2266.5%22%20y%3D%2243%22%3E8%3C%2Ftext%3E%3Ctext%20fill%3D%22%23000000%22%20font-family%3D%22math12496fedf31ce8c35183db047fb%22%20font-size%3D%2216%22%20text-anchor%3D%22middle%22%20x%3D%2279.5%22%20y%3D%2243%22%3E%26%23xD7%3B%3C%2Ftext%3E%3Ctext%20fill%3D%22%23000000%22%20font-family%3D%22Times%20New%20Roman%22%20font-size%3D%2218%22%20text-anchor%3D%22middle%22%20x%3D%2292.5%22%20y%3D%2243%22%3E2%3C%2Ftext%3E%3Ctext%20fill%3D%22%23000000%22%20font-family%3D%22math12496fedf31ce8c35183db047fb%22%20font-size%3D%2216%22%20text-anchor%3D%22middle%22%20x%3D%2299.5%22%20y%3D%2243%22%3E.%3C%2Ftext%3E%3Ctext%20fill%3D%22%23000000%22%20font-family%3D%22Times%20New%20Roman%22%20font-size%3D%2218%22%20text-anchor%3D%22middle%22%20x%3D%22111.5%22%20y%3D%2243%22%3E25%3C%2Ftext%3E%3Ctext%20fill%3D%22%23000000%22%20font-family%3D%22math12496fedf31ce8c35183db047fb%22%20font-size%3D%2216%22%20text-anchor%3D%22middle%22%20x%3D%2218.5%22%20y%3D%2269%22%3E%3D%3C%2Ftext%3E%3Ctext%20fill%3D%22%23000000%22%20font-family%3D%22Times%20New%20Roman%22%20font-size%3D%2218%22%20text-anchor%3D%22middle%22%20x%3D%2236.5%22%20y%3D%2269%22%3E10%3C%2Ftext%3E%3Ctext%20fill%3D%22%23000000%22%20font-family%3D%22math12496fedf31ce8c35183db047fb%22%20font-size%3D%2216%22%20text-anchor%3D%22middle%22%20x%3D%2253.5%22%20y%3D%2269%22%3E%26%23x2212%3B%3C%2Ftext%3E%3Ctext%20fill%3D%22%23000000%22%20font-family%3D%22Times%20New%20Roman%22%20font-size%3D%2218%22%20text-anchor%3D%22middle%22%20x%3D%2271.5%22%20y%3D%2269%22%3E18%3C%2Ftext%3E%3Ctext%20fill%3D%22%23000000%22%20font-family%3D%22math12496fedf31ce8c35183db047fb%22%20font-size%3D%2216%22%20text-anchor%3D%22middle%22%20x%3D%2218.5%22%20y%3D%2295%22%3E%3D%3C%2Ftext%3E%3Ctext%20fill%3D%22%23000000%22%20font-family%3D%22math12496fedf31ce8c35183db047fb%22%20font-size%3D%2216%22%20text-anchor%3D%22middle%22%20x%3D%2235.5%22%20y%3D%2295%22%3E%26%23x2212%3B%3C%2Ftext%3E%3Ctext%20fill%3D%22%23000000%22%20font-family%3D%22Times%20New%20Roman%22%20font-size%3D%2218%22%20text-anchor%3D%22middle%22%20x%3D%2248.5%22%20y%3D%2295%22%3E8%3C%2Ftext%3E%3C%2Fsvg%3E)
|
|
|
|
|
|
|
|
| -8 |
| 8 | 10 | 8 | 2 |
|
(b) Plot the graph of ![]() on the axes below, for values of
on the axes below, for values of ![]() from
from ![]() to
to ![]() .
.
Carefully plot the points from your table on to the grid
Note the different scales on the axes
Join the points with a smooth curve (do not use a ruler)
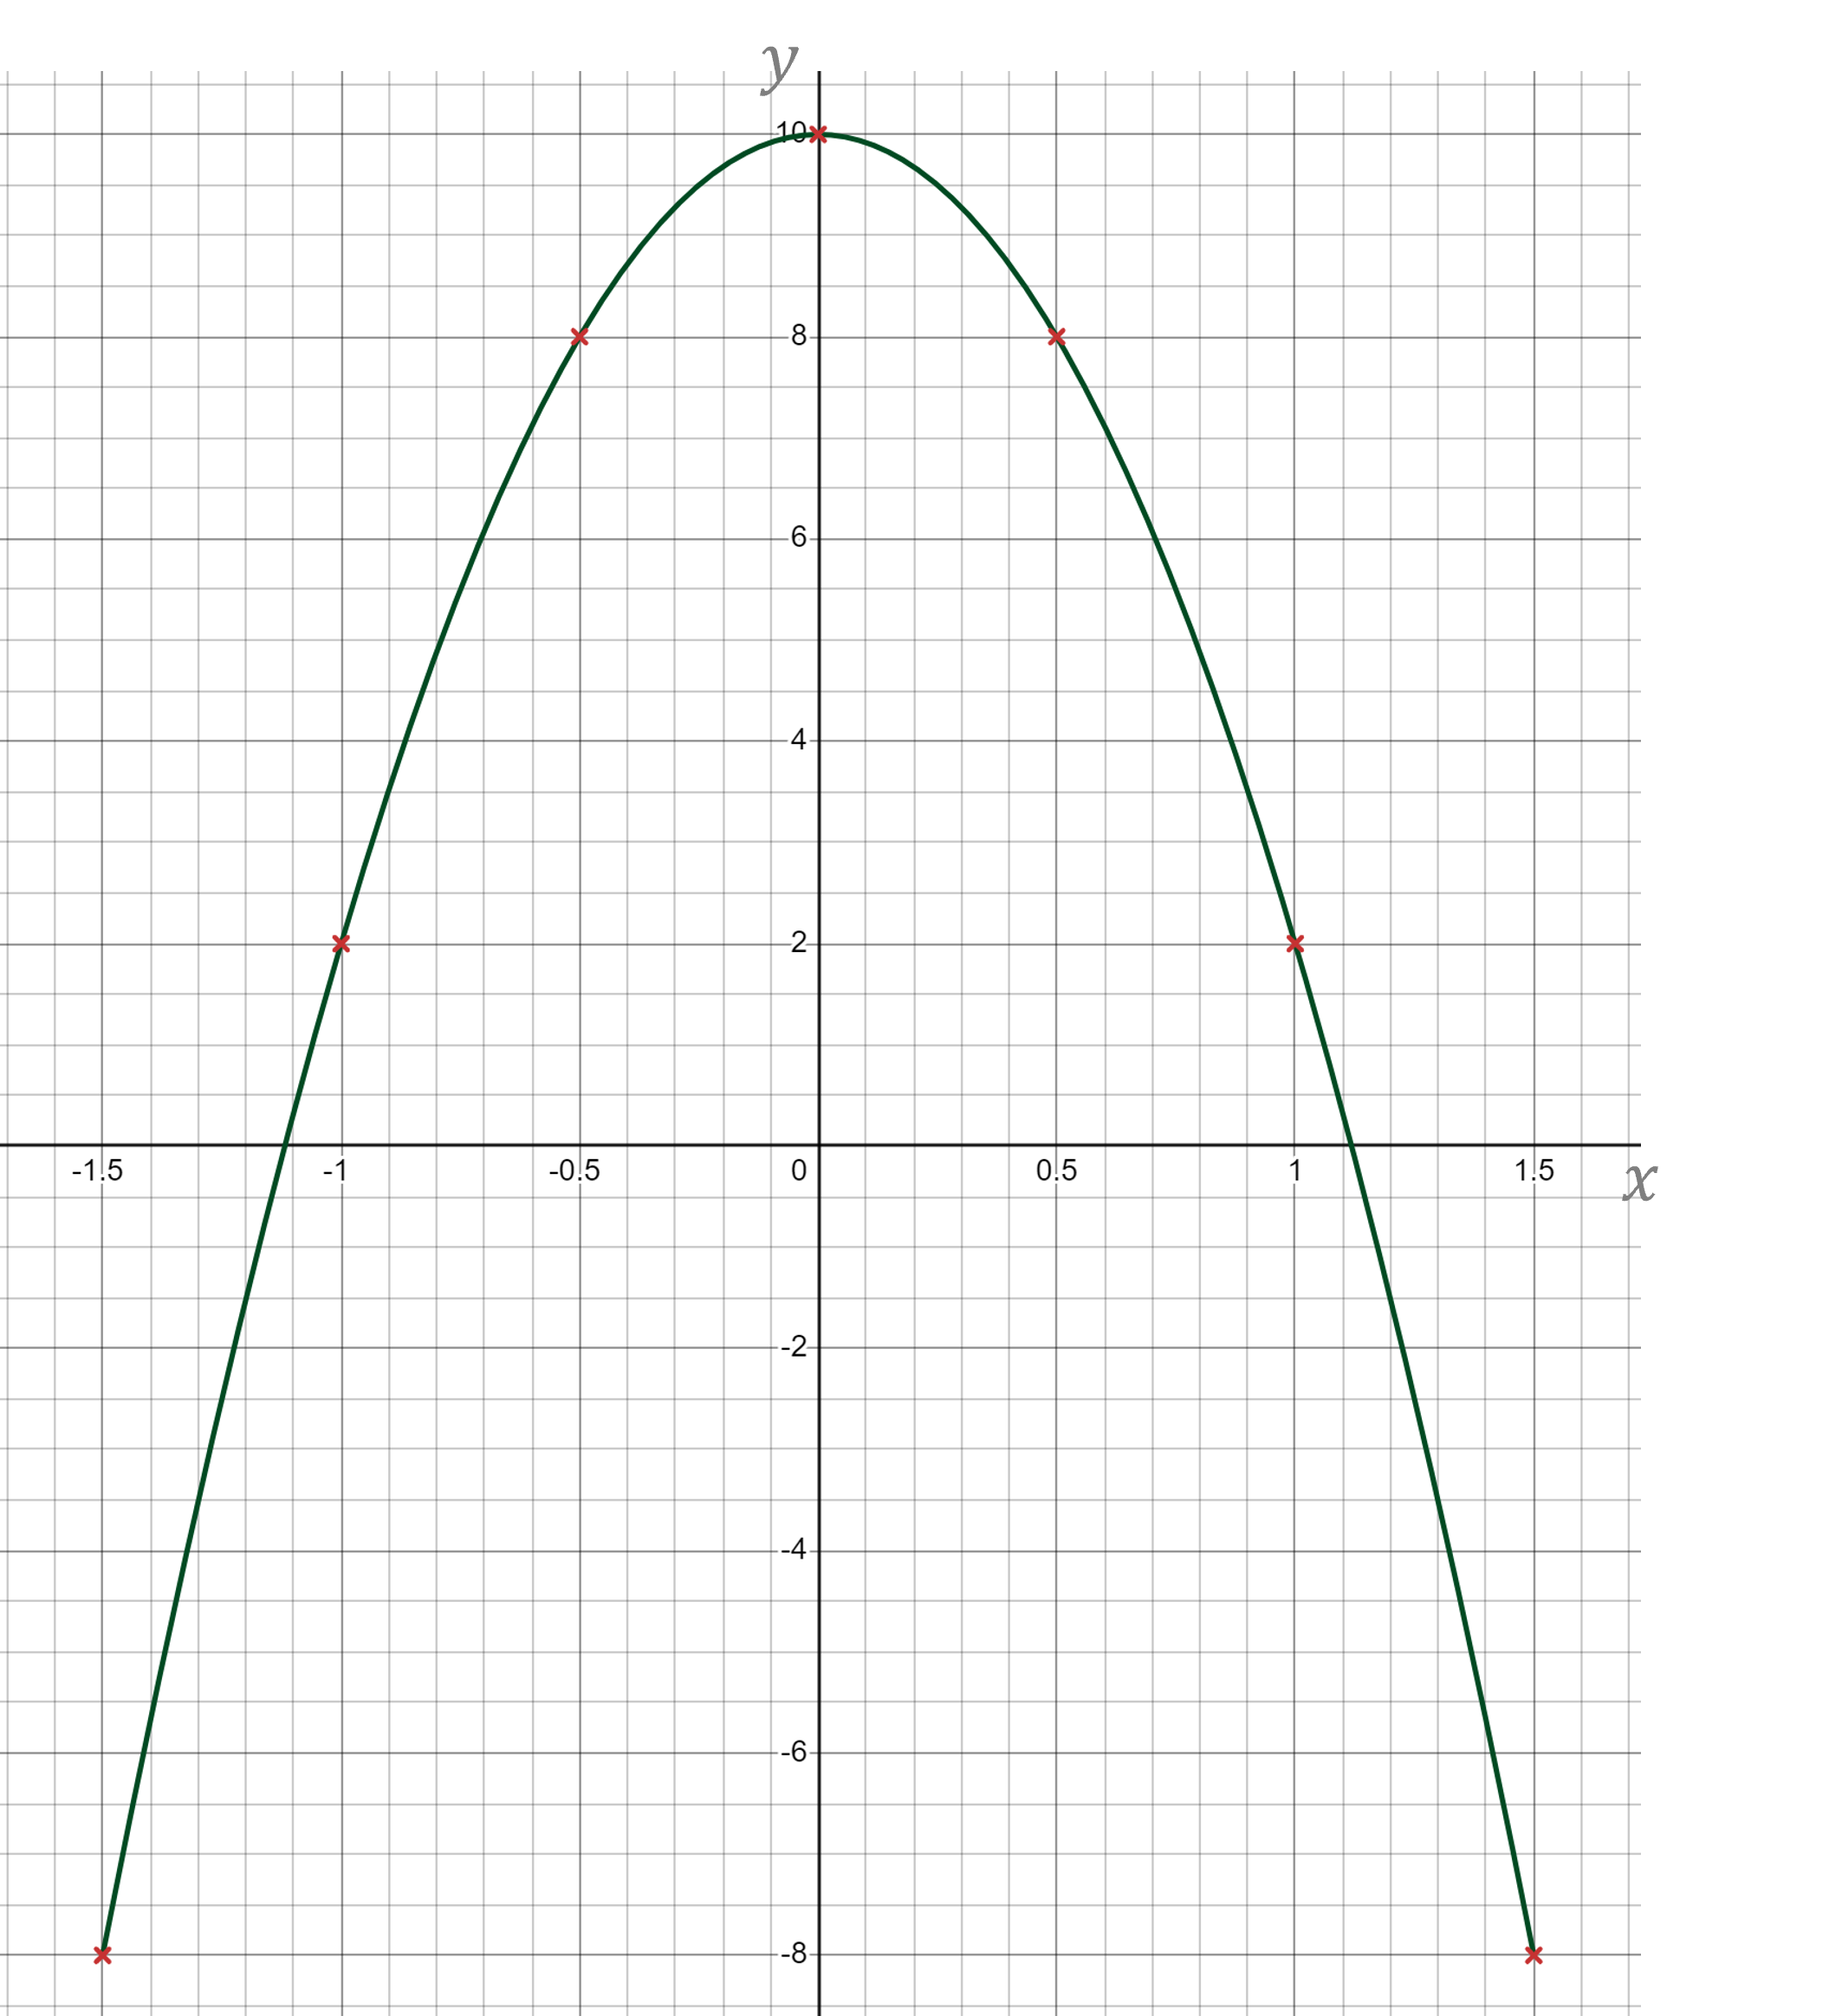
(c) Write down the equation of the line of symmetry of the curve.
There is a vertical line of symmetry about the y-axis
The equation of the y-axis is x = 0
x = 0

You've read 0 of your 5 free revision notes this week
Sign up now. It’s free!
Did this page help you?
