Applications of Differentiation (Edexcel IGCSE Maths)

Revision Note

Mark

Author

Mark

Last updated

Did this video help you?

Finding Stationary Points & Turning Points

What is a turning point?

  • The easiest way to think of a turning point is that it is a point at which a curve changes from moving upwards to moving downwards, or vice versa
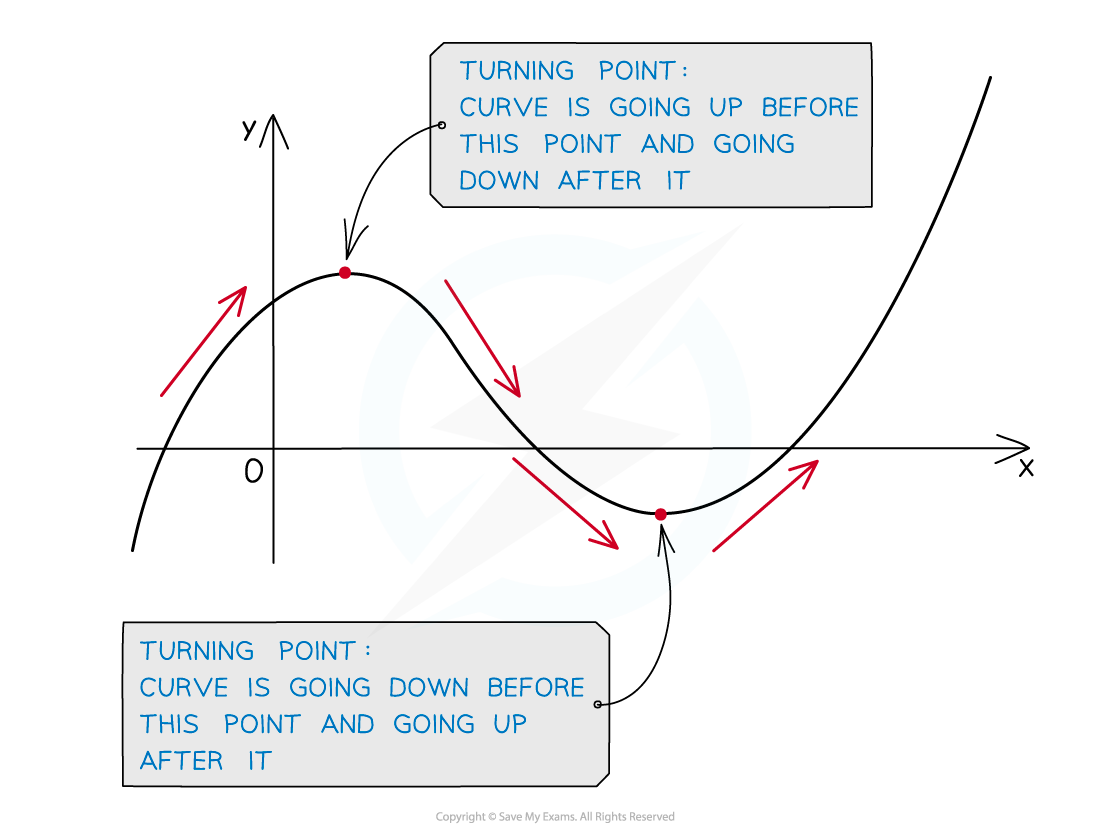
  • Turning points are also called stationary points
    • stationary means the gradient is zero (flat) at these points

 Turn Pts Notes fig1, downloadable IGCSE & GCSE Maths revision notes

  • At a turning point the gradient of the curve is zero.
    • If a tangent is drawn at a turning point it will be a horizontal line
    • Horizontal lines have a gradient of zero

  • This means substituting the x-coordinate of a turning point into the gradient function (aka derived function or derivative) will give an output of zero
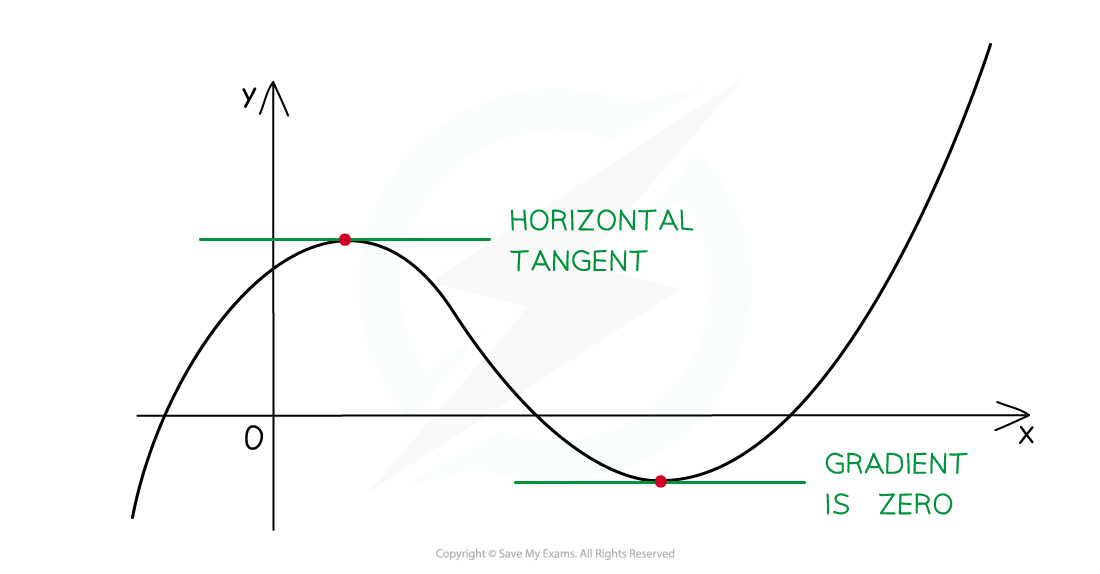
 

Turn Pts Notes fig2, downloadable IGCSE & GCSE Maths revision notes

How do I find the coordinates of a turning point?

  • STEP 1:  Solve the equation of the gradient function (derivative / derived function) equal to zero

    ie. solve fraction numerator bold d bold italic y over denominator bold d bold italic x end fraction bold equals bold 0

    This will find the x-coordinate of the turning point
  • STEP 2:  To find the y-coordinate of the turning point, substitute the x-coordinate into the equation of the graph, y = ...
    • not into the gradient function

Examiner Tip

  • Remember to read the questions carefully (sometimes only the x-coordinate of a turning point is required)

Worked example

Turn Pts Notes fig4, downloadable IGCSE & GCSE Maths revision notes

Classifying Stationary Points

What are the different types of stationary points?

  • You can see from the shape of a curve the different types of stationary points
  • You need to know two different types of stationary points (turning points):
    • Maximum points (this is where the graph reaches a “peak”)
    • Minimum points (this is where the graph reaches a “trough”)

 Turn Pts Notes fig3, downloadable IGCSE & GCSE Maths revision notes 

  • These are sometimes called local maximum/minimum points as other parts of the graph may still reach higher/lower values

How do I use graphs to classify which is a maximum point and which is a minimum point?

  • You can see and justify which is a maximum point and which is a minimum point from the shape of a curve...
    • ... either from a sketch given in the question
    • ... or a sketch drawn by yourself

      (You may even be asked to do this as part of a question)

    • ... or from the equation of the curve

  • For parabolas (quadratics) it should be obvious ...
    • ... a positive parabola (positive x2 term) has a minimum point
    • ... a negative parabola (negative x2 term) has a maximum point

 Turn Pts Notes fig5, downloadable IGCSE & GCSE Maths revision notes

  • Cubic graphs are also easily recognisable ...
    • ... a positive cubic has a maximum point on the left, minimum on the right
    • ... a negative cubic has a minimum on the left, maximum on the right

 Turn Pts Notes fig6, downloadable IGCSE & GCSE Maths revision notes

Worked example

Turn Pts Example fig1 qu, downloadable IGCSE & GCSE Maths revision notesTurn Pts Example fig2 sol, downloadable IGCSE & GCSE Maths revision notes

You've read 0 of your 10 free revision notes

Unlock more, it's free!

Join the 100,000+ Students that ❤️ Save My Exams

the (exam) results speak for themselves:

Did this page help you?

Mark

Author: Mark

Expertise: Maths

Mark graduated twice from the University of Oxford: once in 2009 with a First in Mathematics, then again in 2013 with a PhD (DPhil) in Mathematics. He has had nine successful years as a secondary school teacher, specialising in A-Level Further Maths and running extension classes for Oxbridge Maths applicants. Alongside his teaching, he has written five internal textbooks, introduced new spiralling school curriculums and trained other Maths teachers through outreach programmes.