Solving Quadratic Inequalities (Edexcel IGCSE Maths A)

Revision Note

Mark Curtis

Written by: Mark Curtis

Reviewed by: Dan Finlay

Updated on

Solving Quadratic Inequalities

What are quadratic inequalities?

  • A quadratic inequality has the form a x squared plus b x plus c greater or equal than 0

    • There is an x squared term and any inequality sign, greater or equal than comma space less or equal than comma space greater than comma space less than

    • They can usually be factorised

      • For example, open parentheses x minus 2 close parentheses open parentheses x minus 5 close parentheses greater or equal than 0

  • Solutions to quadratic inequalities are ranges of x values

    • For example, 1 less or equal than x less or equal than 4

How do I solve a quadratic inequality?

  • Quadratic inequalities are solved by sketching a graph

    • The solutions then appears along the x-axis

  • For example, to solve open parentheses x minus 2 close parentheses open parentheses x minus 5 close parentheses greater or equal than 0

    • Sketch the graph of y equals open parentheses x minus 2 close parentheses open parentheses x minus 5 close parentheses

      • Show the x-intercepts of 2 and 5

      • These come from solving open parentheses x minus 2 close parentheses open parentheses x minus 5 close parentheses equals 0

    • As the inequality is greater or equal than 0, shade any parts of the curve that are above the x-axis

      • These are left of x equals 2 and right of x equals 5

    • The solutions are the ranges on the x-axis for those shaded parts

      • x less or equal than 2 or x greater or equal than 5

      • Use the word "or" for two separate parts

      • In set notation this is open curly brackets x colon space x less or equal than 2 close curly brackets union open curly brackets x colon space x greater or equal than 5 close curly brackets

Graph of quadratic inequality (x-2)(x-5) ≥ 0, showing shading for x ≤ 2 and x ≥ 5, and the quadratic function y = (x-2)(x-5) plotted, crossing x at 2 and 5.

What do I do if the sign of the inequality changes?

  • If the quadratic inequality is a x squared plus b x plus c greater or equal than 0 where a is positive

    • then shade the parts of the curve above the x-axis

  • If the quadratic inequality is a x squared plus b x plus c less or equal than 0 where a is positive

    • then shade the part of the curve below the x-axis

  • For example, to solve open parentheses x minus 2 close parentheses open parentheses x minus 5 close parentheses less or equal than 0

    • Repeat the process above but shade where the curve is below the x-axis

      • The solution is 2 less or equal than x less or equal than 5

      • (You do not use the word "or", but could say x greater or equal than 2 "and" x less or equal than 5)

      • In set notation this is open curly brackets x colon space x greater or equal than 2 close curly brackets intersection open curly brackets x colon space x less or equal than 5 close curly brackets, or alternatively open curly brackets x colon space 2 less or equal than x less or equal than 5 close curly brackets

Graph depicting the quadratic inequality (x - 2)(x - 5) ≤ 0. The highlighted area shows y = (x - 2)(x - 5) between x = 2 and x = 5, inclusive.
  • If strict inequality signs are used, greater than or less than

    • then you must use strict inequalities in your final answer

How can quadratic inequalities be made harder?

  • You may need to bring all the terms to one side first

    • For example x squared minus x less than 6 becomes x squared minus x minus 6 less than 0

      • It is easier to pick the side with a positive x squared

  • You may have to factorise the quadratic inequality first

    • This may involve factorising

      • a x squared plus b x plus c into double brackets

      • a squared x squared minus b squared equals open parentheses a x plus b close parentheses open parentheses a x minus b close parentheses (the difference of two squares)

      • a x squared plus b x equals x open parentheses a x plus b close parentheses (factorising out an x)

    • If it does not factorise, you may need the quadratic formula to find x-intercepts

  • You may be given a quadratic inequality a x squared plus b x plus c greater or equal than 0 where a is negative

    • This means the sketch will be an intersection shape

  • For example, solve 4 minus x squared greater than 0

    • The x intercepts are found from 4 minus x squared equals 0 giving x equals plus-or-minus 2

    • The same process is then applied, but the graph has an intersection shape

Graph of quadratic inequality 4 - x^2 > 0. The shaded region above y = 4 - x^2 shows valid x values between -2 and 2, excluding the endpoints.

Examiner Tips and Tricks

Think of inequalities with x squared terms as graph-sketching questions in the exam.

Worked Example

Solve 2 x squared minus 2 x plus 5 greater than 9.

Bring all the terms to one side
It is easiest to use the left-hand side (giving a positive x squared term)

table row cell 2 x squared minus 2 x plus 5 minus 9 end cell greater than 0 row cell 2 x squared minus 2 x minus 4 end cell greater than 0 end table

Simplify the inequality by dividing both sides by 2

table row cell x squared minus x minus 2 end cell greater than 0 end table

Factorise the quadratic expression on the left-hand side

open parentheses x plus 1 close parentheses open parentheses x minus 2 close parentheses greater than 0

Find the x-intercepts of the graph y equals open parentheses x plus 1 close parentheses open parentheses x minus 2 close parentheses
To do this, solve open parentheses x plus 1 close parentheses open parentheses x minus 2 close parentheses equals 0

open parentheses x plus 1 close parentheses open parentheses x minus 2 close parentheses equals 0 gives x equals negative 1 or x equals 2

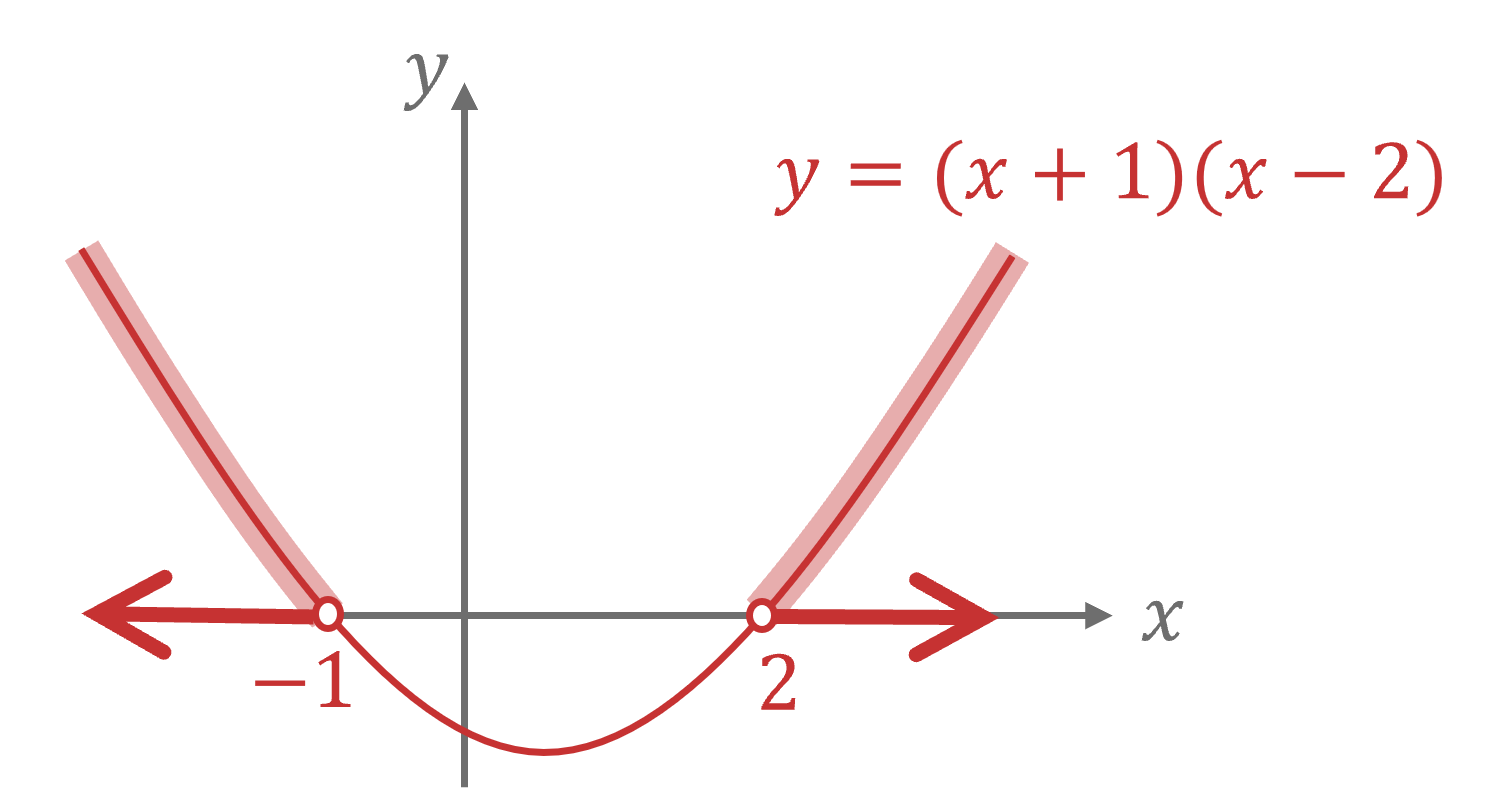
Sketch y equals open parentheses x plus 1 close parentheses open parentheses x minus 2 close parentheses (showing the x-intercepts of -1 and 2)
The inequality is ... greater than 0 so shade the parts of the curve above the x-axis

Graph of y = (x + 1)(x - 2) showing a parabola intersecting the x-axis at x = -1 and x = 2. The region shaded represents the quadratic inequality shown.

Write down the ranges on the x-axis for the shaded parts above
Use the word "or" to separate the two solutions

x less than negative 1 or x greater than 2

In set notation, the answer would be open curly brackets x colon space x less than negative 1 close curly brackets union open curly brackets x colon space x greater than 2 close curly brackets

You've read 0 of your 5 free revision notes this week

Sign up now. It’s free!

Join the 100,000+ Students that ❤️ Save My Exams

the (exam) results speak for themselves:

Did this page help you?

Mark Curtis

Author: Mark Curtis

Expertise: Maths

Mark graduated twice from the University of Oxford: once in 2009 with a First in Mathematics, then again in 2013 with a PhD (DPhil) in Mathematics. He has had nine successful years as a secondary school teacher, specialising in A-Level Further Maths and running extension classes for Oxbridge Maths applicants. Alongside his teaching, he has written five internal textbooks, introduced new spiralling school curriculums and trained other Maths teachers through outreach programmes.

Dan Finlay

Author: Dan Finlay

Expertise: Maths Lead

Dan graduated from the University of Oxford with a First class degree in mathematics. As well as teaching maths for over 8 years, Dan has marked a range of exams for Edexcel, tutored students and taught A Level Accounting. Dan has a keen interest in statistics and probability and their real-life applications.