This task looks at models for daily road traffic on a circular ring road around a city.
To help reduce the amount of traffic, the mayor of the city has implemented a new daily driving charge on the ring road, which will last for a year.
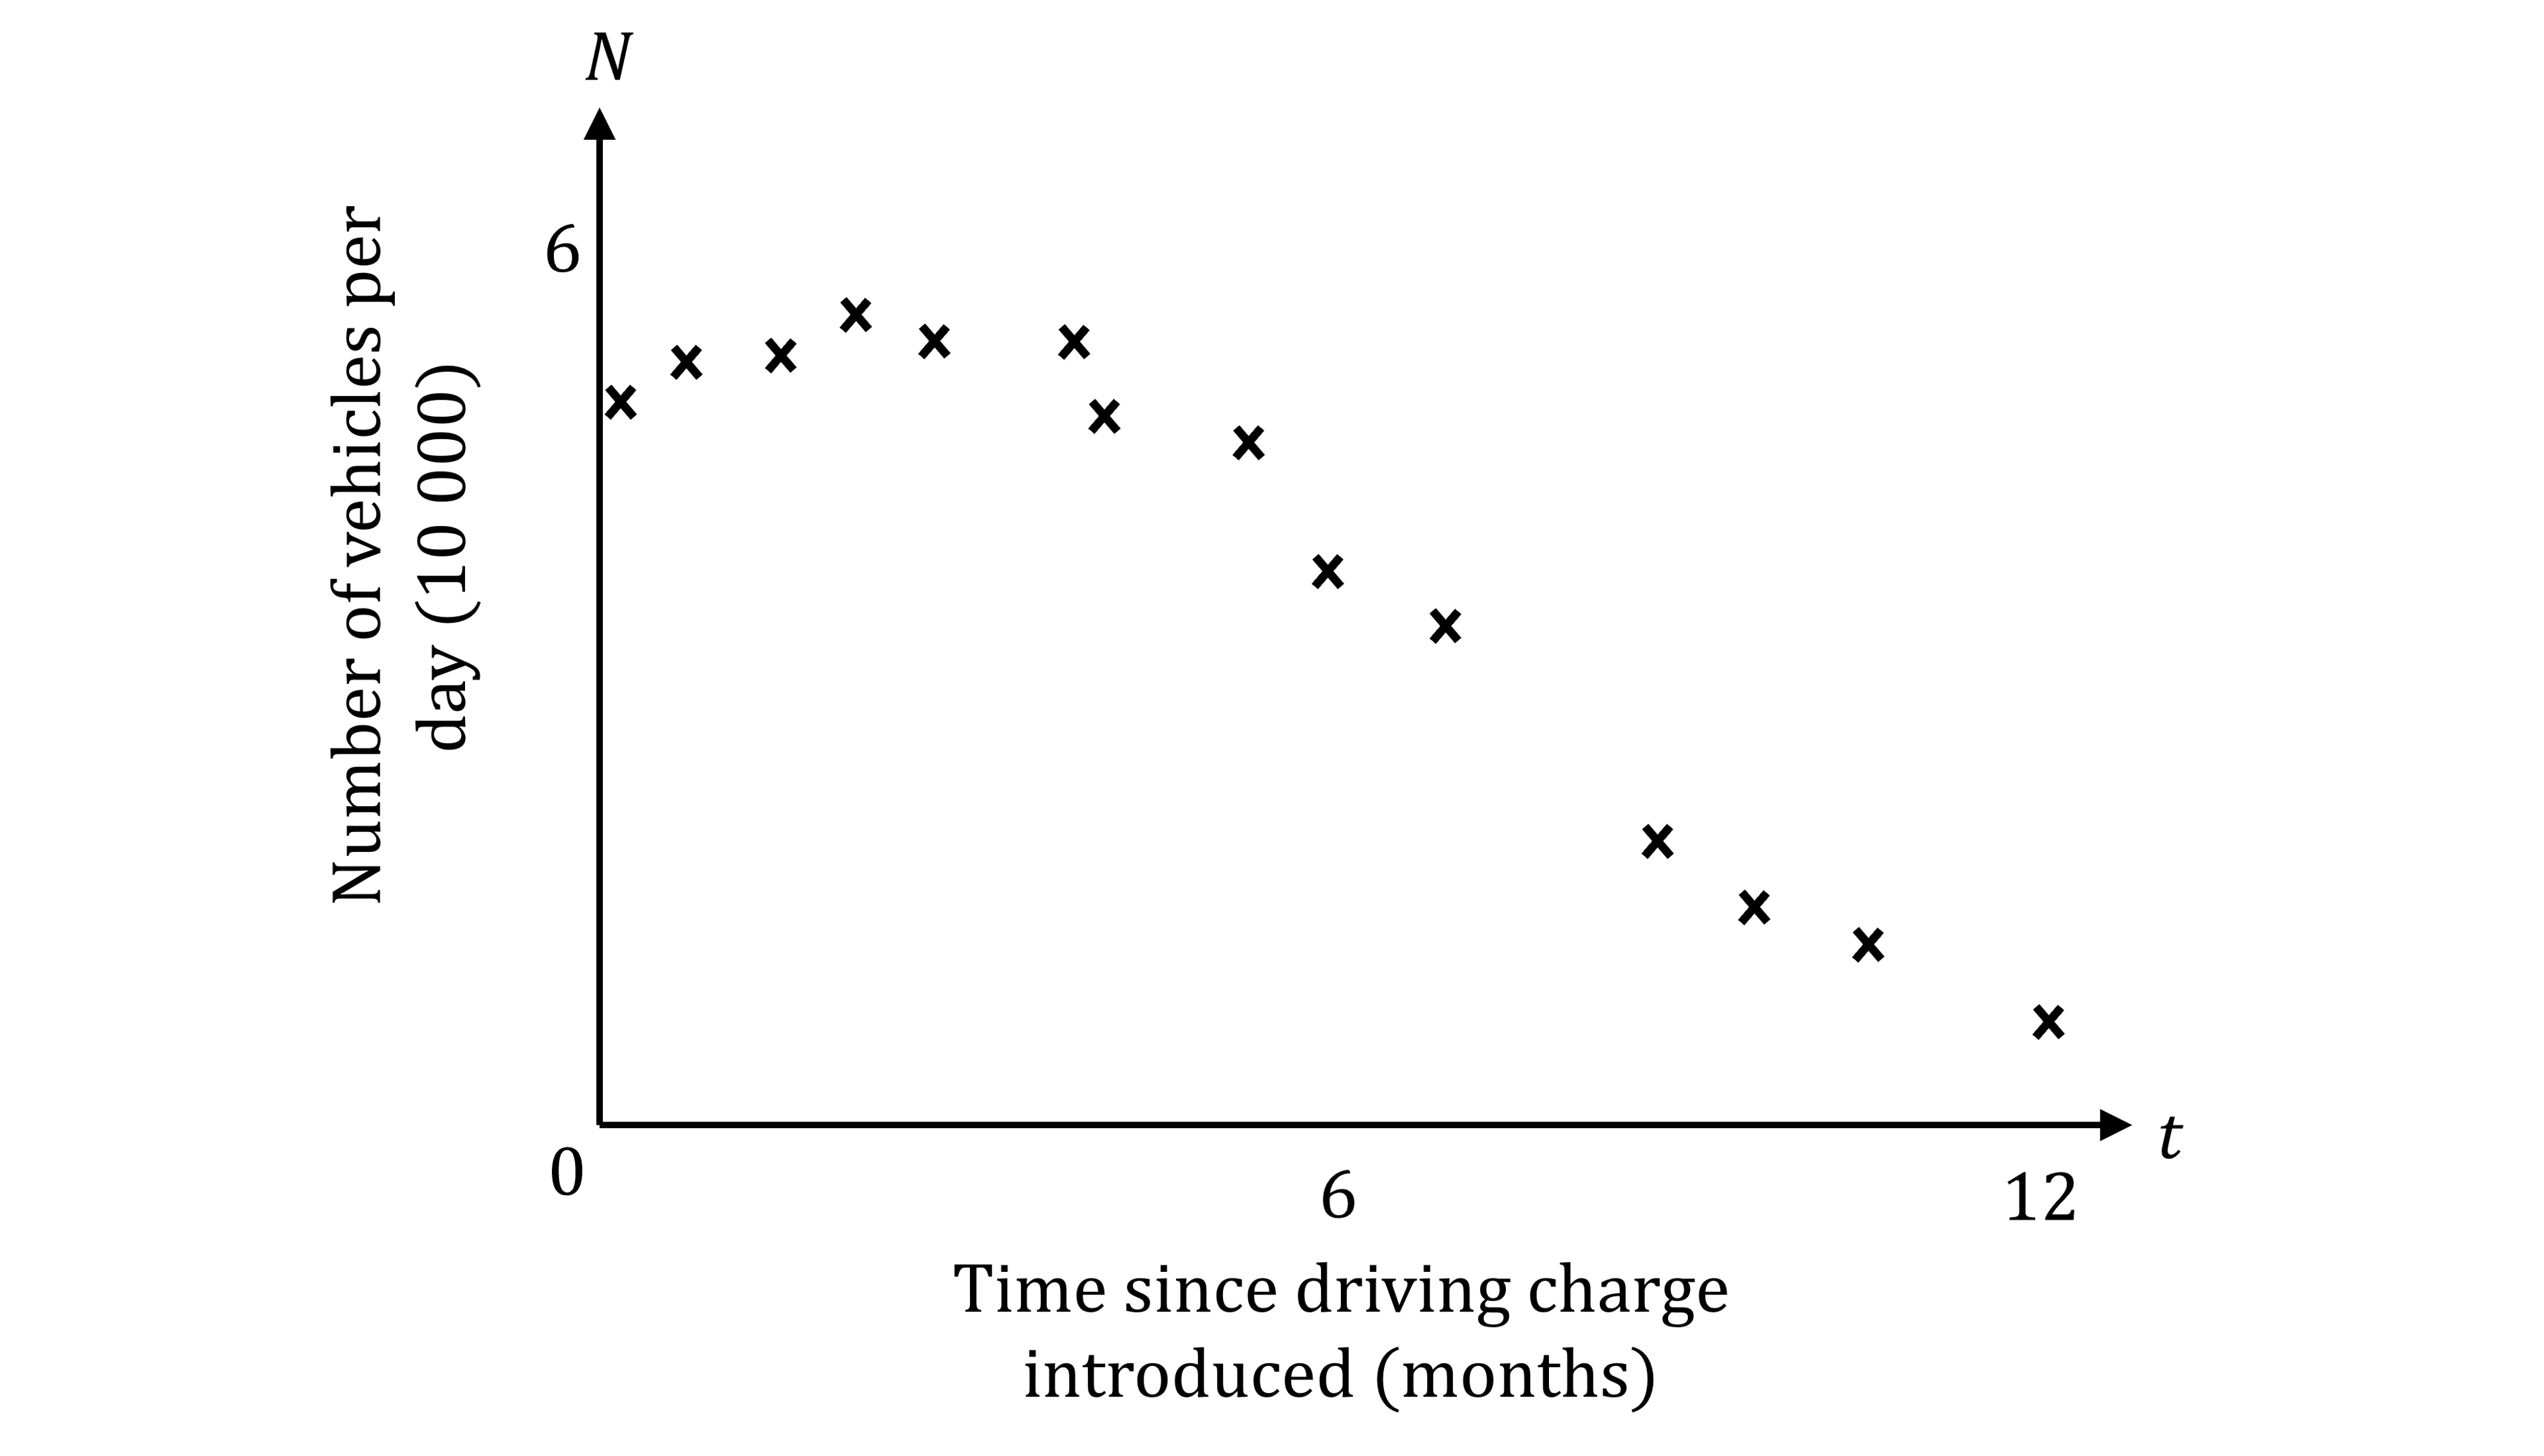
The scatter graph below shows the number of vehicles per day, ![]() , measured in tens of thousands, that use the ring road against the time,
, measured in tens of thousands, that use the ring road against the time, ![]() , measured in months, from the date of the driving charge being introduced.
, measured in months, from the date of the driving charge being introduced.
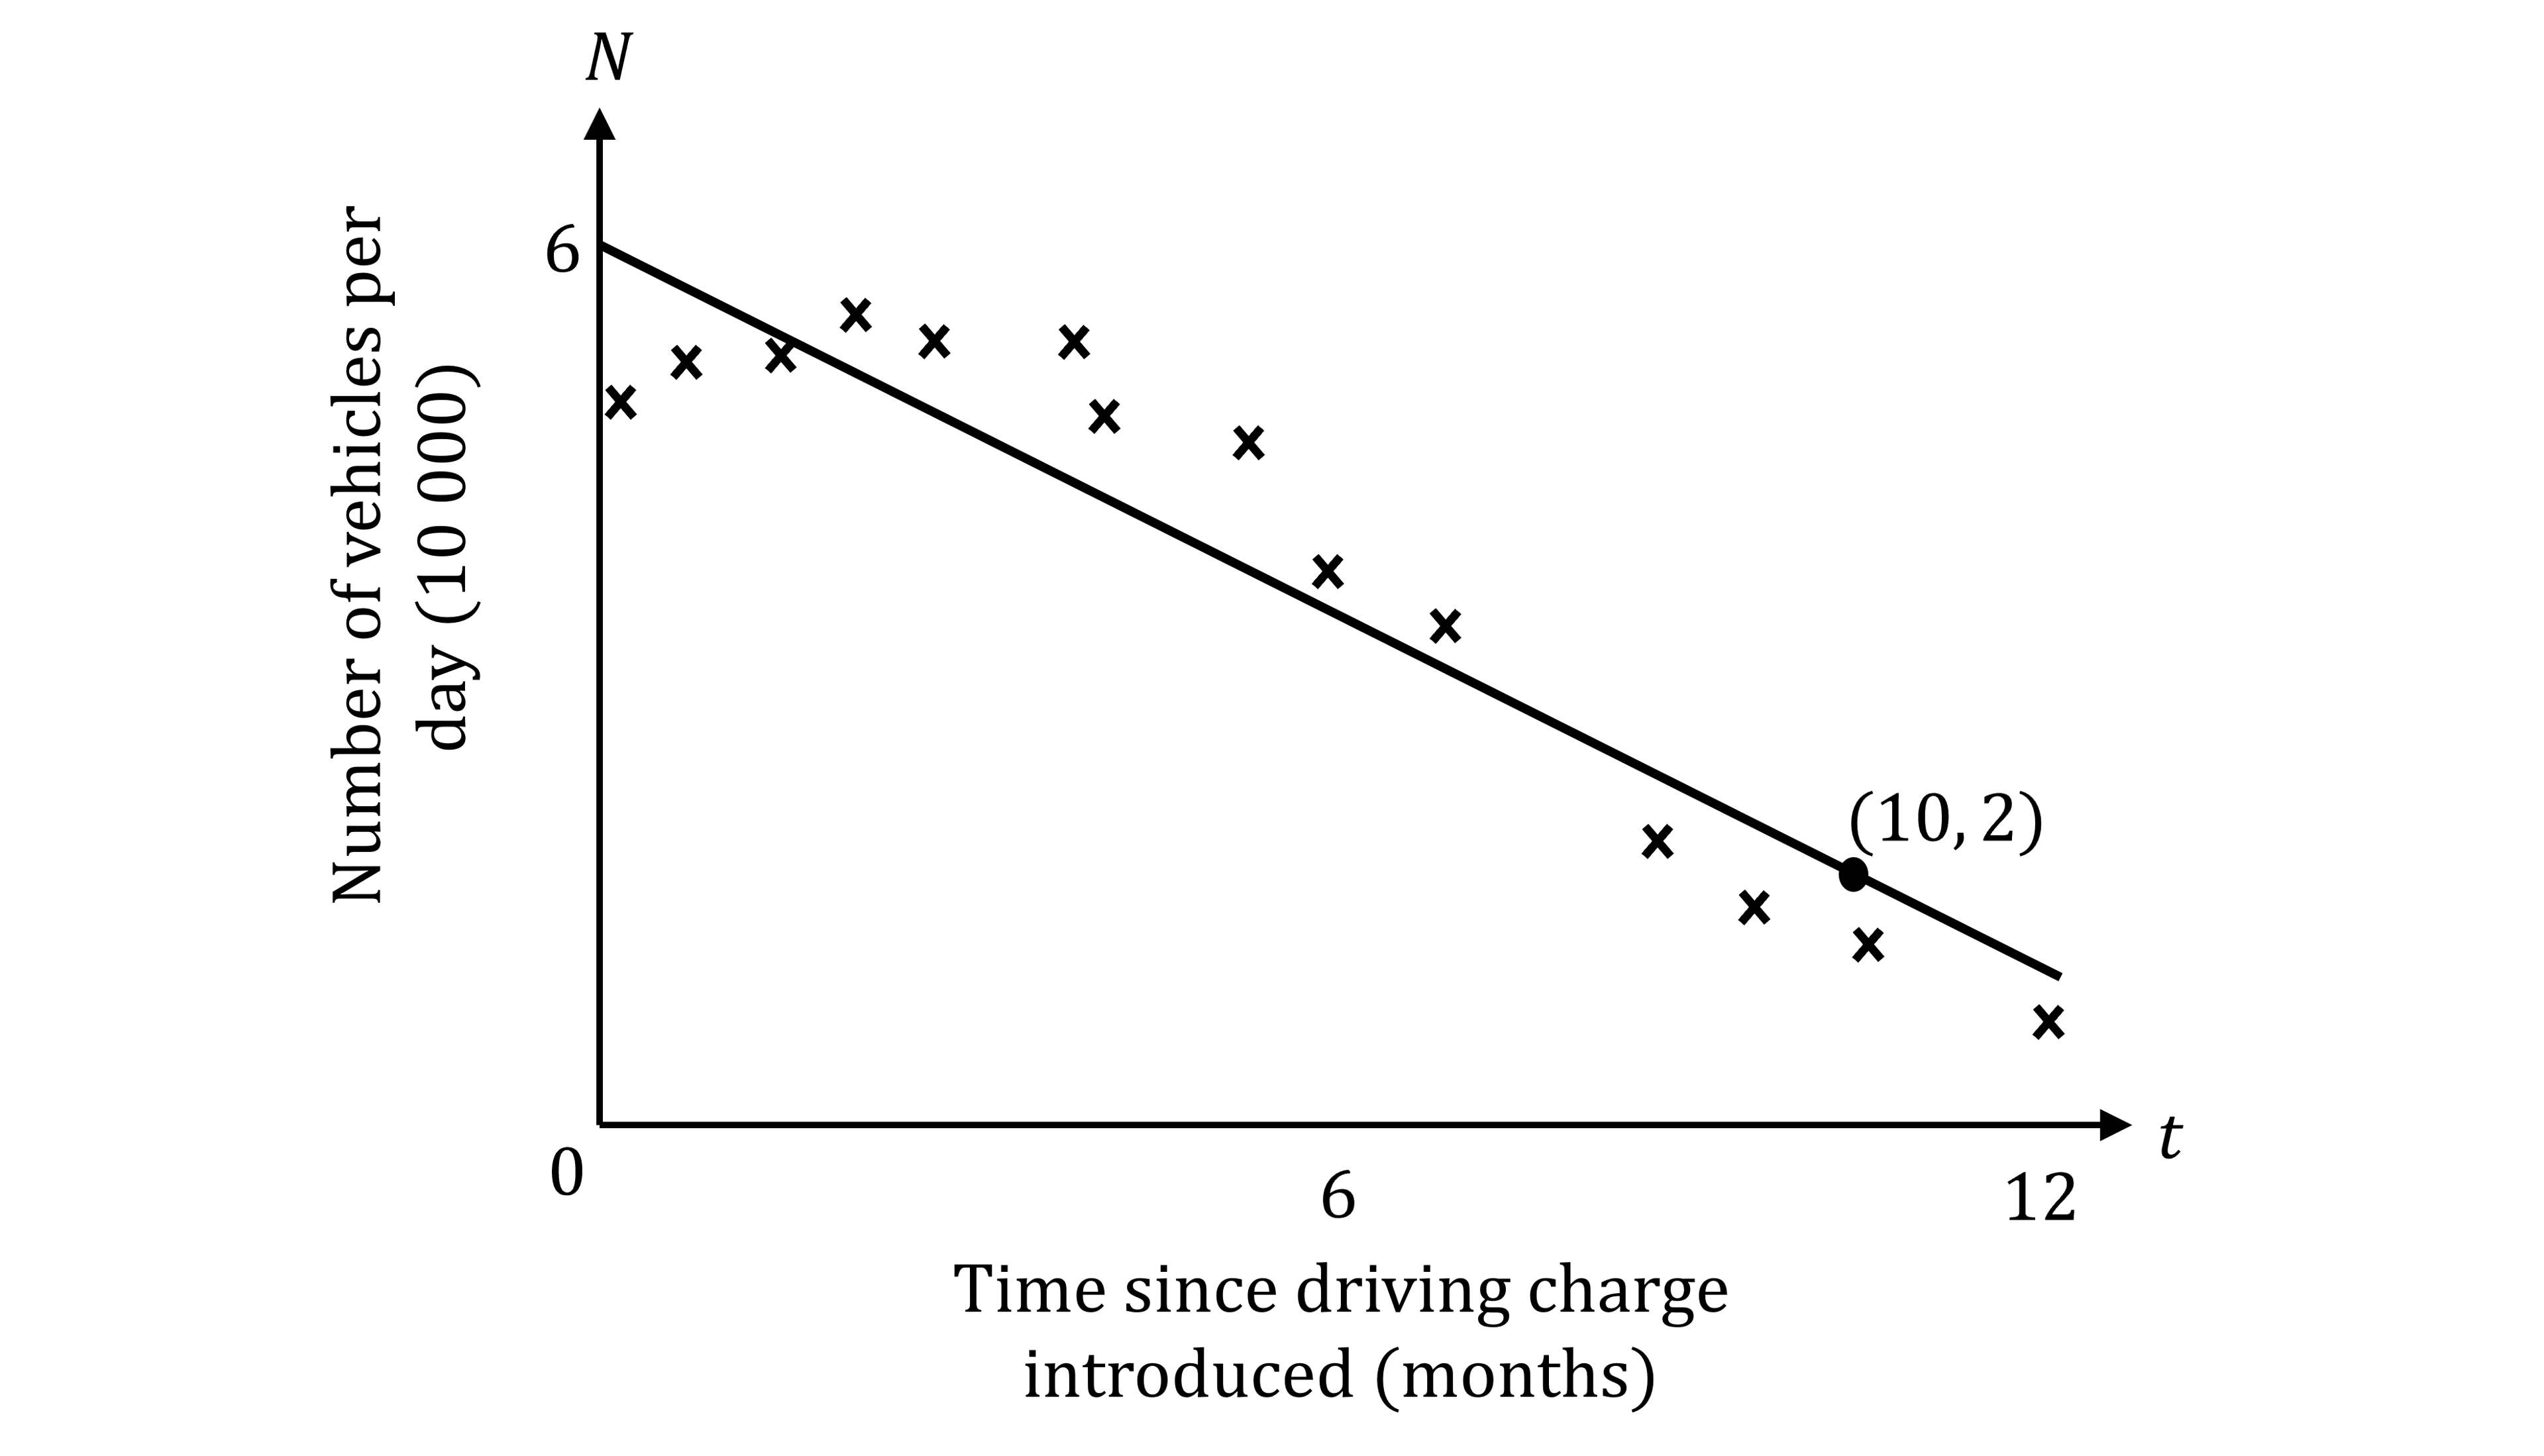
A simple model to relate ![]() and
and ![]() is given by the line of best fit:
is given by the line of best fit:
![]()
The line of best fit intersects the ![]() -axis at the point
-axis at the point ![]() and passes through the point
and passes through the point ![]() , as shown.
, as shown.
Use this information to find the values of ![]() and
and ![]() .
.
Use the model in part (a) to predict the total number of vehicles per day on the ring road 7 months after the driving charge was introduced.
Explain, with reason, whether or not the line of best fit should be continued beyond 12 months.
Was this exam question helpful?

