Using Calculators to Sketch Graphs (Cambridge (CIE) IGCSE International Maths)
Revision Note

Using Calculators to Sketch Graphs
How do I draw graphs on my graphic display calculator?
Navigate on your calculator to the Add Graphs button
You may need to start a new document first
On some models you will need to select graph mode in the menu
Enter the equation of the function on the line f(x)=
This is the function,
format('truetype')%3Bfont-weight%3Anormal%3Bfont-style%3Anormal%3B%7D%3C%2Fstyle%3E%3C%2Fdefs%3E%3Ctext%20font-family%3D%22Times%20New%20Roman%22%20font-size%3D%2218%22%20text-anchor%3D%22middle%22%20x%3D%223.5%22%20y%3D%2216%22%3Ef%3C%2Ftext%3E%3Ctext%20font-family%3D%22round_brackets18549f92a457f2409%22%20font-size%3D%2218%22%20text-anchor%3D%22middle%22%20x%3D%2211.5%22%20y%3D%2216%22%3E(%3C%2Ftext%3E%3Ctext%20font-family%3D%22round_brackets18549f92a457f2409%22%20font-size%3D%2218%22%20text-anchor%3D%22middle%22%20x%3D%2226.5%22%20y%3D%2216%22%3E)%3C%2Ftext%3E%3Ctext%20font-family%3D%22Times%20New%20Roman%22%20font-size%3D%2218%22%20font-style%3D%22italic%22%20text-anchor%3D%22middle%22%20x%3D%2218.5%22%20y%3D%2216%22%3Ex%3C%2Ftext%3E%3C%2Fsvg%3E)
On other models it may be labelled as f1(x)= or Y1:
Press enter or EXE and the graph should appear
You may need to go to the menu or press the zoom button to zoom in or out
The "zoom - fit" button (or equivalent) automatically zooms for you on the key features
Other models may also have a "V-Window" menu where you can select the exact range of values to show
How do I find graph features using my graphic display calculator?
Once the graph is drawn, go to the menu and select analyze graph (or equivalent), which gives a list of options
Other models may feature a G-Solv button
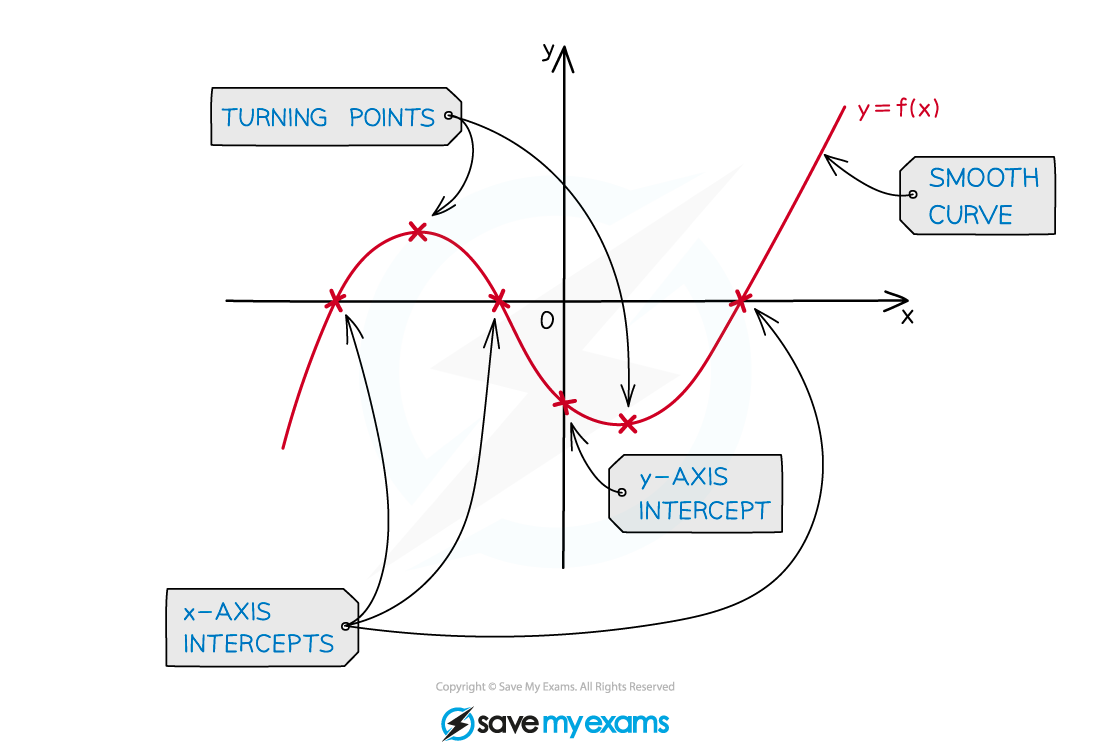
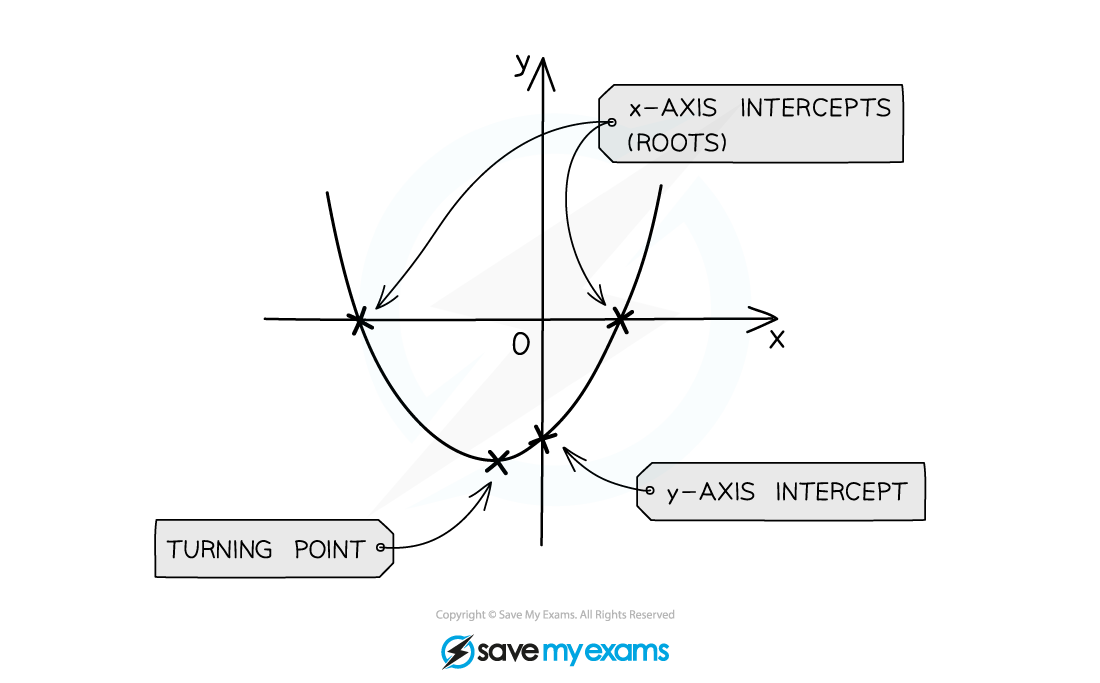
Zeros (or roots): these are the x-intercepts
You may have to click before and after the x-intercept you require so that the calculator knows where to search
y-intercepts can be found without a calculator by substituting
format('truetype')%3Bfont-weight%3Anormal%3Bfont-style%3Anormal%3B%7D%3C%2Fstyle%3E%3C%2Fdefs%3E%3Ctext%20font-family%3D%22Times%20New%20Roman%22%20font-size%3D%2218%22%20font-style%3D%22italic%22%20text-anchor%3D%22middle%22%20x%3D%224.5%22%20y%3D%2216%22%3Ex%3C%2Ftext%3E%3Ctext%20font-family%3D%22math17f39f8317fbdb1988ef4c628eb%22%20font-size%3D%2216%22%20text-anchor%3D%22middle%22%20x%3D%2218.5%22%20y%3D%2216%22%3E%3D%3C%2Ftext%3E%3Ctext%20font-family%3D%22Times%20New%20Roman%22%20font-size%3D%2218%22%20text-anchor%3D%22middle%22%20x%3D%2231.5%22%20y%3D%2216%22%3E0%3C%2Ftext%3E%3C%2Fsvg%3E) into
into though some models do include a Y-ICEPT button which can be used
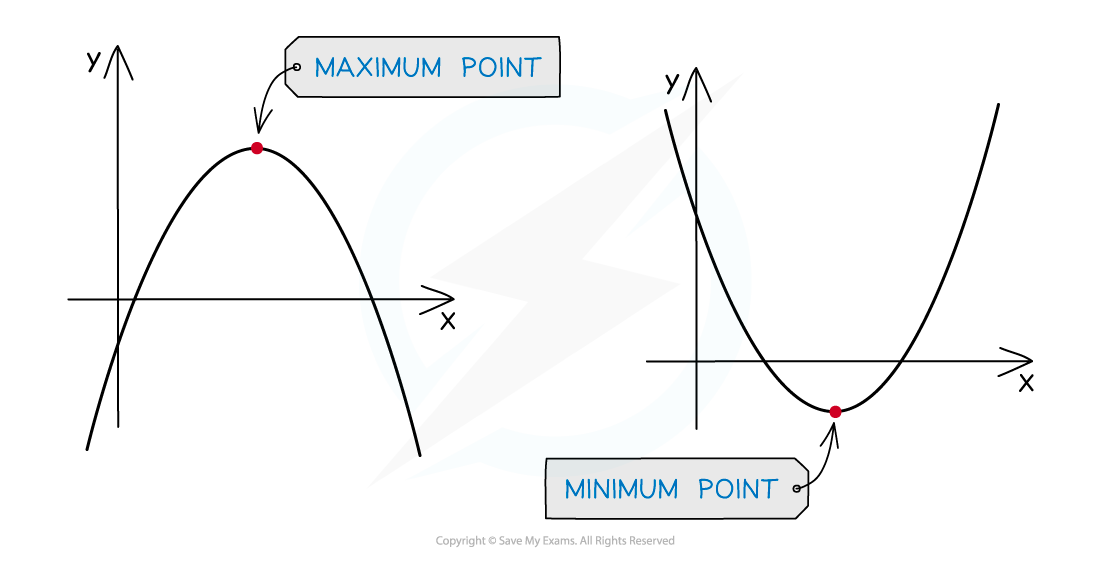
Maximum or minimum points: these are the coordinates of the highest point and lowest point on the graph
You may have to click before and after the point you require so that the calculator knows where to search
These can be called local maxima or local minima
They are also referred to as turning points
or the vertex if talking about a quadratic graph
How do I sketch a graph in the exam from my graphic display calculator?
Exam questions may ask you to sketch the graph on a given blank set of axes
You do not need to plot points exactly
and you do not need a table of values
Draw a single smooth freehand curve that copies the shape of the curve on your graphic display calculator
Do not use a ruler for curves!
Copy any key features and symmetries
Exam questions may ask you to use your calculator to sketch an unknown function that you have not seen before
How do I create a table of values on my graphic display calculator?
Your calculator can create tables of values for you, if needed
Find the table function
Type in the graph equation (the function, f(x)=)
Enter the start value (or equivalent)
The first x-value in the table
Enter the end value (or equivalent)
The last x-value in the table
Enter the step size (or equivalent)
How big the steps (gaps) are from one x-value to the next
You may have to select SET to set the above values
Press enter or EXE to see the table of values
Exam Tip
Exam questions will say "draw this graph on your calculator" to make it clear when using a calculator is intended
Worked Example
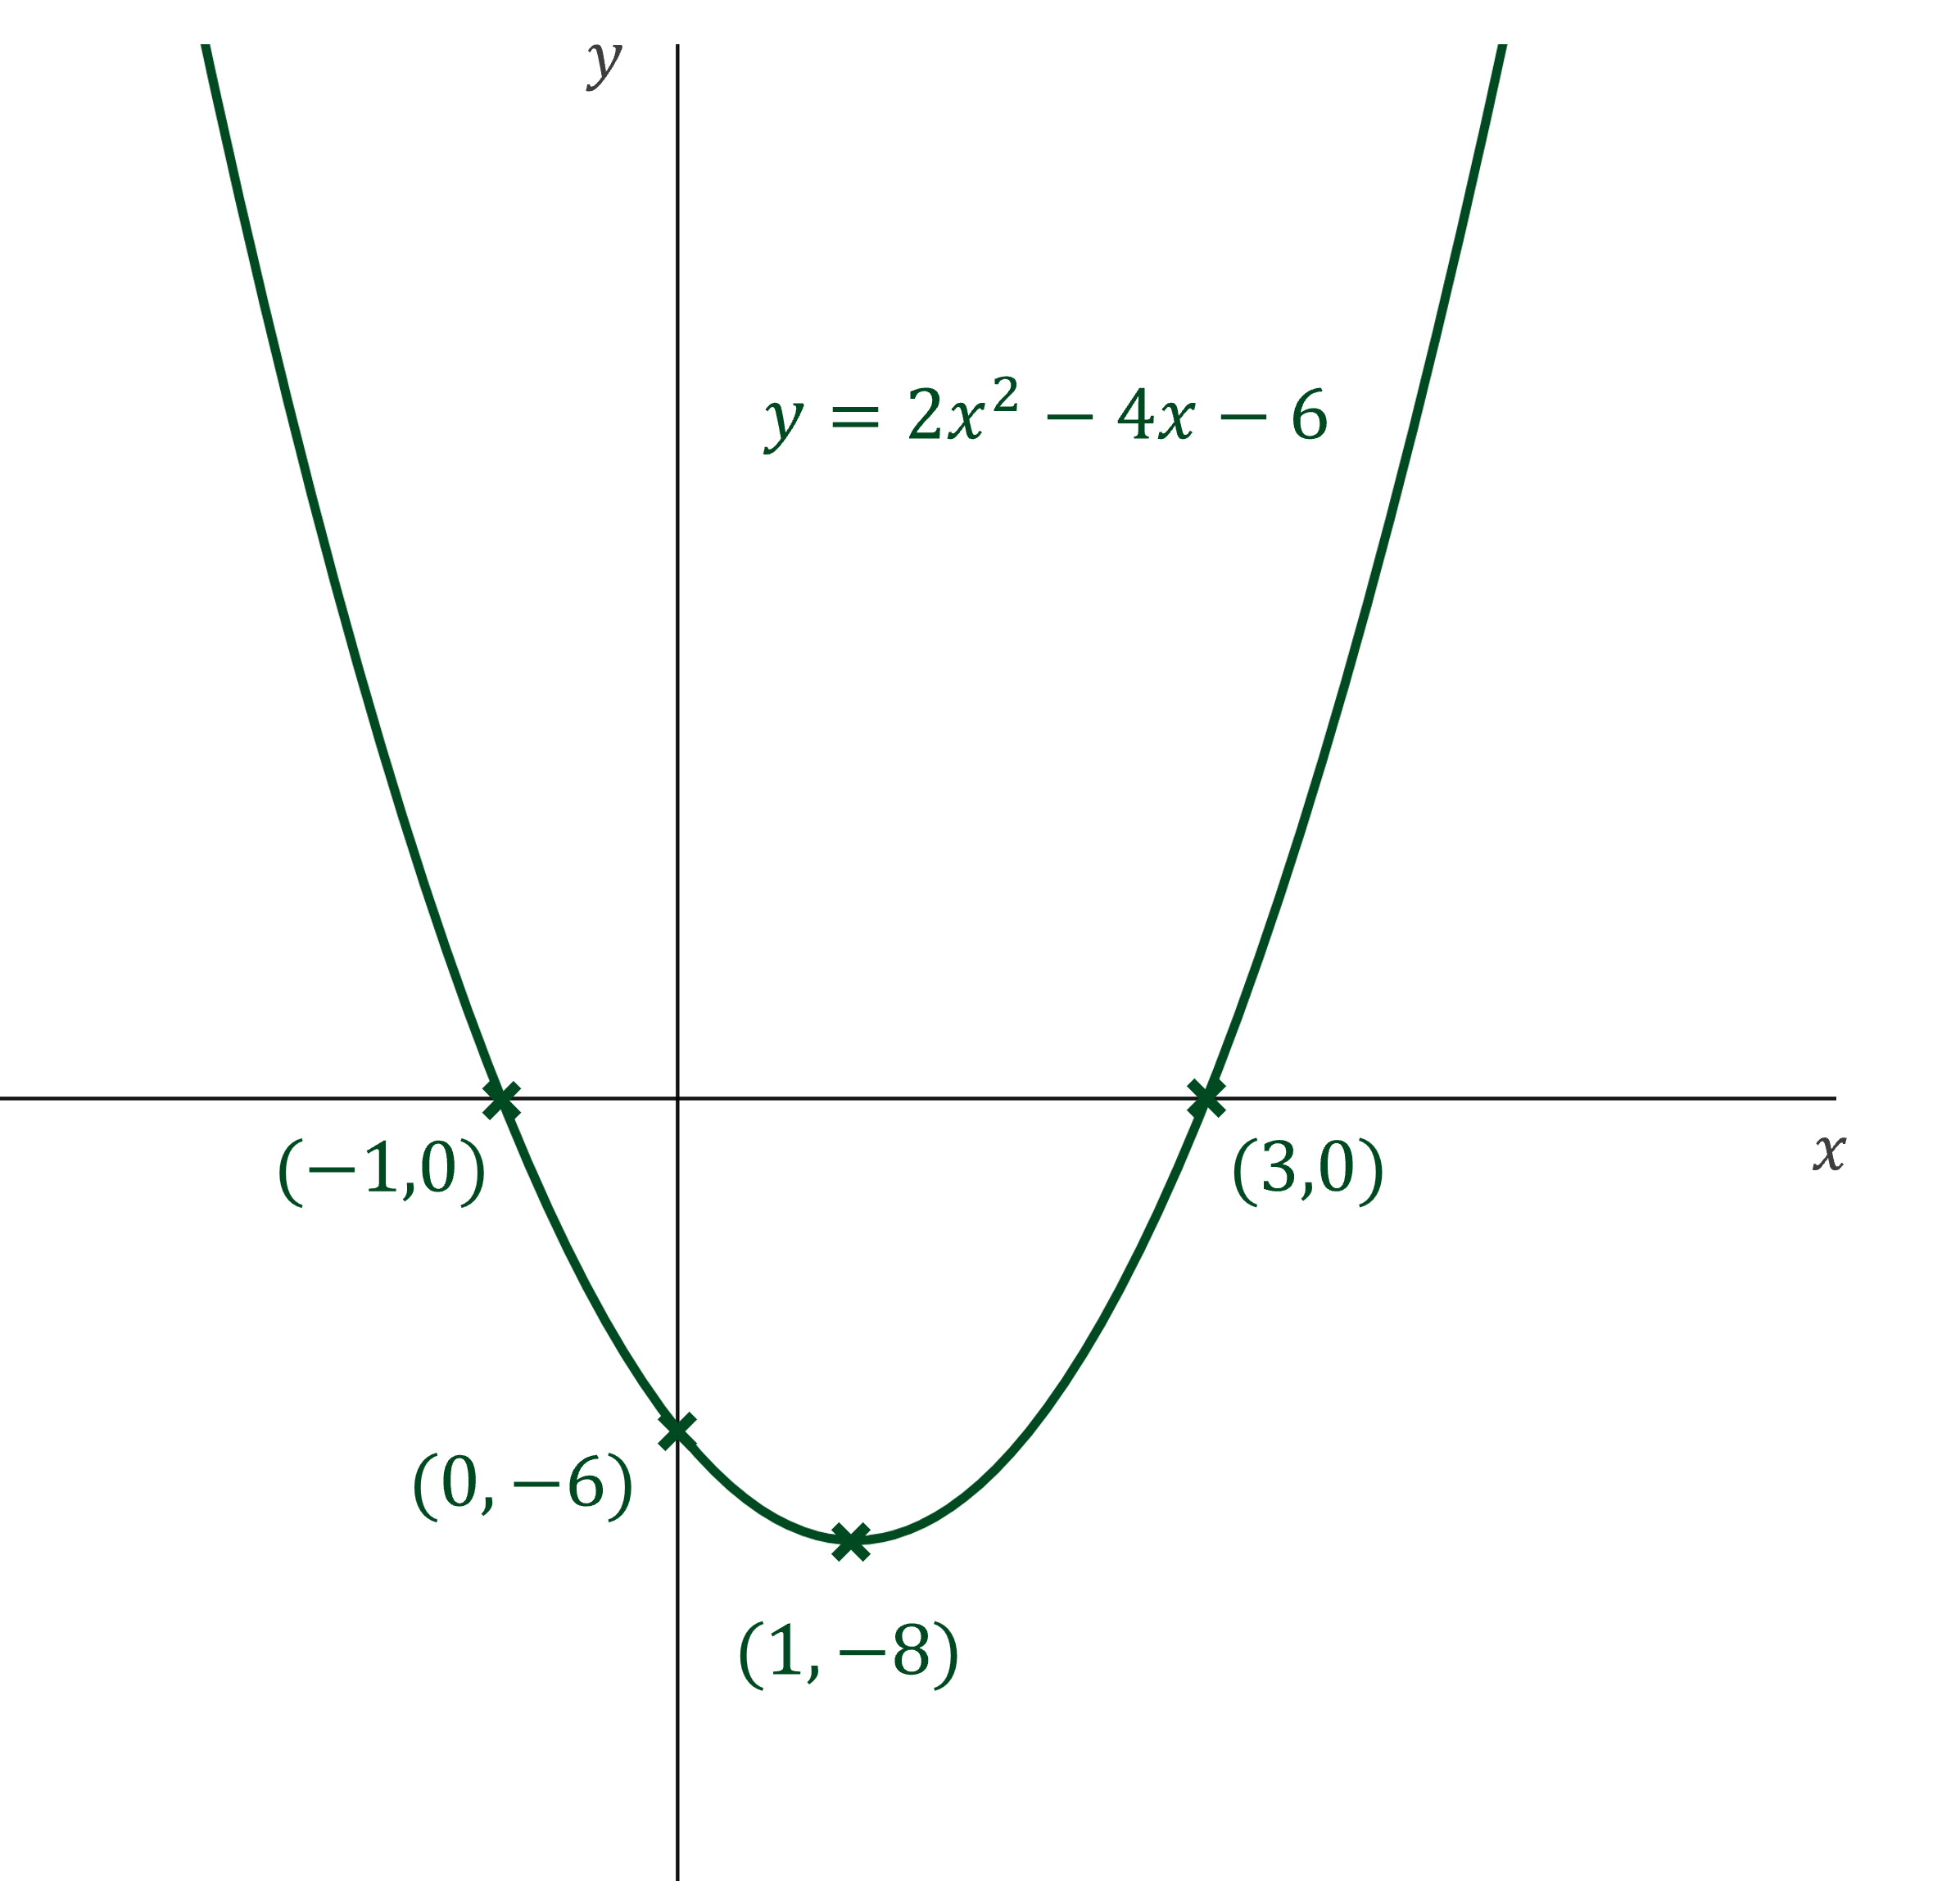
(a) Draw the graph of ![]() on your calculator and use it to sketch the curve on the axes provided, showing coordinates of all axes intercepts and any maximum or minimum points.
on your calculator and use it to sketch the curve on the axes provided, showing coordinates of all axes intercepts and any maximum or minimum points.
Start a new graph on your calculator and enter ![]() to generate the graph
to generate the graph
This shows the curve has a minimum point (not a maximum point)
Select the option to "analyze" the graph (this may be labelled as G-Solv)
Choose the option "zeros" (or roots) to find the x-intercepts
Choose the option "minimum" (or equivalent) to find the coordinates of the minimum point
The question asks for all axes intercepts, so this includes the y-intercept
Substitute ![]() into
into ![]() to get -6
to get -6
(or you can use the Y-ICEPT button on some models)
Show all the above information on a sketch using coordinates
(b) Match the following curve equations to the sketches below. You may use your graphic display calculator in this question.
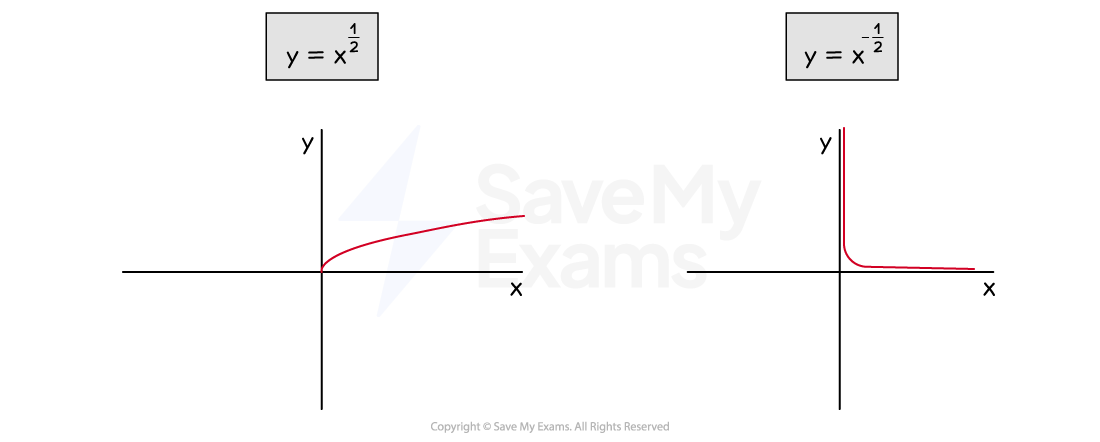
(1) ![]() (2)
(2) ![]() (3)
(3) ![]() (4)
(4) ![]() (5)
(5) ![]()
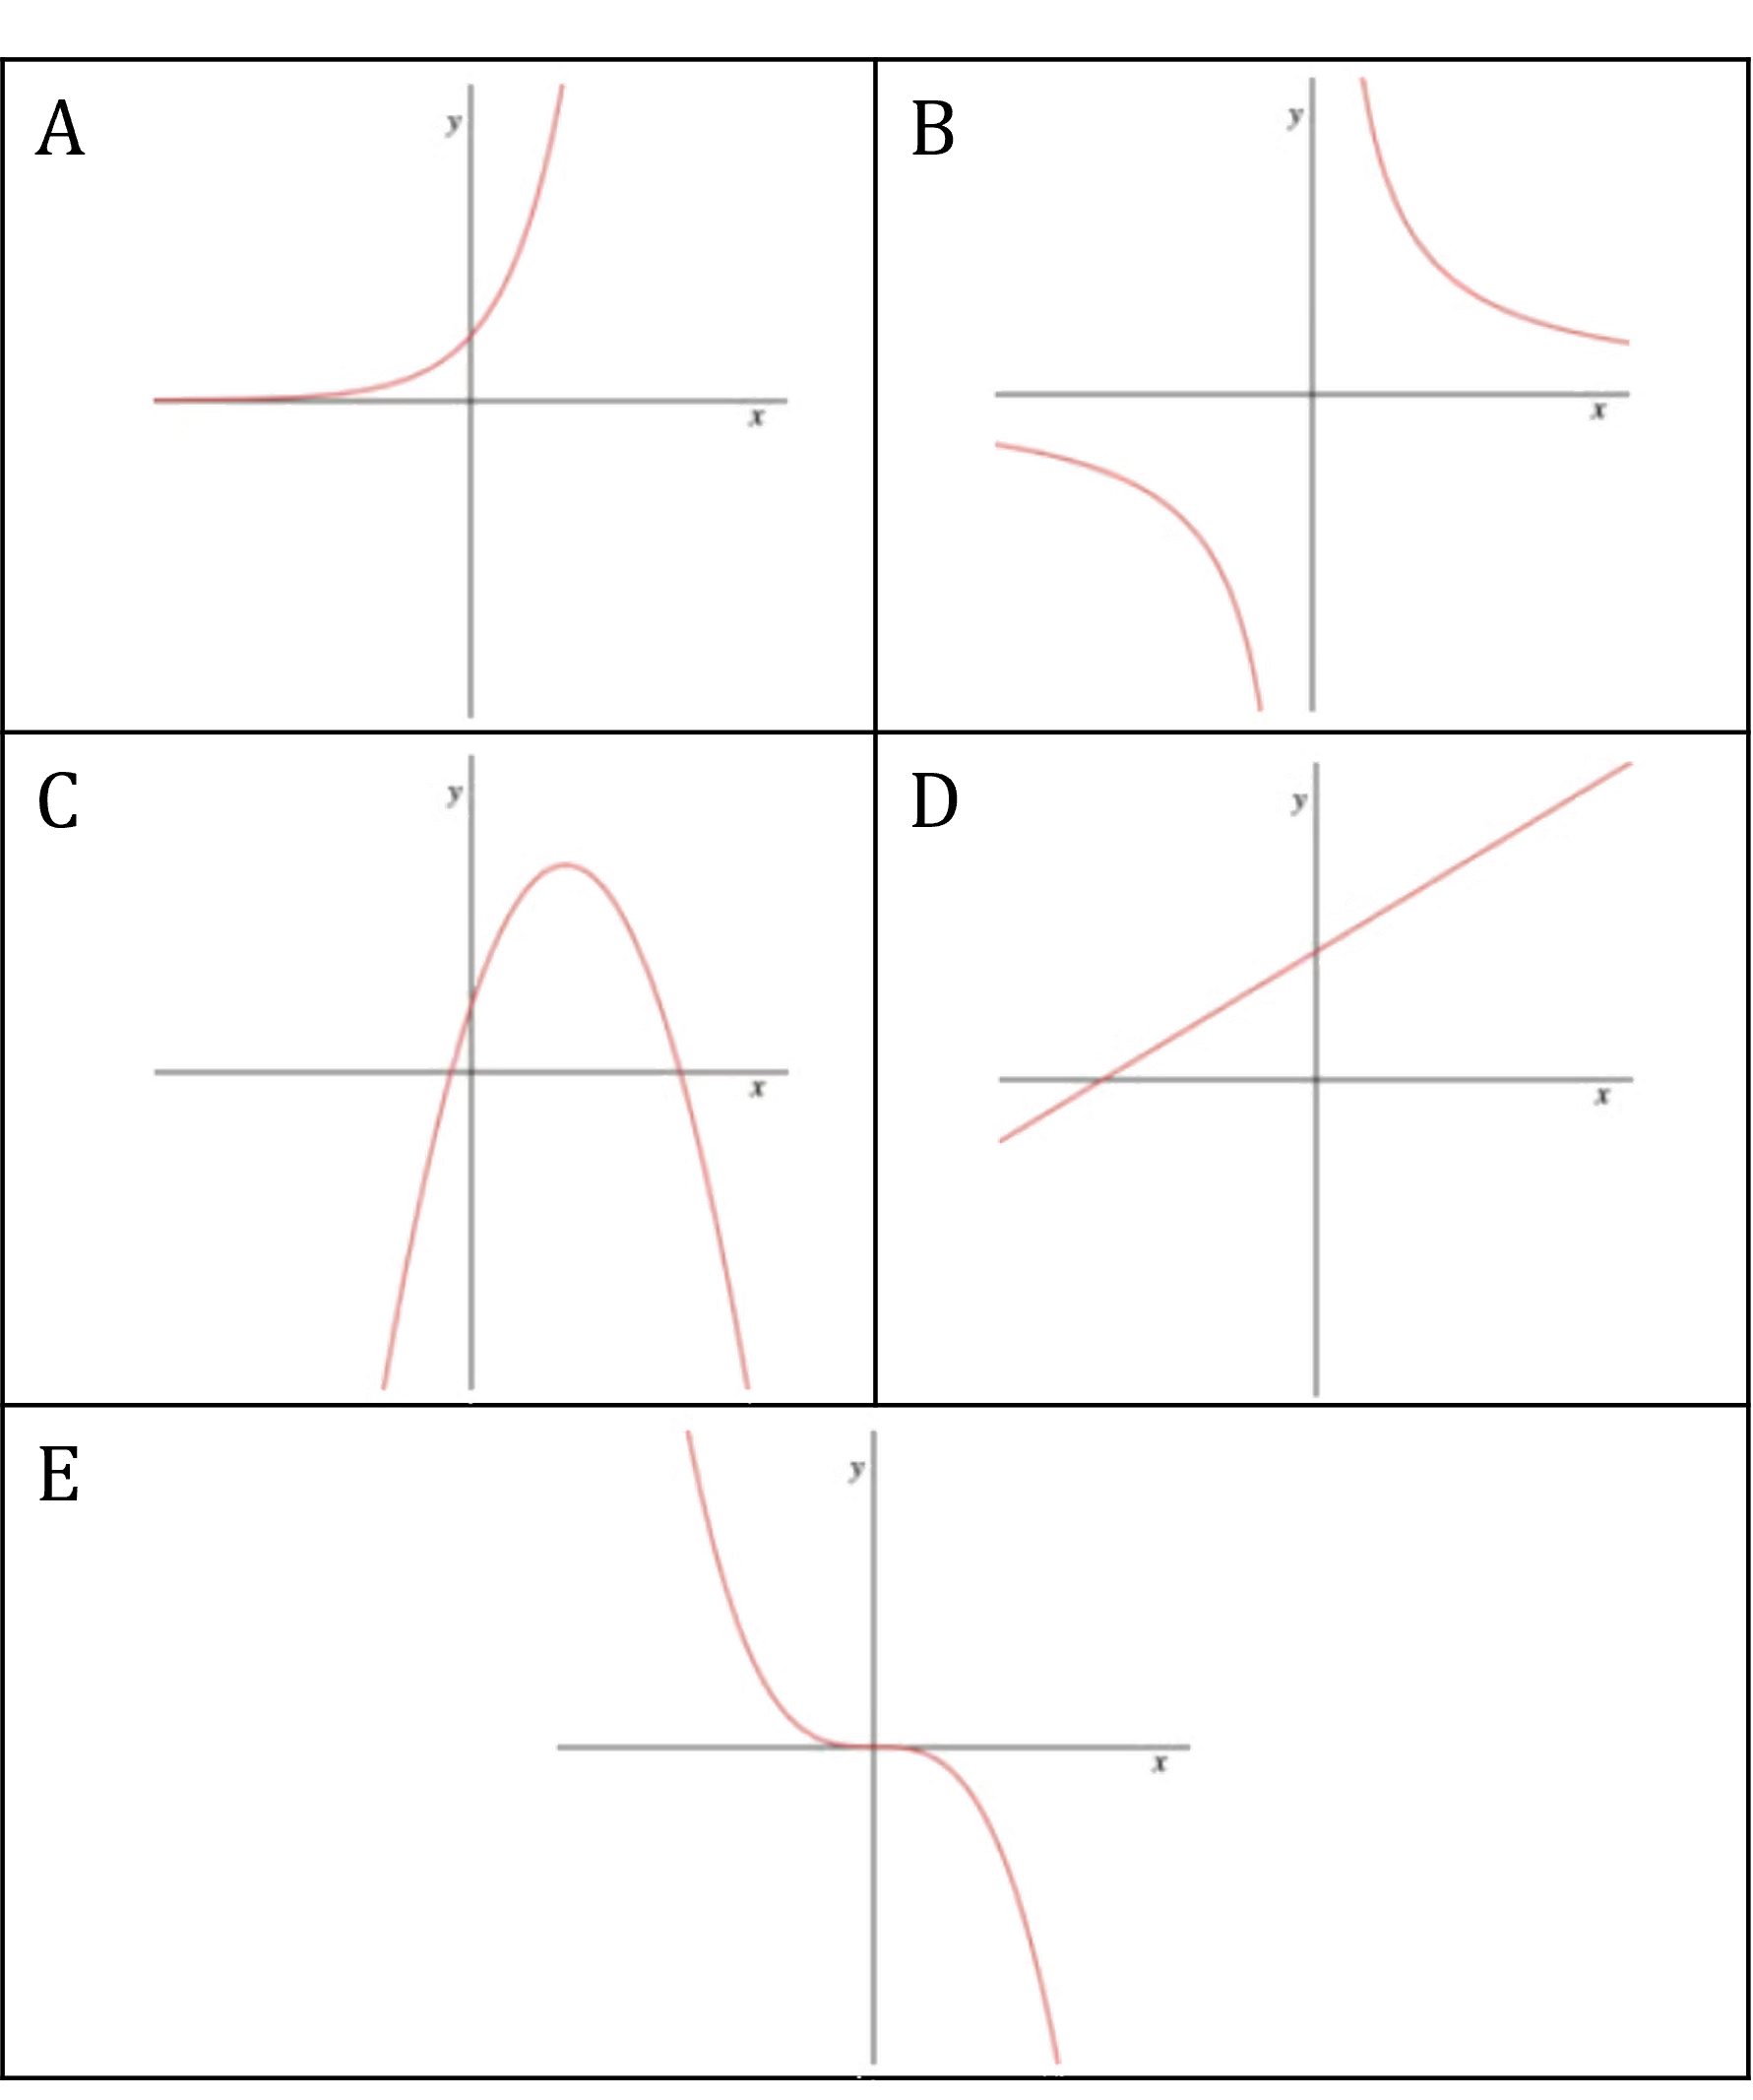
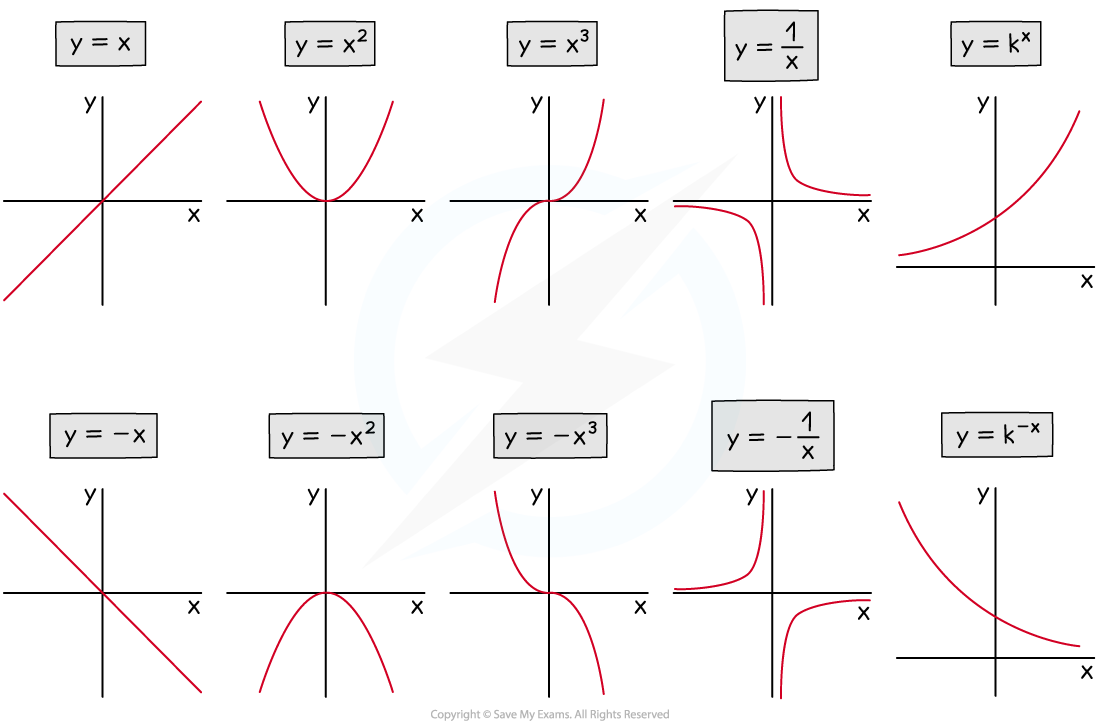
(1) is a straight line equation (y = mx + c) so must match graph D
(2) requires plotting on a graphic display calculator to see that it is A
(3) requires plotting on a graphic display calculator to see that it is E
(4) requires plotting on a graphic display calculator to see that it is B
(5) is a quadratic equation with a negative coefficient so matches graph C
When plotting these graphs on your calculator, you may need to use the zoom function or V-Window button to see the overall shapes of the graphs
(1) → D
(2) → A
(3) → E
(4) → B
(5) → C

You've read 0 of your 10 free revision notes
Unlock more, it's free!
Did this page help you?