Possibility (Sample Space) Diagrams (Cambridge (CIE) IGCSE Maths): Revision Note
Exam code: 0580 & 0980
Possibility Diagrams
What is a possibility diagram?
In probability, the sample space means all the possible outcomes
In simple situations it can be given as a list
For flipping a coin, the sample space is: Heads, Tails
the letters H, T can be used
For rolling a six-sided dice, the sample space is: 1, 2, 3, 4, 5, 6
If there are two sets of outcomes, a grid can be used
These are called possibility diagrams (or sample space diagrams)
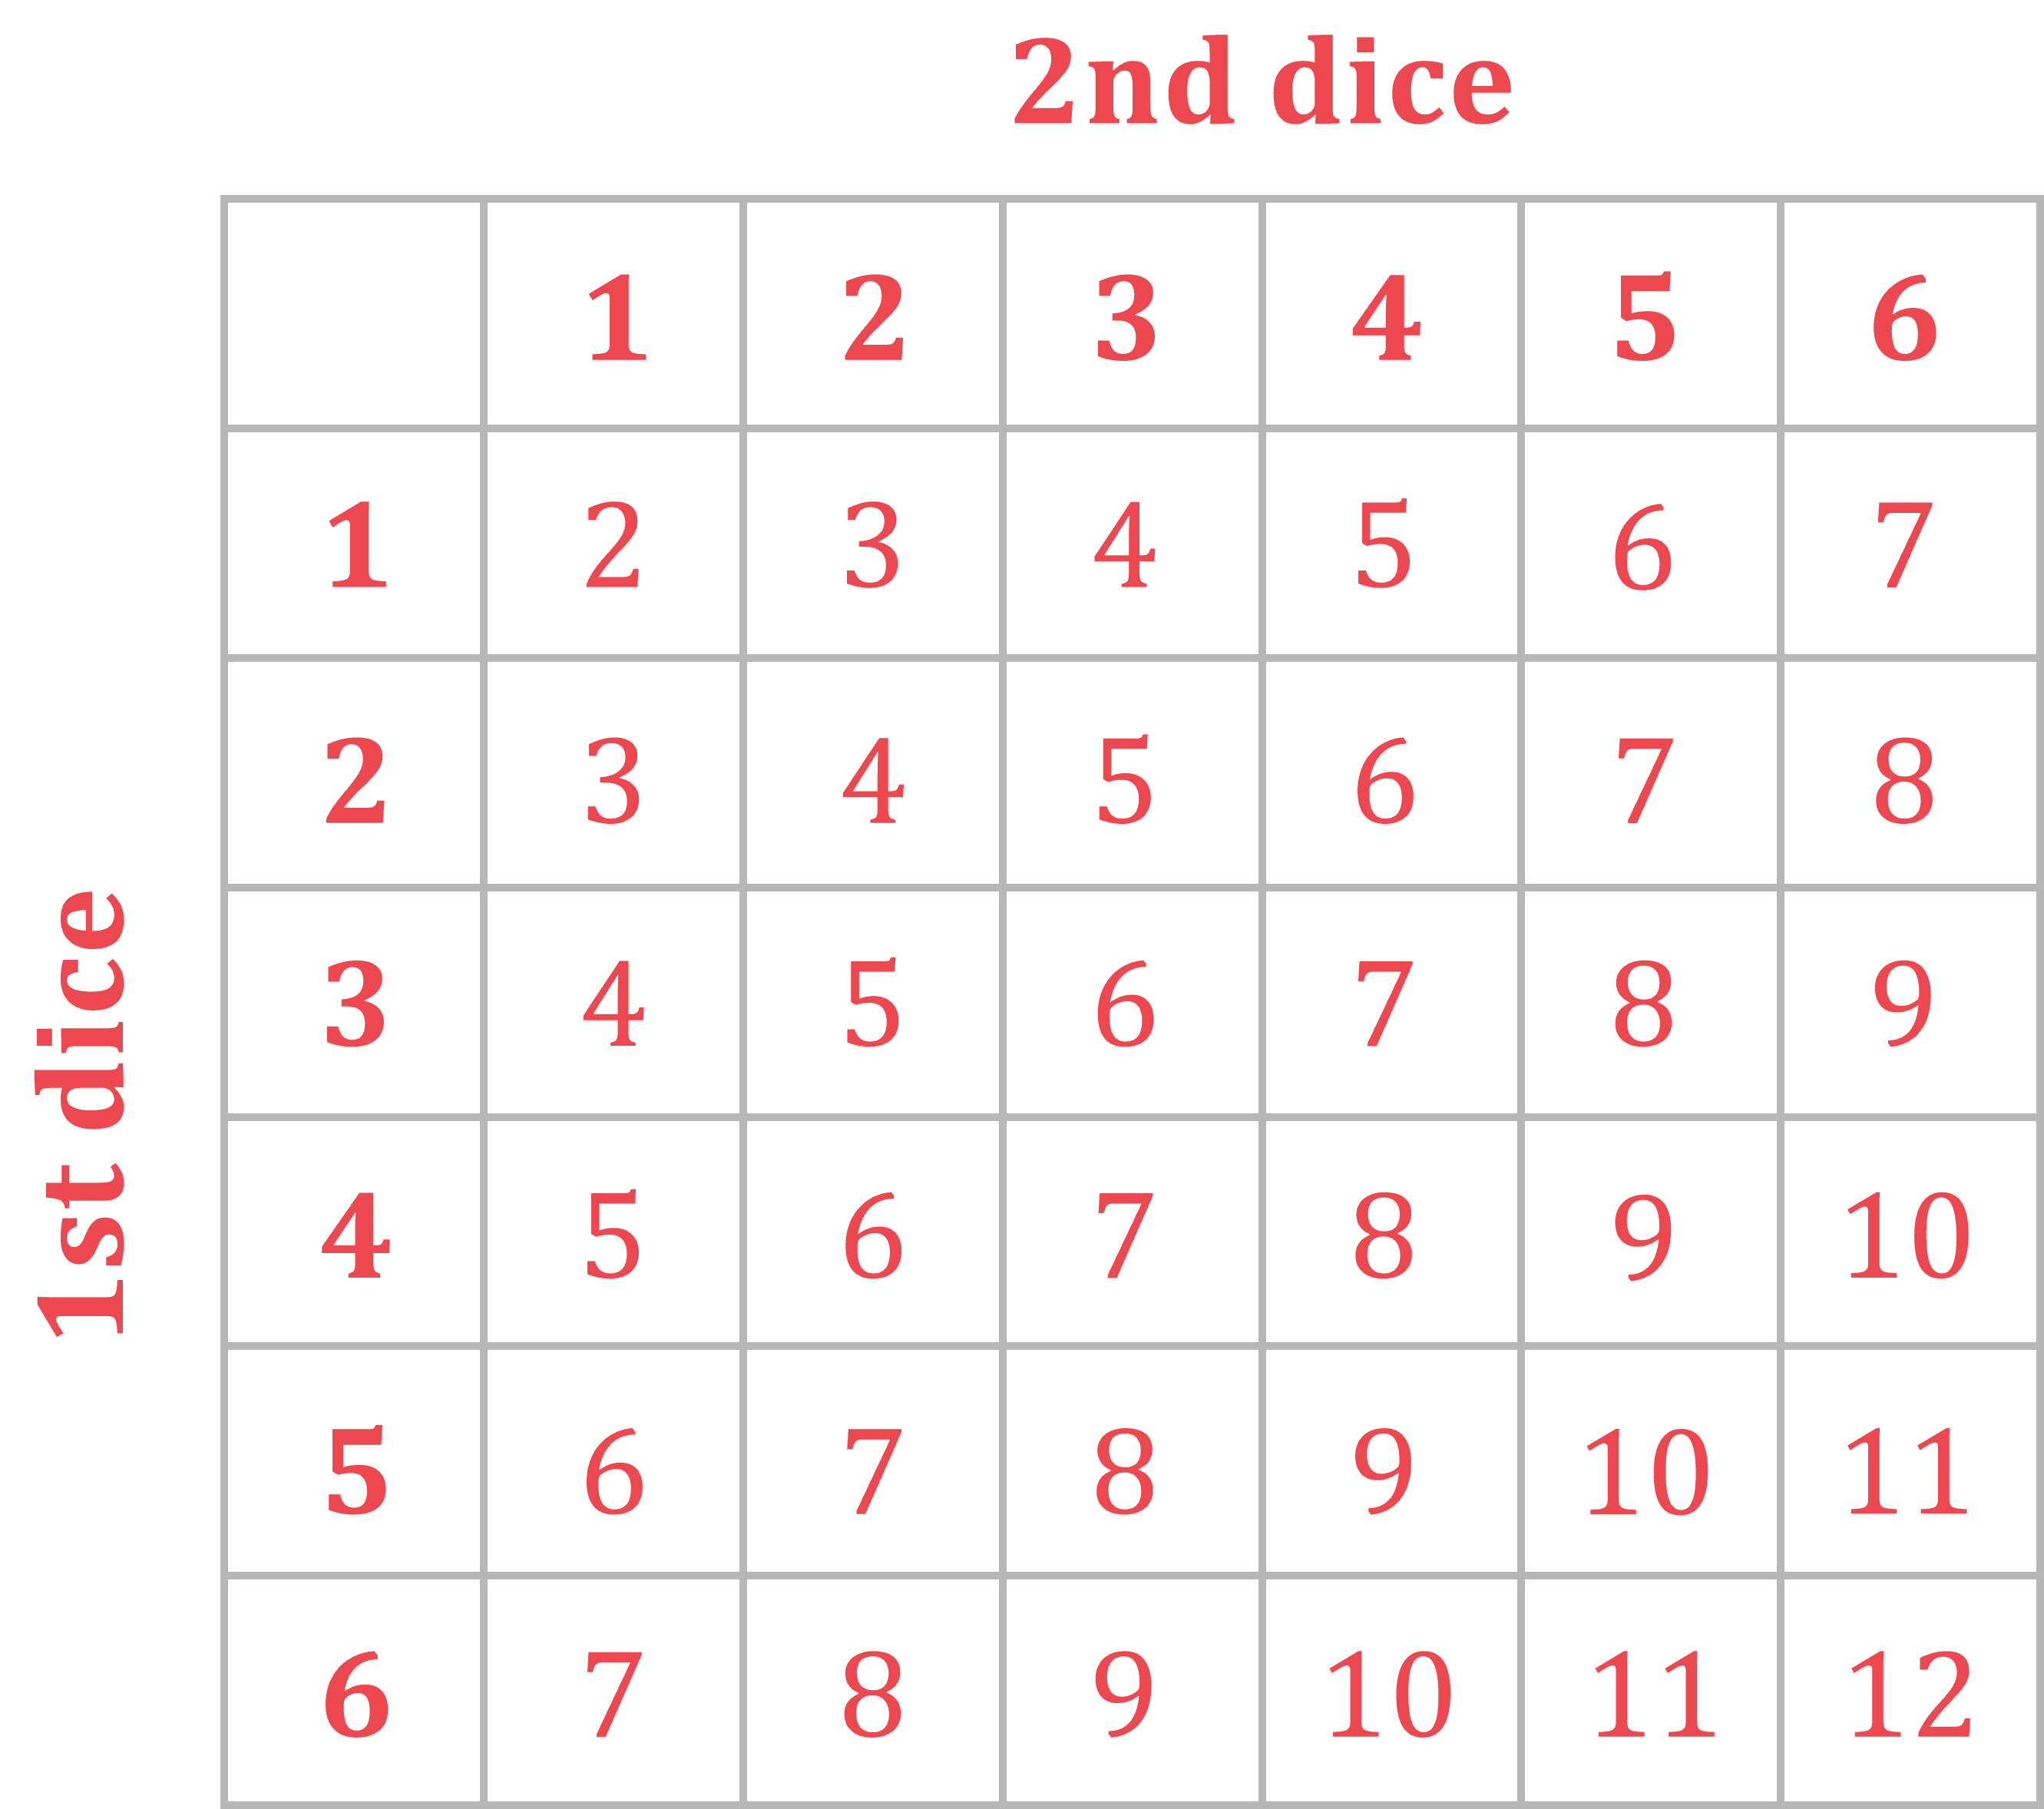
For example, roll two six-sided dice and add their scores
A list of all the possibilities would be very long
You might miss a possibility
It would be hard to spot any patterns in the sample space

Combining more than two sets of outcomes must be done by listing the possibilities
For example, flipping three coins
The sample space is HHH, HHT, HTH, THH, HTT, THT, TTH, TTT (8 possible outcomes)
How do I use a possibility diagram to calculate probabilities?
Probabilities can be found by counting the number of possibilities you want, then dividing by the total number of possibilities in the sample space
In the sample space 1, 2, 3, 4, 5, 6, 7, 8, 9, 10, there are four prime numbers (2, 3, 5 and 7)
The probability of getting a prime number is
Using the possibility diagram above for rolling two dice, the probability of getting an eight is
There are 5 eights in the grid, out of the total 36 numbers
Be careful, this counting method only works if all possibilities in the sample space are equally likely
For a fair six-sided dice: 1, 2, 3, 4, 5, 6 are all equally likely
For a fair (unbiased) coin: H, T are equally likely
Winning the lottery: Win, Lose are are not equally likely!
You cannot count possibilities here to say the probability of winning the lottery is
Examiner Tips and Tricks
Some harder questions may not say "by drawing a possibility diagram" so you may have to do it on your own.
Worked Example
Two fair six-sided dice are rolled.
(a) Find the probability that the sum of the numbers showing on the two dice is an odd number greater than 5, giving your answer as a fraction in simplest form.
Answer:
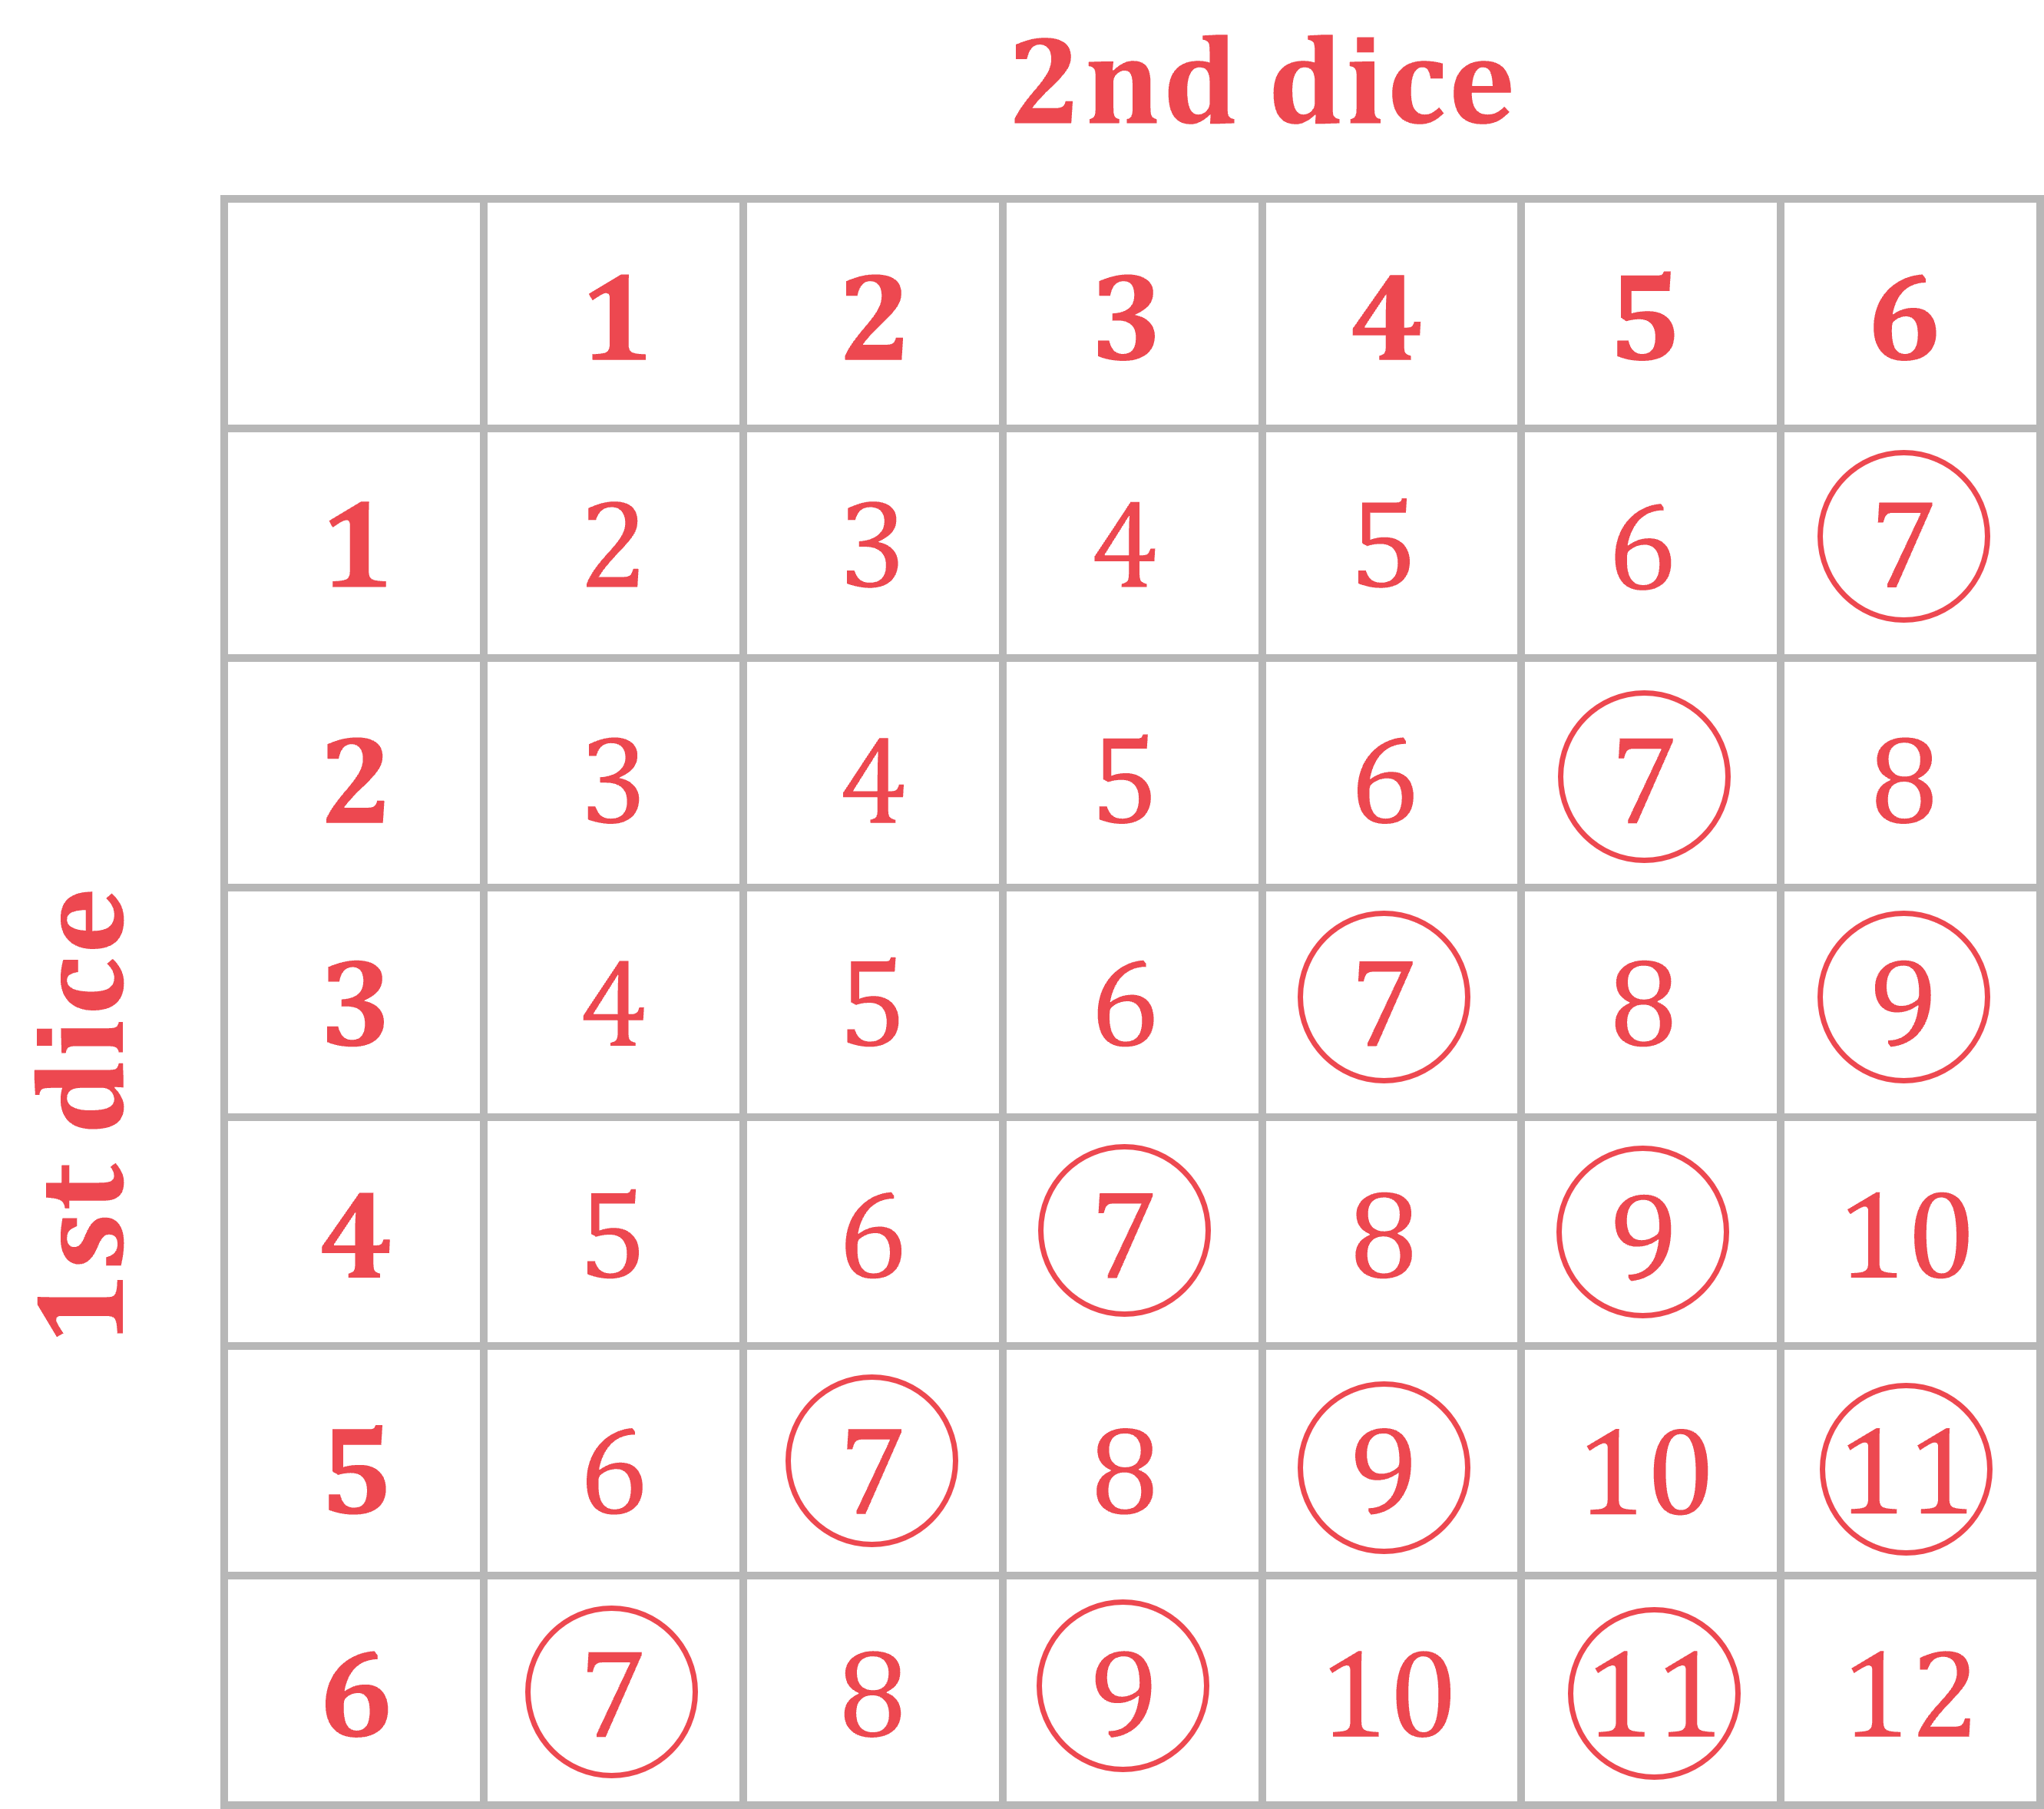
Draw a possibility diagram to show all the possible outcomes

Circle the possibilities that are odd numbers greater than 5
(5 is not included)

Count the number of possibilities that are circled (12) and divide them by the total number of possibilities in the diagram (36)
Cancel the fraction
(b) Given that the sum of the numbers showing on the two dice is an odd number greater than 5, find the probability that one of the dice shows the number 2. Give your answer as a fraction in simplest form.
Answer:
From part (a) you already know there are 12 ways to get an odd number greater than 5
Out of these 12 possibilities, only two possibilities had the number 2 on a dice: (2, 5) and (5, 2)
So the probability we are looking for is 2 divided by 12
Cancel the fraction

Unlock more, it's free!
Did this page help you?