Graphs of Rational Functions (Edexcel IGCSE Further Pure Maths): Revision Note
Exam code: 4PM1
Linear Rational Functions & Graphs
What is a linear rational function?
A (linear) rational function is of the form
Its domain is the set of all real values except
Because
would make the denominator zero
Its range is the set of all real values except
Because there's no value of
for which
The reciprocal function
is a special case of a rational function
What are the key features of linear rational graphs?
The graph has a y-intercept at
provided
The is found by substituting
The graph has one x-intercept at
provided
This is found by setting the numerator equal to zero and solving the equation
The graph has two asymptotes
A horizontal asymptote:
This is the limiting value when the value of x gets very large in the positive or negative direction
A vertical asymptote:
This is the value that causes the denominator to be zero
The graph does not have any minimum or maximum points
If you are asked to sketch or draw a rational graph:
Give the coordinates of any intercepts with the axes
Give the equations of the asymptotes
Examiner Tips and Tricks
A horizontal line should only intersect this type of graph once at most
The only horizontal line that should not intersect the graph is the horizontal asymptote
This can be used to check your sketch in an exam
Worked Example
The function is defined by
for
.
(a) Write down the equations of the horizontal and vertical asymptotes of the graph of .
The horizontal asymptote is the limiting value as x becomes very large in the positive or negative direction
When that happens, the '10' in the numerator and '2' in the denominator no longer affect the value of the function much
For large values of
That means the horizontal asymptote will be at
Horizontal asymptote:
The vertical asymptote occurs where the denominator becomes zero
Vertical asymptote:
(b) Find the coordinates of the intercepts of the graph of with the coordinate axes.
The y-intercept occurs when
y-intercept:
The x-intercept occurs when
x-intercept:
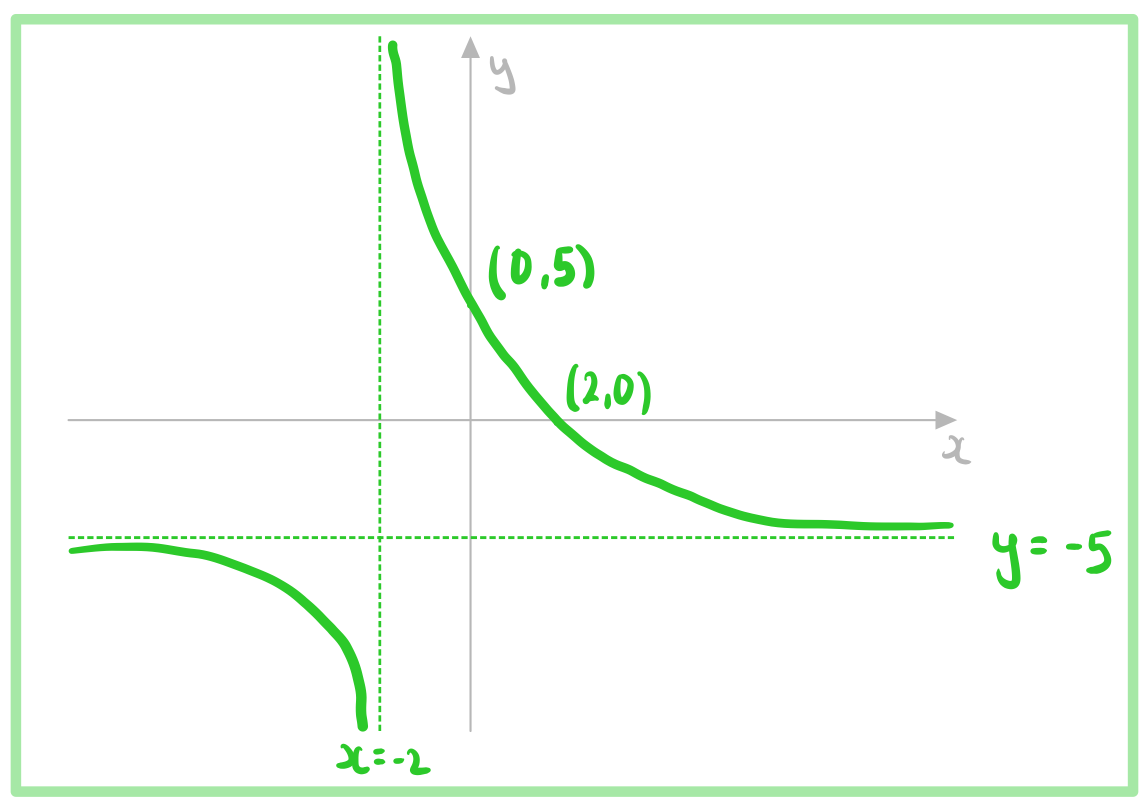
(c) Sketch the graph of .
Don't forget to include (and label) the asymptotes, and to label the axis intercepts


Unlock more, it's free!
Did this page help you?