Types of Data (Edexcel GCSE Statistics): Revision Note
Exam code: 1ST0

Types of Collected Data
What types of data do I need to be familiar with?
There are a number of terms for types of data that you need to be familiar with
You need to recognise and understand them when they appear in exam questions
And be able to use them when writing your answers to questions
Raw data is data in exactly the form that it was collected
i.e. before it has been organised or processed in any way
Raw data can be either quantitative or qualitative
Quantitative data can be recorded as a number
e.g. heights, lengths of time, numbers of people or objects, shoe sizes, etc.
Qualitative data cannot be recorded as a number
e.g. colours, flavours, kinds of animal, makes of car, etc.
Quantitative data can be either continuous or discrete
Continuous data can take any numerical value on a scale
e.g. height, length, weight, mass
For continuous data the measurements can become more and more accurate the more you 'zoom in'
Discrete data can only take on particular numerical values on a scale
Often these are integers (e.g. numbers of people or objects)
But they don't have to be integers (e.g. shoe sizes, which include 'half sizes')
Categorical data is data that can be organised into non-overlapping categories
'Non-overlapping' is important here
Each piece of data can belong to one and only one category
e.g. heights less than 1.7 metres (
format('truetype')%3Bfont-weight%3Anormal%3Bfont-style%3Anormal%3B%7D%3C%2Fstyle%3E%3C%2Fdefs%3E%3Ctext%20font-family%3D%22Times%20New%20Roman%22%20font-size%3D%2218%22%20font-style%3D%22italic%22%20text-anchor%3D%22middle%22%20x%3D%224.5%22%20y%3D%2216%22%3Eh%3C%2Ftext%3E%3Ctext%20font-family%3D%22math17d6b65b75d0ffed58234ccd284%22%20font-size%3D%2216%22%20text-anchor%3D%22middle%22%20x%3D%2218.5%22%20y%3D%2216%22%3E%26lt%3B%3C%2Ftext%3E%3Ctext%20font-family%3D%22Times%20New%20Roman%22%20font-size%3D%2218%22%20text-anchor%3D%22middle%22%20x%3D%2230.5%22%20y%3D%2216%22%3E1%3C%2Ftext%3E%3Ctext%20font-family%3D%22math17d6b65b75d0ffed58234ccd284%22%20font-size%3D%2216%22%20text-anchor%3D%22middle%22%20x%3D%2237.5%22%20y%3D%2216%22%3E.%3C%2Ftext%3E%3Ctext%20font-family%3D%22Times%20New%20Roman%22%20font-size%3D%2218%22%20text-anchor%3D%22middle%22%20x%3D%2244.5%22%20y%3D%2216%22%3E7%3C%2Ftext%3E%3C%2Fsvg%3E) ) and heights greater than or equal to 1.7 metres (
) and heights greater than or equal to 1.7 metres (format('truetype')%3Bfont-weight%3Anormal%3Bfont-style%3Anormal%3B%7D%3C%2Fstyle%3E%3C%2Fdefs%3E%3Ctext%20font-family%3D%22Times%20New%20Roman%22%20font-size%3D%2218%22%20font-style%3D%22italic%22%20text-anchor%3D%22middle%22%20x%3D%224.5%22%20y%3D%2216%22%3Eh%3C%2Ftext%3E%3Ctext%20font-family%3D%22math12be2aae5d59f438a7e18a75d41%22%20font-size%3D%2216%22%20text-anchor%3D%22middle%22%20x%3D%2218.5%22%20y%3D%2216%22%3E%26%23x2265%3B%3C%2Ftext%3E%3Ctext%20font-family%3D%22Times%20New%20Roman%22%20font-size%3D%2218%22%20text-anchor%3D%22middle%22%20x%3D%2230.5%22%20y%3D%2216%22%3E1%3C%2Ftext%3E%3Ctext%20font-family%3D%22math12be2aae5d59f438a7e18a75d41%22%20font-size%3D%2216%22%20text-anchor%3D%22middle%22%20x%3D%2237.5%22%20y%3D%2216%22%3E.%3C%2Ftext%3E%3Ctext%20font-family%3D%22Times%20New%20Roman%22%20font-size%3D%2218%22%20text-anchor%3D%22middle%22%20x%3D%2244.5%22%20y%3D%2216%22%3E7%3C%2Ftext%3E%3C%2Fsvg%3E) )
)but not
format('truetype')%3Bfont-weight%3Anormal%3Bfont-style%3Anormal%3B%7D%3C%2Fstyle%3E%3C%2Fdefs%3E%3Ctext%20font-family%3D%22Times%20New%20Roman%22%20font-size%3D%2218%22%20font-style%3D%22italic%22%20text-anchor%3D%22middle%22%20x%3D%224.5%22%20y%3D%2216%22%3Eh%3C%2Ftext%3E%3Ctext%20font-family%3D%22math1caf2d2e6371f40ebd8918f1a45%22%20font-size%3D%2216%22%20text-anchor%3D%22middle%22%20x%3D%2218.5%22%20y%3D%2216%22%3E%26%23x2264%3B%3C%2Ftext%3E%3Ctext%20font-family%3D%22Times%20New%20Roman%22%20font-size%3D%2218%22%20text-anchor%3D%22middle%22%20x%3D%2230.5%22%20y%3D%2216%22%3E1%3C%2Ftext%3E%3Ctext%20font-family%3D%22math1caf2d2e6371f40ebd8918f1a45%22%20font-size%3D%2216%22%20text-anchor%3D%22middle%22%20x%3D%2237.5%22%20y%3D%2216%22%3E.%3C%2Ftext%3E%3Ctext%20font-family%3D%22Times%20New%20Roman%22%20font-size%3D%2218%22%20text-anchor%3D%22middle%22%20x%3D%2244.5%22%20y%3D%2216%22%3E7%3C%2Ftext%3E%3C%2Fsvg%3E) and (because a height of 1.7 metres would belong to both categories)
and (because a height of 1.7 metres would belong to both categories)
The categories can be numerical or non-numerical
Ordinal data is categorical data that can be written in order
If the data is numbers, these can be ordered in the usual way
If the data is not numbers, then it must be possible to apply a numerical 'rating scale'
e.g. a scale of 1 to 5 with 1 as 'disagree strongly' and 5 as 'agree strongly'
Bivariate data is data that is collected as pairs of values
This could be data collected to investigate
the relationship between two variables
how changes in one variable affect the other variable
e.g. age of car and cost of annual maintenance, train ticket price and length of journey, etc.
Multivariate data is data that is collected in sets of more than two values
e.g. cholesterol levels, blood pressure and weight for a number of patients in a study
What is the difference between primary data and secondary data?
For the exam, you need to know the difference between primary data and secondary data
This includes recognising the advantages and disadvantages of each
Primary data is data that is collected either by the person who is going to use it, or specifically for the person who is going to use it
Advantages of primary data:
Can be gathered specifically for the question you are trying to answer
The level of accuracy will be known
The collection method will be known
Disadvantages of primary data:
Collecting data can require a lot of time
It can also be expensive
Secondary data is data that has been collected by somebody else
Some possible sources for secondary data:
the internet
print media (newspapers, magazines, etc.)
databases
research articles
census returns
Advantages of secondary data
Can be quicker to obtain (i.e. less time)
Can be easier to obtain (i.e. more convenient)
Less expensive than collecting data yourself
May be more accurate than data you collect yourself (depending on the source)
Disadvantages of secondary data
May be hard to find relevant data for your specific question
The data may be out of date
The level of accuracy may not be known (e.g. the data may have been rounded)
The collection method may not be known
The source of the data may not be reliable
If you use secondary data, it is always necessary to acknowledge the source that the data was taken from
Worked Example
(a) Which of the following words can be used to describe the data in the following examples?
quantitative qualitative continuous discrete
More than one word might be applicable in each case.
(i) The weights of dogs participating in a dog show.
Weight is recorded by a number, so it is quantitative data
And weight can take on any value, so it is continuous
quantitative, continuous
(ii) The favourite ice cream flavours of the students in a school.
Flavour is not recorded as a number, so it is qualitative data
And only quantitative data can be discrete or continuous
qualitative
(iii) The number of computers owned by each household in a particular city.
The data is recorded as numbers, so it is quantitative
But only integer (i.e. whole number) values are possible, so it is discrete
quantitative, discrete
(b) Write down two types of data you could collect about cars owned by people in a particular region. State whether each type of data is categorical and/or ordinal.
You could record the make of each car (Renault, Ford, etc.)
This is categorical, because the data can be put into non-overlapping categories (just use the different makes as the categories!)
It is not ordinal, because it cannot be arranged in numerical order
Make of car (categorical, not ordinal)
You could also record the engine size of the car in cubic centimetres (cc)
This is categorical, because the data can be put into non-overlapping categories (just make sure to select the categories carefully!)
It is also ordinal, because the sizes can be put into numerical order
Size of engine in cc (categorical, ordinal)
(c) Gihan is investigating the lateness of flight departures at Heathrow Airport. Explain why it is sensible for Gihan to collect secondary data for his investigation.
It will be quicker and less expensive for Gihan to use secondary data, instead of collecting it himself.
It will also be much easier to find a large amount of data from a secondary source.
Grouped & Ungrouped Data
What are the advantages and disadvantages of grouping data?
For a relatively small data set it is okay to leave the data in ungrouped form
e.g. the heights (in metres) of eight students in a school club
1.57 1.63 1.69 1.71 1.77 1.79 1.81 1.84There are not too many values in that data set
so it is possible to get a 'feel' for the set just by looking at the list of values
For a large data set it is often more useful to present the data in grouped form
The data is divided into a number of categories
and the frequency of each category (i.e., the number of values in each category) is reported
The categories are known as classes
The intervals defining what goes into what class are known as class intervals
Advantages of using grouped data:
The distribution of the data can be seen more clearly
Patterns in the data can be spotted more easily
Disadvantages of using grouped data:
The exact data values are no longer visible
You can only see how many values fall within each class
Statistics calculated from grouped data are less precise
e.g. mean, median and mode from grouped data can only be estimates
What things are important when grouping data?
You must be careful when selecting the class intervals for grouped data
The class intervals must not overlap
For discrete data make sure no data value occurs in more than one class interval
e.g. 0-10, 11-20, 21-30, etc.
For continuous data the class intervals also must not have any gaps between them
e.g.
format('truetype')%3Bfont-weight%3Anormal%3Bfont-style%3Anormal%3B%7D%3C%2Fstyle%3E%3C%2Fdefs%3E%3Ctext%20font-family%3D%22Times%20New%20Roman%22%20font-size%3D%2218%22%20text-anchor%3D%22middle%22%20x%3D%224.5%22%20y%3D%2216%22%3E0%3C%2Ftext%3E%3Ctext%20font-family%3D%22math18b7657037a5d4ded67c4f80e24%22%20font-size%3D%2216%22%20text-anchor%3D%22middle%22%20x%3D%2217.5%22%20y%3D%2216%22%3E%26%23x2264%3B%3C%2Ftext%3E%3Ctext%20font-family%3D%22Times%20New%20Roman%22%20font-size%3D%2218%22%20font-style%3D%22italic%22%20text-anchor%3D%22middle%22%20x%3D%2229.5%22%20y%3D%2216%22%3Ex%3C%2Ftext%3E%3Ctext%20font-family%3D%22math18b7657037a5d4ded67c4f80e24%22%20font-size%3D%2216%22%20text-anchor%3D%22middle%22%20x%3D%2243.5%22%20y%3D%2216%22%3E%26lt%3B%3C%2Ftext%3E%3Ctext%20font-family%3D%22Times%20New%20Roman%22%20font-size%3D%2218%22%20text-anchor%3D%22middle%22%20x%3D%2260.5%22%20y%3D%2216%22%3E10%3C%2Ftext%3E%3Ctext%20font-family%3D%22math18b7657037a5d4ded67c4f80e24%22%20font-size%3D%2216%22%20text-anchor%3D%22middle%22%20x%3D%2271.5%22%20y%3D%2216%22%3E%2C%3C%2Ftext%3E%3Ctext%20font-family%3D%22Times%20New%20Roman%22%20font-size%3D%2218%22%20text-anchor%3D%22middle%22%20x%3D%2291.5%22%20y%3D%2216%22%3E10%3C%2Ftext%3E%3Ctext%20font-family%3D%22math18b7657037a5d4ded67c4f80e24%22%20font-size%3D%2216%22%20text-anchor%3D%22middle%22%20x%3D%22108.5%22%20y%3D%2216%22%3E%26%23x2264%3B%3C%2Ftext%3E%3Ctext%20font-family%3D%22Times%20New%20Roman%22%20font-size%3D%2218%22%20font-style%3D%22italic%22%20text-anchor%3D%22middle%22%20x%3D%22120.5%22%20y%3D%2216%22%3Ex%3C%2Ftext%3E%3Ctext%20font-family%3D%22math18b7657037a5d4ded67c4f80e24%22%20font-size%3D%2216%22%20text-anchor%3D%22middle%22%20x%3D%22134.5%22%20y%3D%2216%22%3E%26lt%3B%3C%2Ftext%3E%3Ctext%20font-family%3D%22Times%20New%20Roman%22%20font-size%3D%2218%22%20text-anchor%3D%22middle%22%20x%3D%22151.5%22%20y%3D%2216%22%3E20%3C%2Ftext%3E%3Ctext%20font-family%3D%22math18b7657037a5d4ded67c4f80e24%22%20font-size%3D%2216%22%20text-anchor%3D%22middle%22%20x%3D%22162.5%22%20y%3D%2216%22%3E%2C%3C%2Ftext%3E%3Ctext%20font-family%3D%22Times%20New%20Roman%22%20font-size%3D%2218%22%20text-anchor%3D%22middle%22%20x%3D%22182.5%22%20y%3D%2216%22%3E20%3C%2Ftext%3E%3Ctext%20font-family%3D%22math18b7657037a5d4ded67c4f80e24%22%20font-size%3D%2216%22%20text-anchor%3D%22middle%22%20x%3D%22199.5%22%20y%3D%2216%22%3E%26%23x2264%3B%3C%2Ftext%3E%3Ctext%20font-family%3D%22Times%20New%20Roman%22%20font-size%3D%2218%22%20font-style%3D%22italic%22%20text-anchor%3D%22middle%22%20x%3D%22211.5%22%20y%3D%2216%22%3Ex%3C%2Ftext%3E%3Ctext%20font-family%3D%22math18b7657037a5d4ded67c4f80e24%22%20font-size%3D%2216%22%20text-anchor%3D%22middle%22%20x%3D%22225.5%22%20y%3D%2216%22%3E%26lt%3B%3C%2Ftext%3E%3Ctext%20font-family%3D%22Times%20New%20Roman%22%20font-size%3D%2218%22%20text-anchor%3D%22middle%22%20x%3D%22242.5%22%20y%3D%2216%22%3E30%3C%2Ftext%3E%3C%2Fsvg%3E) , etc.
, etc.format('truetype')%3Bfont-weight%3Anormal%3Bfont-style%3Anormal%3B%7D%3C%2Fstyle%3E%3C%2Fdefs%3E%3Ctext%20font-family%3D%22Times%20New%20Roman%22%20font-size%3D%2218%22%20text-anchor%3D%22middle%22%20x%3D%224.5%22%20y%3D%2216%22%3E0%3C%2Ftext%3E%3Ctext%20font-family%3D%22math1a36adbc35e69b22acbf9f834a0%22%20font-size%3D%2216%22%20text-anchor%3D%22middle%22%20x%3D%2217.5%22%20y%3D%2216%22%3E%26%23x2264%3B%3C%2Ftext%3E%3Ctext%20font-family%3D%22Times%20New%20Roman%22%20font-size%3D%2218%22%20font-style%3D%22italic%22%20text-anchor%3D%22middle%22%20x%3D%2229.5%22%20y%3D%2216%22%3Ex%3C%2Ftext%3E%3Ctext%20font-family%3D%22math1a36adbc35e69b22acbf9f834a0%22%20font-size%3D%2216%22%20text-anchor%3D%22middle%22%20x%3D%2243.5%22%20y%3D%2216%22%3E%26%23x2264%3B%3C%2Ftext%3E%3Ctext%20font-family%3D%22Times%20New%20Roman%22%20font-size%3D%2218%22%20text-anchor%3D%22middle%22%20x%3D%2260.5%22%20y%3D%2216%22%3E10%3C%2Ftext%3E%3C%2Fsvg%3E) and
and format('truetype')%3Bfont-weight%3Anormal%3Bfont-style%3Anormal%3B%7D%3C%2Fstyle%3E%3C%2Fdefs%3E%3Ctext%20font-family%3D%22Times%20New%20Roman%22%20font-size%3D%2218%22%20text-anchor%3D%22middle%22%20x%3D%229.5%22%20y%3D%2216%22%3E11%3C%2Ftext%3E%3Ctext%20font-family%3D%22math1a36adbc35e69b22acbf9f834a0%22%20font-size%3D%2216%22%20text-anchor%3D%22middle%22%20x%3D%2226.5%22%20y%3D%2216%22%3E%26%23x2264%3B%3C%2Ftext%3E%3Ctext%20font-family%3D%22Times%20New%20Roman%22%20font-size%3D%2218%22%20font-style%3D%22italic%22%20text-anchor%3D%22middle%22%20x%3D%2238.5%22%20y%3D%2216%22%3Ex%3C%2Ftext%3E%3Ctext%20font-family%3D%22math1a36adbc35e69b22acbf9f834a0%22%20font-size%3D%2216%22%20text-anchor%3D%22middle%22%20x%3D%2252.5%22%20y%3D%2216%22%3E%26%23x2264%3B%3C%2Ftext%3E%3Ctext%20font-family%3D%22Times%20New%20Roman%22%20font-size%3D%2218%22%20text-anchor%3D%22middle%22%20x%3D%2269.5%22%20y%3D%2216%22%3E20%3C%2Ftext%3E%3C%2Fsvg%3E) would not be good because there is a gap between 10 and 11
would not be good because there is a gap between 10 and 11
Open-ended class intervals can be used where minimum or maximum values aren't known
e.g.
format('truetype')%3Bfont-weight%3Anormal%3Bfont-style%3Anormal%3B%7D%3C%2Fstyle%3E%3C%2Fdefs%3E%3Ctext%20font-family%3D%22Times%20New%20Roman%22%20font-size%3D%2218%22%20font-style%3D%22italic%22%20text-anchor%3D%22middle%22%20x%3D%224.5%22%20y%3D%2216%22%3Ex%3C%2Ftext%3E%3Ctext%20font-family%3D%22math1072b030ba126b2f4b2374f342b%22%20font-size%3D%2216%22%20text-anchor%3D%22middle%22%20x%3D%2218.5%22%20y%3D%2216%22%3E%26lt%3B%3C%2Ftext%3E%3Ctext%20font-family%3D%22Times%20New%20Roman%22%20font-size%3D%2218%22%20text-anchor%3D%22middle%22%20x%3D%2235.5%22%20y%3D%2216%22%3E30%3C%2Ftext%3E%3C%2Fsvg%3E) for the first class interval
for the first class intervalor
format('truetype')%3Bfont-weight%3Anormal%3Bfont-style%3Anormal%3B%7D%3C%2Fstyle%3E%3C%2Fdefs%3E%3Ctext%20font-family%3D%22Times%20New%20Roman%22%20font-size%3D%2218%22%20font-style%3D%22italic%22%20text-anchor%3D%22middle%22%20x%3D%224.5%22%20y%3D%2216%22%3Ex%3C%2Ftext%3E%3Ctext%20font-family%3D%22math144f683a84163b3523afe57c2e0%22%20font-size%3D%2216%22%20text-anchor%3D%22middle%22%20x%3D%2218.5%22%20y%3D%2216%22%3E%26gt%3B%3C%2Ftext%3E%3Ctext%20font-family%3D%22Times%20New%20Roman%22%20font-size%3D%2218%22%20text-anchor%3D%22middle%22%20x%3D%2235.5%22%20y%3D%2216%22%3E90%3C%2Ftext%3E%3C%2Fsvg%3E) for the last one
for the last one
Consider how many class intervals to use for grouping the data
If there are too many intervals (too much detail)
or too few intervals (not enough detail)
then it can be hard to spot trends in the data
Class intervals do not all need to be the same width
You will often see grouped data where the class intervals have equal widths
This is appropriate when the data is roughly evenly spread out
But sometimes unequal class widths might be more appropriate
e.g. when most of the data values are clustered 'in the middle'
It might make more sense to have wider intervals at the start and end
and narrower intervals in the middle
Too many or too few data values falling into certain class intervals
can make the data representation less useful
Also be careful with class intervals when working with rounded data values
All values that might round to a particular value must fall within the same class interval
e.g. if the data is time rounded to the nearest second
then
format('truetype')%3Bfont-weight%3Anormal%3Bfont-style%3Anormal%3B%7D%3C%2Fstyle%3E%3C%2Fdefs%3E%3Ctext%20font-family%3D%22Times%20New%20Roman%22%20font-size%3D%2218%22%20text-anchor%3D%22middle%22%20x%3D%229.5%22%20y%3D%2216%22%3E60%3C%2Ftext%3E%3Ctext%20font-family%3D%22math1d3114856d6c6df443e3168d768%22%20font-size%3D%2216%22%20text-anchor%3D%22middle%22%20x%3D%2226.5%22%20y%3D%2216%22%3E%26%23x2264%3B%3C%2Ftext%3E%3Ctext%20font-family%3D%22Times%20New%20Roman%22%20font-size%3D%2218%22%20font-style%3D%22italic%22%20text-anchor%3D%22middle%22%20x%3D%2236.5%22%20y%3D%2216%22%3Et%3C%2Ftext%3E%3Ctext%20font-family%3D%22math1d3114856d6c6df443e3168d768%22%20font-size%3D%2216%22%20text-anchor%3D%22middle%22%20x%3D%2248.5%22%20y%3D%2216%22%3E%26lt%3B%3C%2Ftext%3E%3Ctext%20font-family%3D%22Times%20New%20Roman%22%20font-size%3D%2218%22%20text-anchor%3D%22middle%22%20x%3D%2265.5%22%20y%3D%2216%22%3E70%3C%2Ftext%3E%3C%2Fsvg%3E) and
and format('truetype')%3Bfont-weight%3Anormal%3Bfont-style%3Anormal%3B%7D%3C%2Fstyle%3E%3C%2Fdefs%3E%3Ctext%20font-family%3D%22Times%20New%20Roman%22%20font-size%3D%2218%22%20text-anchor%3D%22middle%22%20x%3D%229.5%22%20y%3D%2216%22%3E70%3C%2Ftext%3E%3Ctext%20font-family%3D%22math1d3114856d6c6df443e3168d768%22%20font-size%3D%2216%22%20text-anchor%3D%22middle%22%20x%3D%2226.5%22%20y%3D%2216%22%3E%26%23x2264%3B%3C%2Ftext%3E%3Ctext%20font-family%3D%22Times%20New%20Roman%22%20font-size%3D%2218%22%20font-style%3D%22italic%22%20text-anchor%3D%22middle%22%20x%3D%2236.5%22%20y%3D%2216%22%3Et%3C%2Ftext%3E%3Ctext%20font-family%3D%22math1d3114856d6c6df443e3168d768%22%20font-size%3D%2216%22%20text-anchor%3D%22middle%22%20x%3D%2248.5%22%20y%3D%2216%22%3E%26lt%3B%3C%2Ftext%3E%3Ctext%20font-family%3D%22Times%20New%20Roman%22%20font-size%3D%2218%22%20text-anchor%3D%22middle%22%20x%3D%2265.5%22%20y%3D%2216%22%3E80%3C%2Ftext%3E%3C%2Fsvg%3E) would not be good intervals to use
would not be good intervals to use(because a measurement of 70 seconds to the nearest second could be anywhere between 69.5 and 70.5 seconds)
Use
format('truetype')%3Bfont-weight%3Anormal%3Bfont-style%3Anormal%3B%7D%3C%2Fstyle%3E%3C%2Fdefs%3E%3Ctext%20font-family%3D%22Times%20New%20Roman%22%20font-size%3D%2218%22%20text-anchor%3D%22middle%22%20x%3D%229.5%22%20y%3D%2216%22%3E59%3C%2Ftext%3E%3Ctext%20font-family%3D%22math13c77c15c4fe11b8bc39cad3c3a%22%20font-size%3D%2216%22%20text-anchor%3D%22middle%22%20x%3D%2220.5%22%20y%3D%2216%22%3E.%3C%2Ftext%3E%3Ctext%20font-family%3D%22Times%20New%20Roman%22%20font-size%3D%2218%22%20text-anchor%3D%22middle%22%20x%3D%2227.5%22%20y%3D%2216%22%3E5%3C%2Ftext%3E%3Ctext%20font-family%3D%22math13c77c15c4fe11b8bc39cad3c3a%22%20font-size%3D%2216%22%20text-anchor%3D%22middle%22%20x%3D%2240.5%22%20y%3D%2216%22%3E%26%23x2264%3B%3C%2Ftext%3E%3Ctext%20font-family%3D%22Times%20New%20Roman%22%20font-size%3D%2218%22%20font-style%3D%22italic%22%20text-anchor%3D%22middle%22%20x%3D%2250.5%22%20y%3D%2216%22%3Et%3C%2Ftext%3E%3Ctext%20font-family%3D%22math13c77c15c4fe11b8bc39cad3c3a%22%20font-size%3D%2216%22%20text-anchor%3D%22middle%22%20x%3D%2262.5%22%20y%3D%2216%22%3E%26lt%3B%3C%2Ftext%3E%3Ctext%20font-family%3D%22Times%20New%20Roman%22%20font-size%3D%2218%22%20text-anchor%3D%22middle%22%20x%3D%2279.5%22%20y%3D%2216%22%3E69%3C%2Ftext%3E%3Ctext%20font-family%3D%22math13c77c15c4fe11b8bc39cad3c3a%22%20font-size%3D%2216%22%20text-anchor%3D%22middle%22%20x%3D%2290.5%22%20y%3D%2216%22%3E.%3C%2Ftext%3E%3Ctext%20font-family%3D%22Times%20New%20Roman%22%20font-size%3D%2218%22%20text-anchor%3D%22middle%22%20x%3D%2297.5%22%20y%3D%2216%22%3E5%3C%2Ftext%3E%3C%2Fsvg%3E) and
and format('truetype')%3Bfont-weight%3Anormal%3Bfont-style%3Anormal%3B%7D%3C%2Fstyle%3E%3C%2Fdefs%3E%3Ctext%20font-family%3D%22Times%20New%20Roman%22%20font-size%3D%2218%22%20text-anchor%3D%22middle%22%20x%3D%229.5%22%20y%3D%2216%22%3E69%3C%2Ftext%3E%3Ctext%20font-family%3D%22math13c77c15c4fe11b8bc39cad3c3a%22%20font-size%3D%2216%22%20text-anchor%3D%22middle%22%20x%3D%2220.5%22%20y%3D%2216%22%3E.%3C%2Ftext%3E%3Ctext%20font-family%3D%22Times%20New%20Roman%22%20font-size%3D%2218%22%20text-anchor%3D%22middle%22%20x%3D%2227.5%22%20y%3D%2216%22%3E5%3C%2Ftext%3E%3Ctext%20font-family%3D%22math13c77c15c4fe11b8bc39cad3c3a%22%20font-size%3D%2216%22%20text-anchor%3D%22middle%22%20x%3D%2240.5%22%20y%3D%2216%22%3E%26%23x2264%3B%3C%2Ftext%3E%3Ctext%20font-family%3D%22Times%20New%20Roman%22%20font-size%3D%2218%22%20font-style%3D%22italic%22%20text-anchor%3D%22middle%22%20x%3D%2250.5%22%20y%3D%2216%22%3Et%3C%2Ftext%3E%3Ctext%20font-family%3D%22math13c77c15c4fe11b8bc39cad3c3a%22%20font-size%3D%2216%22%20text-anchor%3D%22middle%22%20x%3D%2262.5%22%20y%3D%2216%22%3E%26lt%3B%3C%2Ftext%3E%3Ctext%20font-family%3D%22Times%20New%20Roman%22%20font-size%3D%2218%22%20text-anchor%3D%22middle%22%20x%3D%2279.5%22%20y%3D%2216%22%3E79%3C%2Ftext%3E%3Ctext%20font-family%3D%22math13c77c15c4fe11b8bc39cad3c3a%22%20font-size%3D%2216%22%20text-anchor%3D%22middle%22%20x%3D%2290.5%22%20y%3D%2216%22%3E.%3C%2Ftext%3E%3Ctext%20font-family%3D%22Times%20New%20Roman%22%20font-size%3D%2218%22%20text-anchor%3D%22middle%22%20x%3D%2297.5%22%20y%3D%2216%22%3E5%3C%2Ftext%3E%3C%2Fsvg%3E) instead
instead
Worked Example
Hazel and Avelaine have been collecting data on the weights of walnuts. After rounding all the weights to the nearest gram, the weights in their data set (in grams) are as follows:
9 13 17 11 15 16 22 18 14 16 15 19
14 13 10 15 20 14 16 13 12 18 16 12
(a) Avelaine suggests using the following table to group the data:
weight ( | frequency |
| |
| |
| |
| |
| |
|
Based on the nature of the data, suggest one problem with Avelaine's table.
Remember that rounded and unrounded values need to fall within the same class interval
The unrounded weight of any nut could be up to 0.5 grams more or less than the rounded value
Avelaine's table doesn't take account of the rounding of the data.
For example a 9.7 g nut would fall in the w<10 class interval, but the rounded value (10 g) would fall in the 10≤w<13 class interval.
(b) Hazel suggests using the following table instead:
weight ( | frequency |
| |
| |
| |
| |
| |
|
Complete Hazel's table for the data provided.
Be sure to count carefully
For example use a tally chart and cross off values from the list once you tally them
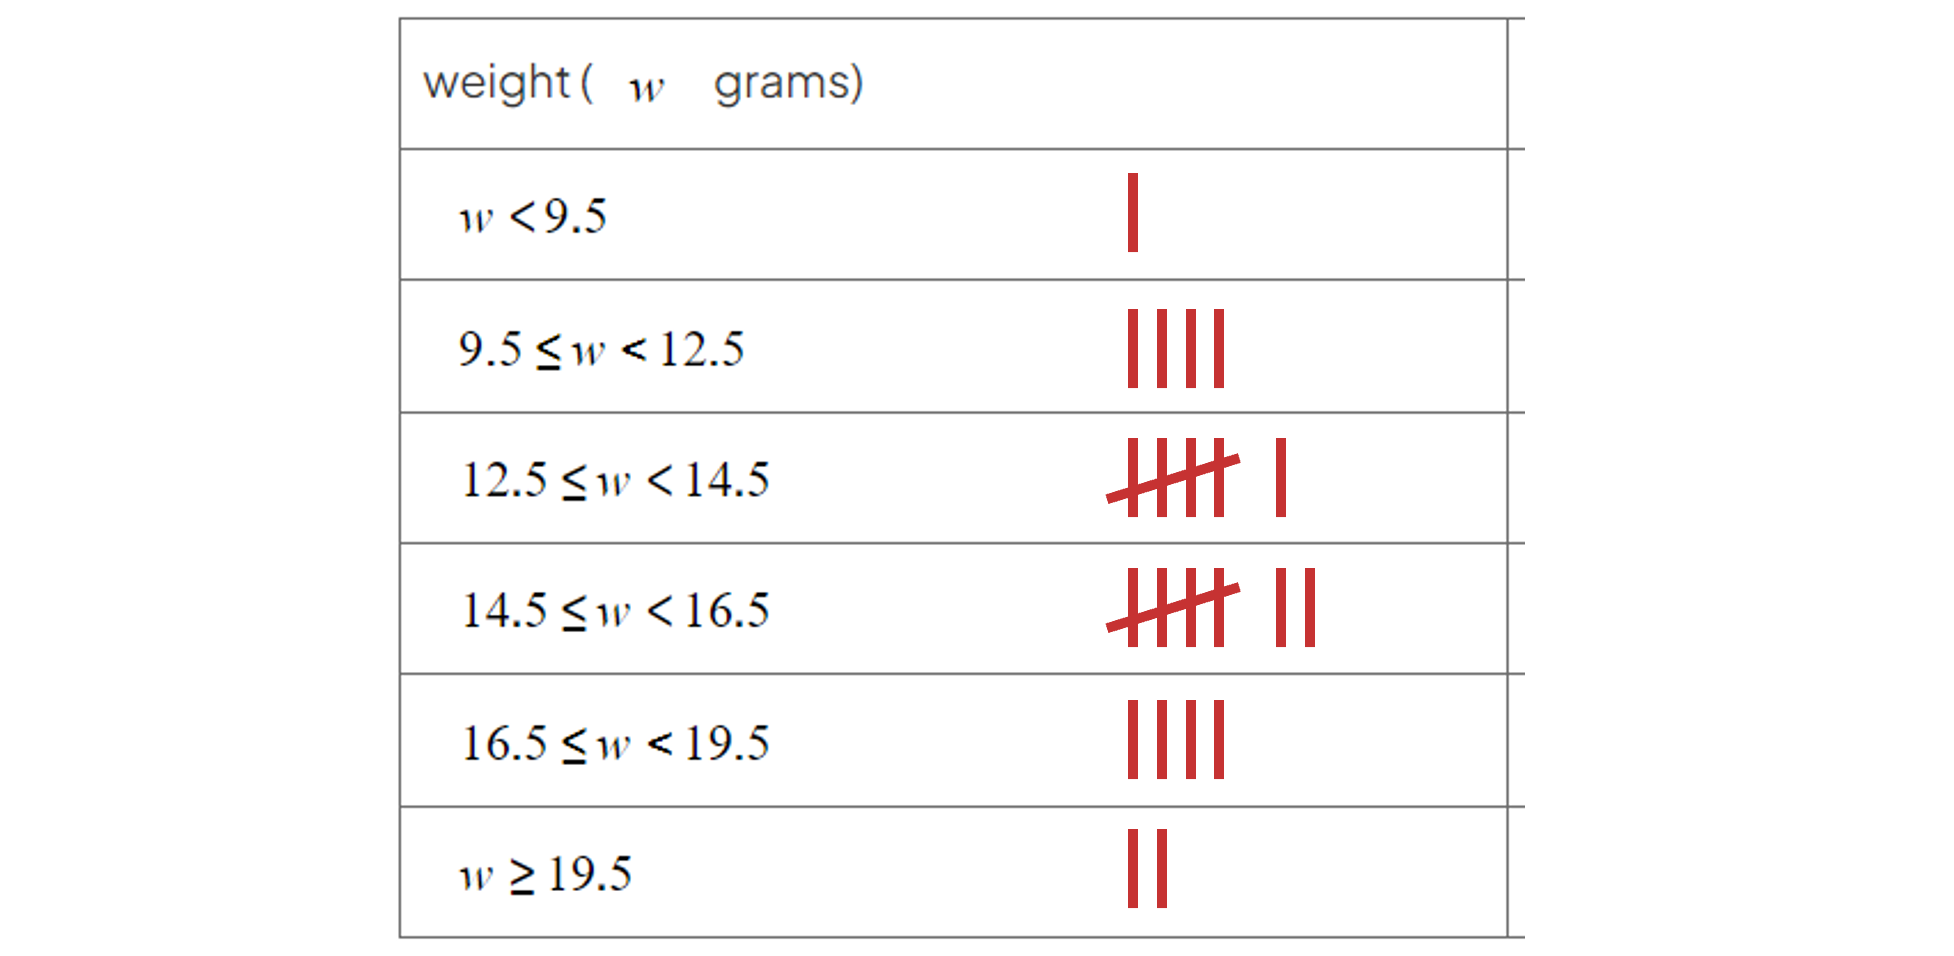
Also make sure your frequencies total up to 24 (the number of data values in the list)
weight ( | frequency |
| 1 |
| 4 |
| 6 |
| 7 |
| 4 |
| 2 |
Explanatory & Response Variables
What are explanatory and response variables?
When data is collected from an experiment, the researcher usually wants to know how changes in one variable affect another variable
The first variable is called the explanatory variable (or independent variable)
This is the variable that the researcher controls (or observes) changes in
The researcher suspects that changes in this variable will cause changes in the other variable
The explanatory variable is thought to 'explain' why the other variable changes
The second variable is called the response variable (or dependent variable)
This is the variable that the researcher measures after changes have been made in the explanatory variable
The researcher suspects that this variable will be affected by changes in the explanatory variable
The response variable 'responds' to changes in the explanatory variable
For example, a researcher wants to study the effects of different types of running shoe on how long it takes runners to run 100 metres
The explanatory variable is the type of running shoe
The response variable is the time taken to run 100 m
Any other variables in an experiment are known as extraneous variables
These should be eliminated or minimised so they don't affect the results
You need to be very careful with explanatory and response variables when drawing a scatter diagram
The explanatory variable MUST be on the x-axis
And the response variable MUST be on the y-axis
Worked Example
In each of the following experiments, state which variable is the explanatory variable and which is the response variable.
(a) An engineer wishes to study whether temperature has an effect on charging times for mobile phone batteries.
Explanatory variable: temperature
Response variable: how long it takes the batteries to charge
(b) An education researcher wants to see whether a new AI study app improves students' scores on a maths test.
Explanatory variable: whether or not a student has used the app
Response variable: scores on the test
(c) An naturalist wants to explore whether the number of offspring successfully raised by breeding pairs of a particular species of bird depends on the percentage of tree cover in the region where the birds live.
Explanatory variable: percentage of tree cover
Response variable: number of offspring successfully raised

You've read 0 of your 5 free revision notes this week
Unlock more, it's free!
Did this page help you?
