Two-way Tables & Venn Diagrams (Edexcel GCSE Statistics) : Revision Note

Two-way Tables
What are two-way tables?
Two-way tables are tables that compare two types of characteristics
For example, a college of 55 students has
two year groups (Year 12 and Year 13)
and two language options (Spanish and German)
The two-way table for the college's data is shown:
Spanish
German
Year 12
15
10
Year 13
5
25
How do I interpret a two-way table?
Draw in the totals of each row and column
Include an overall total in the bottom-right corner
It should be the sum of the totals above it, or to its left
(Both should be the same - if they are not the same there is a mistake somewhere!)
For the example above:
Spanish
German
Total
Year 12
15
10
25
Year 13
5
25
30
Total
20
35
55
Now we know that there are 25 students in Year 12 and 30 in Year 13
And that there are 20 students who study Spanish and 35 who study German
Examiner Tips and Tricks
Check that your row and column totals add up to the overall total
Otherwise anything else you calculate from the table will be wrong!
Worked Example
At an art group, children are allowed to choose between colouring, painting, clay modelling and sketching.
A total of 60 children attend and are split into two classes: class A and class B.
12 of class A chose the activity colouring and 13 of class B chose clay modelling.
A total of 20 children chose painting and a total of 15 chose clay modelling.
8 of the 30 children in class A and 4 of the children in class B chose sketching.
Construct a two-way table to show this information.
Read through each sentence and fill in the numbers that are given
| Colouring | Painting | Clay modelling | Sketching | Total |
Class A | 12 |
|
| 8 | 30 |
Class B |
|
| 13 | 4 |
|
Total |
| 20 | 15 |
| 60 |
Use the row and column totals to fill in any obvious missing numbers
| Colouring | Painting | Clay modelling | Sketching | Total |
Class A | 12 |
| 15 - 13 = 2 | 8 | 30 |
Class B |
|
| 13 | 4 | 60 - 30 = 30 |
Total |
| 20 | 15 | 8 + 4 = 12 | 60 |
Use the row and column totals again to find the last few numbers
| Colouring | Painting | Clay modelling | Sketching | Total |
Class A | 12 | 30 - 12 - 2 - 8 = 8 | 2 | 8 | 30 |
Class B | 30 - 12 - 13 - 4 = 1 | 20 - 8 = 12 | 13 | 4 | 30 |
Total | 12 + 1 = 13 | 20 | 15 | 12 | 60 |
Write out your final answer
| Colouring | Painting | Clay modelling | Sketching | Total |
Class A | 12 | 8 | 2 | 8 | 30 |
Class B | 1 | 12 | 13 | 4 | 30 |
Total | 13 | 20 | 15 | 12 | 60 |
Venn Diagrams
What is a Venn diagram?
Venn diagrams allow us to show two (or more) characteristics of a situation where there is overlap between the characteristics
For example, students in a sixth form college can study biology or chemistry
but there may be students who study both
or students who study neither
How do I interpret a Venn diagram?
Each region in a Venn diagram represents a different part of the data

The numbers in the circle labelled 'A' tell us how many items belong to 'set A' in the data
For example this might be the members of a sports club who like Archery
The diagram tells us that there are 12+4=16 members who like archery
The numbers in the circle labelled 'B' tell us how many items belong to 'set B' in the data
For example this might be the members of a sports club who like Badminton
The diagram tells us that there are 4+21=25 members who like badminton
The region where the two circles overlap tell us how many items are in set A and set B
So this would be members of the club who like Archery and Badminton
The diagram tells us that there are 4 of these
The two circles together tell us how many items are in set A or set B
So this would be members of the club who like Archery or Badminton
The diagram tells us that there are 12+4+21=37 of these
Note that 'set A or set B' includes items that are in both sets
The area outside the two circles tells us how many items are not in set A and not in set B
This would be the members of the club who don't like Archery and don't like Badminton
The '8' tells us that there are 8 of these
The rectangle around the diagram refers to the entire data set
So there are a total of 12+4+21+8=45 members in the sports club
Occasionally, the numbers in the Venn diagram are not numbers of things or people, etc.
For example, the numbers might be percentages
In this case all the numbers in the Venn diagram must add up to 100%
Or the numbers might be probabilities
In this case all the numbers in the Venn diagram must add up to 1
How do I draw a Venn diagram?
Start with a rectangle and overlapping circles
the number of circles needed will depend on how many characteristics you are dealing with
it will usually be 2 or 3
To fill in the regions of your Venn diagram:
Work through each sentence/piece of information given in the question
Pieces of information may have to be combined before you can enter a value into the diagram
Not all values will be given directly
some may need working out
Remember to consider the words and and or
Examiner Tips and Tricks
Make sure that the numbers in your Venn diagram add up to the total number of items in the data set
If they don't then there is a mistake somewhere!
Don't forget to draw the rectangle
This is an essential part of a Venn diagram
Worked Example
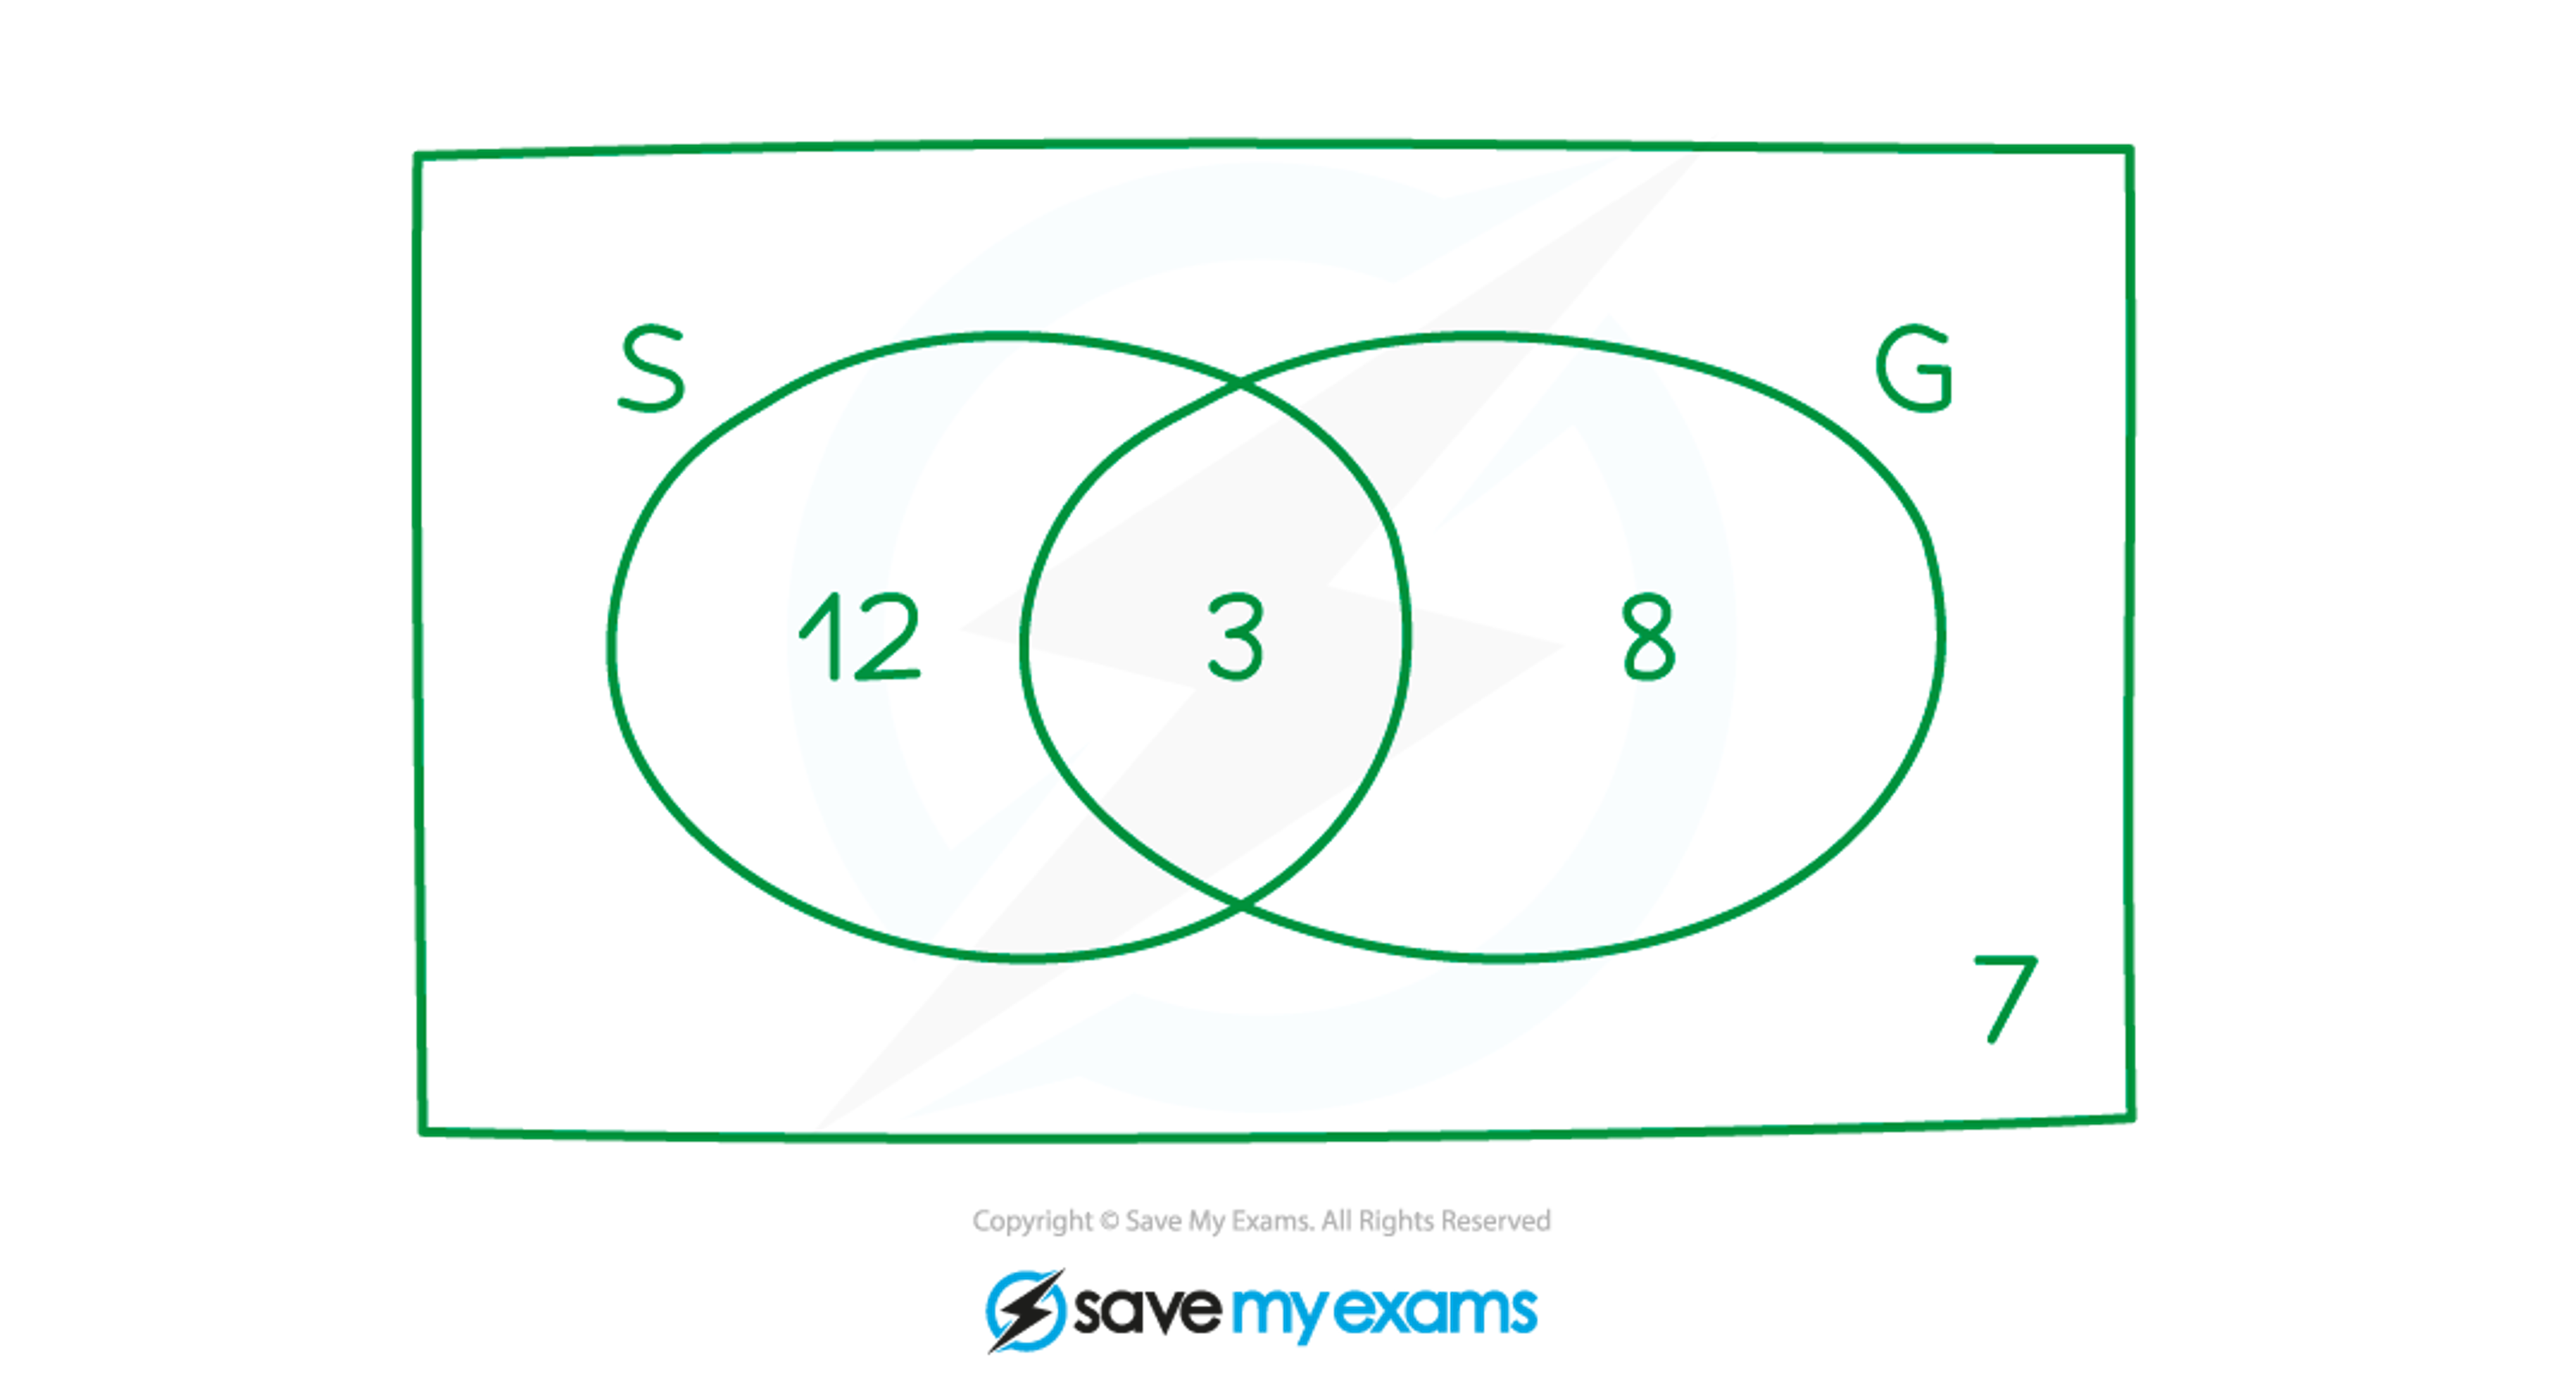
In a class of 30 students, 15 students study Spanish, and 3 of the Spanish students also study German. 7 students study neither Spanish nor German.
Draw a Venn diagram to show this information.
Start with a 3 in the overlap - this is the students who study Spanish and German
Of the 15 students who study Spanish, 3 also study German
So 15-3=12 study only Spanish
This number goes in the 'S' circle outside the overlap
7 students study neither language
So a '7' needs to go outside both circles but inside the rectangle
Finally, we know there are 30 students in total
So all the numbers in the diagram must add up to 30
The numbers used so far add up to 12+3+7=22
So there must be 30-22=8 students in the 'German only' part of the G circle

You've read 0 of your 5 free revision notes this week
Sign up now. It’s free!
Did this page help you?
