Probabilities & Data (Edexcel GCSE Statistics): Revision Note
Exam code: 1ST0
The Probability Scale & Basic Probabilities
What is the probability scale?
Probability describes the likelihood of something happening
In real-life you might use words such as impossible, unlikely and certain
In maths we use the probability scale to describe probability
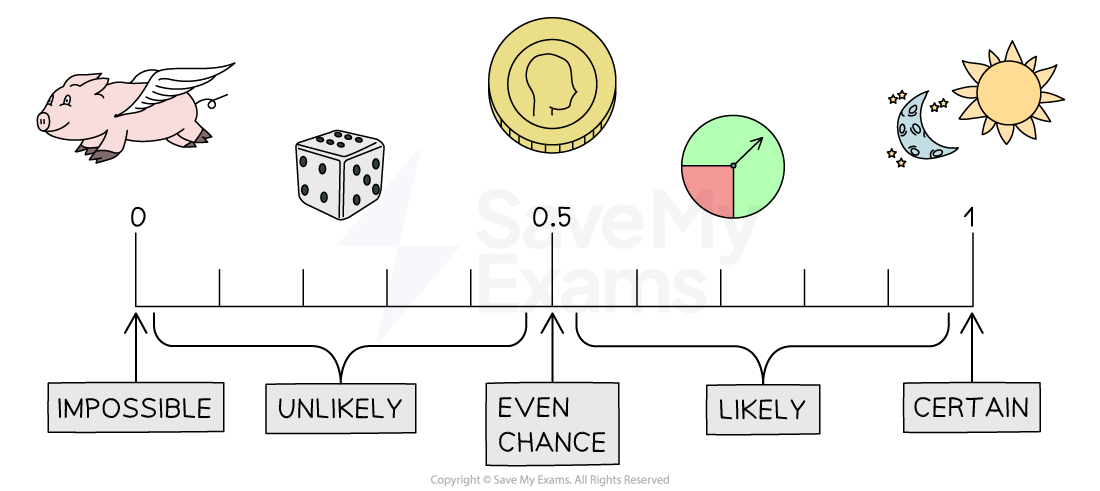
On the probability scale likelihood is measured by a number between 0 and 1
0 means impossible (i.e. it will never happen)
a pig will grow wings and fly
Between 0 and 0.5 means unlikely
getting a '6' when you roll a fair 6-sided dice
getting a '6' when you choose a number between one and a million at random can be described as very unlikely
0.5 means even chance (i.e. it happens 50% of the time)
getting 'heads' when you flip a fair coin
Between 0.5 and 1 means likely
a spinner that is three quarters green landing on green
not getting a '6' when you choose a number between one and a million at random can be described as very likely
1 means certain (i.e. it will always happen)
the sun will rise tomorrow morning
Probabilities can be given as fractions, decimals or percentages

How do I calculate basic probabilities?
An outcome is a single possible result of a trial
For example:
a dice lands on 6
a dice lands on 5
If all possible outcomes are equally likely then the probability for each outcome is the same
The probability for each outcome is
If there are 50 marbles in a bag then the probability of selecting a specific one is
An event is an outcome or a collection of outcomes
For example:
a dice lands on a six (one outcome)
a dice lands on an even number (a collection of outcomes)
Events can be referred to by capital letters
e.g. event A might be 'a dice lands on an odd number'
The probability of event A occurring can be written as P(A)
If all possible outcomes are equally likely then the probability of an event can be calculated by dividing the number of 'successful' outcomes by the total number of possible outcomes
A 'successful' outcome is an outcome belonging to the event
e.g. for the event 'a dice lands on an even number'
'2', '4' and '6' are all successful outcomes
If there are 50 marbles in a bag and 20 are blue, then the probability of selecting a blue marble is
The probability of selecting a particular blue marble is still
A probability worked out this way is sometimes known as a theoretical probability
The word 'fair' is used to indicate equally likely outcomes
e.g. for tossing a fair coin, heads and tails are equally likely
or for rolling a fair dice, each number on the dice is equally likely
Examiner Tips and Tricks
If you are not told in the question how to leave your answer, then fractions are best for probabilities
Worked Example
Mark the following on a probability scale:
A: All of your numbers will come up on a lottery draw
B: A randomly chosen day of the year falls on a weekend
C: A randomly selected UK adult owns a mobile phone
'A' is extremely unlikely, so mark that event on the scale close to zero
'B' is unlikely (most days are weekdays), but not as unlikely as 'A'
So mark that event closer to 0.5 than 'A'
'C' is very likely (most UK adults own mobile phones). so mark that event on the scale close to one

Worked Example
Jovan is rolling a fair 12-sided dice, on which the faces are labelled with the numbers between 1 and 12.
Find the probability that the dice:
(a) lands on a '7'
The dice is fair, so each outcome is equally likely
There are 12 possible outcomes, and only 1 of them is a '7'
(b) lands on an odd number
There are 6 odd numbers between 1 and 12: 1, 3, 5, 7, 9, 11
There are 12 possible outcomes
The question didn't say you had to simplify the answer
So would also get the marks here
(c) lands on a prime number.
There are 5 prime numbers between 1 and 12: 2, 3, 5, 7, 11
(Remember that 1 is not prime)
There are 12 possible outcomes
Expected Frequency
What is expected frequency?
Expected frequency refers to the number of times you would expect a particular event to occur
It is found by multiplying the probability of the event by the number of trials
e.g. if you flip a fair coin 100 times
you would expect 0.5 × 100 = 50 heads
Examiner Tips and Tricks
Exam questions will not necessarily use the phrase "expected frequency", but might ask how many you "would expect".
Worked Example
There are 6 blue, 4 red and 5 yellow counters in a bag.
One counter is drawn at random and its colour noted.
The counter is then returned to the bag.
(a) Find the probability that a counter drawn from the bag is yellow.
There are 5 yellow counters out of a total of 6 + 4 + 5 = 15 counters in the bag
would also get the marks here
(b) How many times would you expect a yellow counter to be drawn, if this experiment is repeated 300 times?
'Expect' tells us this is an expected frequency question
So multiply the number of trials (300) by the probability from part (a)
I would expect a yellow counter to be drawn 100 times
Estimating Probabilities from Data
How can I estimate probabilities from data?
In the real world it can be difficult or impossible to find out the exact probability of an event occurring
By conducting an appropriate experiment we can estimate the probability
e.g. to estimate the probability of a chicken egg having two yolks
we can collect a sample of chicken eggs and see how many have two yolks
Each repeat of an experiment is called a trial
e.g. each chicken egg tested would count as one trial
if a particular egg has two yolks that would be a successful outcome
To find the estimated probability, divide the number of successful outcomes by the total number trials
A probability estimated in this way is known as an experimental probability or relative frequency
How does the number of trials affect an estimated probability?
Using a larger number of trials will increase the reliability of an estimated probability
e.g. using a larger sample of eggs to check for double yolks
or rolling a dice a larger number of times to estimate the true probability of getting a 6
In general
the experimental probability will tend towards the true probability
as the number of trials is increased
For example, it is unlikely that you will get exactly 5 heads if you flip a fair coin 10 times
But the more and more times you flip it
the closer to 50% the total number of heads will tend to become
How can I make predictions using estimated probabilities?
You can use an estimated probability to calculate an expected frequency
e.g. if you flip a biased coin 40 times and get 10 heads, how many heads would you expect when flipping 100 times?
The estimated probability is
= 0.25 from the first 40 flips
0.25 × 100 = 25, so you would expect to get heads 25 times from 100 throws
It is possible that you will be asked to make predictions based on a relative frequency diagram
This is a type of bar chart that has relative frequencies instead of frequencies on the vertical axis
See the Worked Example
Examiner Tips and Tricks
If you are asked to choose the best estimate
choose the one based on the most trials
Worked Example
There is a large but unknown number of different coloured buttons in a bag.
Johann selects a button at random, notes its colour and replaces the button in the bag.
(a) Johann repeats this 30 times, and records his results in the following table
Colour | blue | red | purple | green | yellow |
|---|---|---|---|---|---|
Frequency | 10 | 9 | 5 | 4 | 2 |
Use Johann’s results to estimate the probability that a button drawn at random from the bag is red.
Taking ‘red’ to be a 'successful outcome', Johann had 9 successes out of a total of 30 trials
would also get the marks here
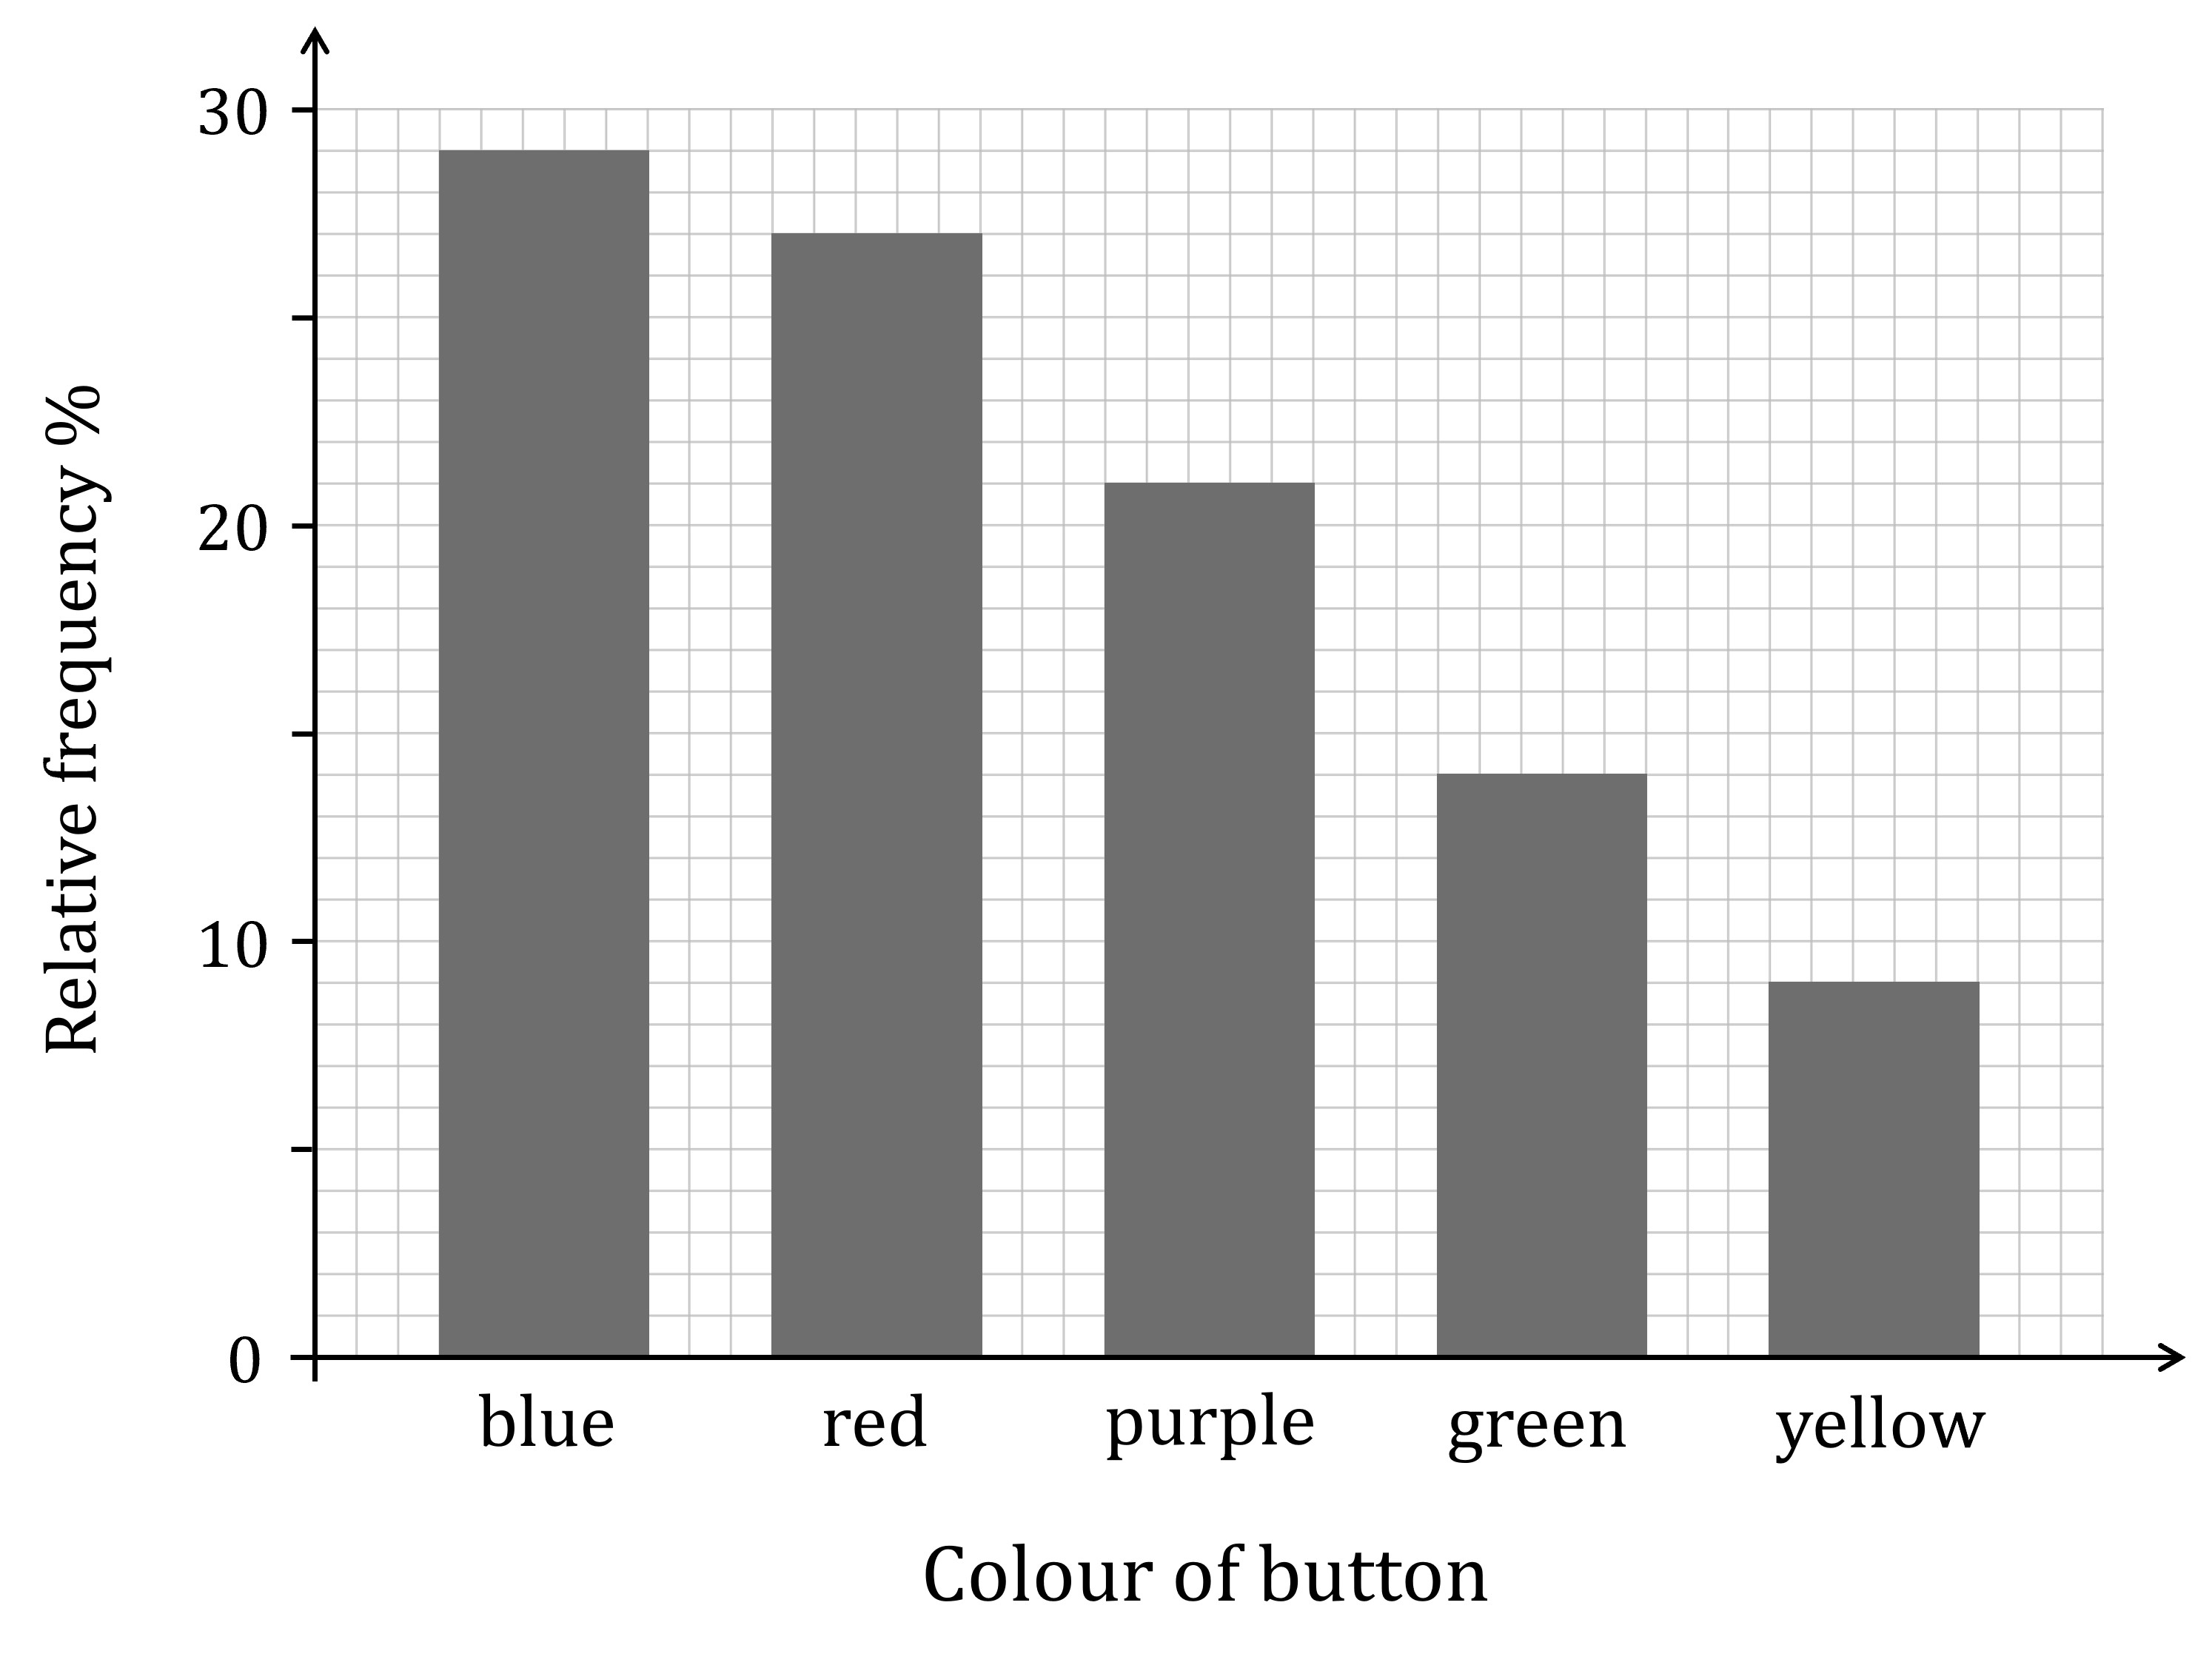
Johann repeats his experiment a large number of times and calculates the experimental probabilities for all the different coloured buttons that he draws from the bag.
He presents this data on the following relative frequency diagram:

(b) Use the diagram to find the expected number of times that Johann would get a green button if he repeated his experiment another 50 times.
The estimated probabilities from Johann's experiment can be read off the diagram
The estimated probability for green is 14%, which is the same as a probability of 0.14
Multiply that by the number of trials (50) to get the expected frequency
7 times

Unlock more, it's free!
Did this page help you?