The Distribution & Abundance of Organisms (OCR GCSE Combined Science A (Gateway)): Revision Note
Exam code: J250
Ecological Field Investigations
Field work
Trends in ecology can be spotted by measuring the numbers and species of organisms in an ecosystem and how these change over time
Knowledge of these trends can inform humans about how to take the best care of the land, lakes, rivers and oceans
However, a typical ecosystem is a big place and we cannot count every single organism in it
In order to have an idea of how many organisms occupy a particular ecosystem, we have to make sensible estimates, based on thorough sampling methods
The idea is that a well-selected sample can be scaled up to give an accurate estimate of the whole population
Field work involves scientists getting outside and carrying out work to sample and measure various aspects of ecosystems
Abundance is the number of organisms of a particular species in a habitat
Distribution is the geographical spread of a species
A field investigation into the distribution and abundance of organisms in a habitat
Aim: To measure the population size of a common plant species in a habitat and use sampling techniques to investigate the effect of a factor on the distribution of this species
Methods:
Use a quadrat to estimate the population size of a plant species in a survey area
Use a transect line and a quadrat to investigate the effect of a factor on the number of plants in a survey area
Scientists can't put a quadrat on every single 50 cm × 50 cm patch of ground
That would be very time-consuming and tedious work
So a reliable sampling technique is required
Essentially, parts of the population are counted, so sampling has to be done in a completely random manner
The number of organisms in the sample is multiplied up to give a population size estimate
Data can also be gathered on the distribution of species within the sampling area
This may be due to abiotic or biotic factors which can also be investigated
Random sampling
Scientists must go to great lengths to ensure that sampling is random and free from bias
For example, in a quadrat study looking at thistle plant distribution in a field, scientists must not just focus on the areas where thistles are seen to be growing
There may be valuable data about why thistles are not growing in a certain part of the field e.g. soil conditions are unfavourable
Quadrat studies must use random number generators to identify co-ordinates within a marked-out area for quadrats to be analysed


Estimating Population Size Method
Stratified sampling is also useful
Divide a habitat into zones which appear to have different communities and take samples from each zone
For example, if vegetation cover in an area of moorland is 70% heather and 30% grass, take 70% of the samples from within the heather and 30% of the samples from within the grass
Systematic sampling is used e.g. with transects
Systematic sampling is used where the study area includes an environmental gradient (change of conditions across the study area)
For example, samples taken, every 10 meters along a line running from the sea shore, inland across a sand dune system
Sampling mobile organisms (most animals) presents risks of missing certain individuals or double-counting others
A technique called capture-recapture is employed in these cases
Sampling the abiotic environment is also required to be random
e.g. taking water samples from the right place in a stream/river system, rather than from the place that might be easiest to reach (the water)
Pooters, Pitfalls, Nets & Kick Sampling
Capturing live animals can present its challenges
Scientists should adopt ethical practices at all time, employing a 'do no harm' approach to field work
This requires animals species to be captured alive wherever possible and released back into the same habitat directly after being assessed
The most common types of animal to be captured are invertebrates because they present a low risk to the scientist and are relatively abundant
Larger, more dangerous animals require professional assistance for sampling
e.g. gathering data on lion populations in a game reserve may require a ranger trained in the use of tranquiliser darts
The following techniques can be used to capture invertebrates:
Pooters
A small, hand-held suction device that can capture small invertebrates like flies, spiders etc
The scientists sucks on one tube and 'vacuums' up the creature with the other tube
The suction pulls the creature into the pooter chamber
A piece of gauze on the suction pipe prevents the operator sucking the animal into their mouth

A pooter
Pitfall traps
These are dug in-situ within a habitat and left for 1-2 days to fill with invertebrates
A canopy is placed over them to prevent flooding by rainwater
Leaf litter is placed inside to provide some protection to smaller animals who may become prey to larger ones inside the trap
Organisms fall in but cannot climb out
So can be identified, counted and released quickly
The pitfall trap is refilled with soil after use and the canopy removed

A pitfall trap
Nets
Sweep nets are large, hand-held nets that can be swept across a tree's leaves to capture the invertebrates in that tree
These must be used free of bias and in a systematic and safe way
e.g. Sweep the tree for 10 seconds at 2 metre height and 10 seconds at 4 metre height etc.
The invertebrates are collected, counted then returned to the approximate same location
Kick sampling of streams
A scientist can stand in a stream and use their feet to agitate the stream bed
This must be done gently to release invertebrates whilst avoiding damage to them
A net is placed immediately downstream to catch the organisms that are disturbed
The net's contents are transferred to a water-filled tray for identification/counting of the organisms
All the tray's contents are tipped straight back into the stream as soon as possible after data has been gathered

Kick sampling a stream bed
Examiner Tips and Tricks
Remember the two main considerations for scientists doing this kind of work:
That the work is done ethically
That sampling is done randomly and free from bias
Quadrats, Transects & Capture-Recapture
Quadrats & transects
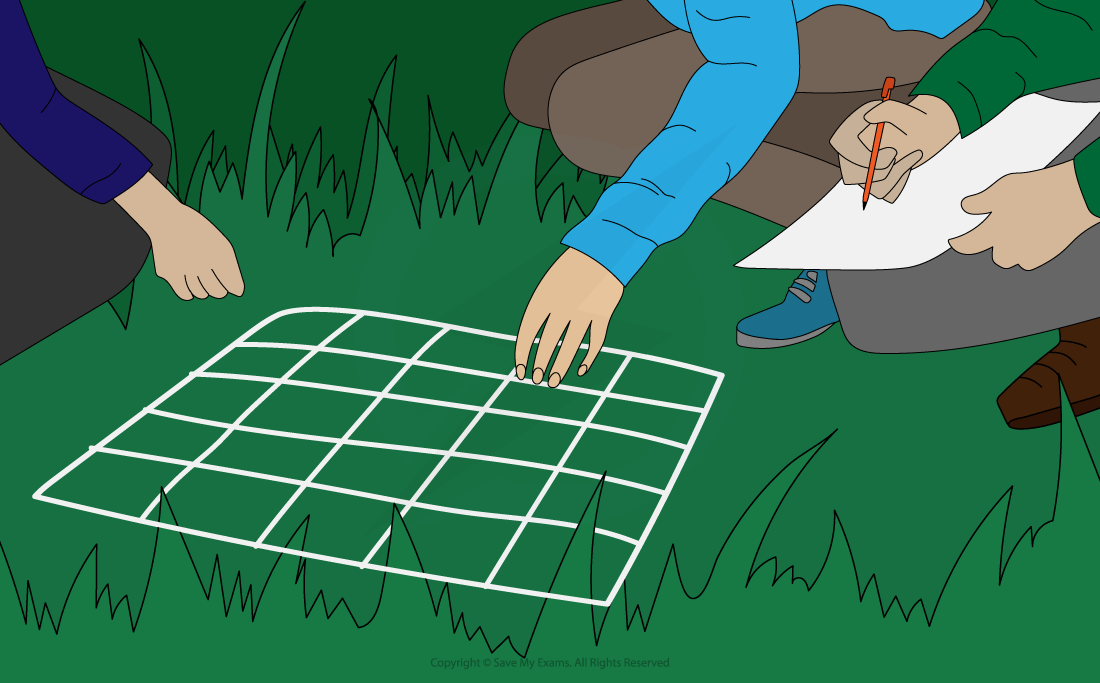
Quadrats are square frames made of wood or wire
They can be a variety of sizes e.g. 0.25m2 or 1m2
They are placed on the ground and the organisms within them are recorded
Plants species are commonly studied using quadrats to estimate the abundance

Using a quadrat to investigate population size or distribution
Quadrats can be used to measure abundance by recording
The number of an individual species: the total number of individuals of a single species (eg. buttercups) is recorded
Species richness: the total number of different species (but not the number of individuals of each species) is recorded
Percentage cover: the approximate percentage of the quadrat area in which an individual species is found is recorded (this method is used when it is difficult to count individuals of the plant species being recorded e.g. grass or moss

How to estimate percentage cover of one or more species using a quadrat
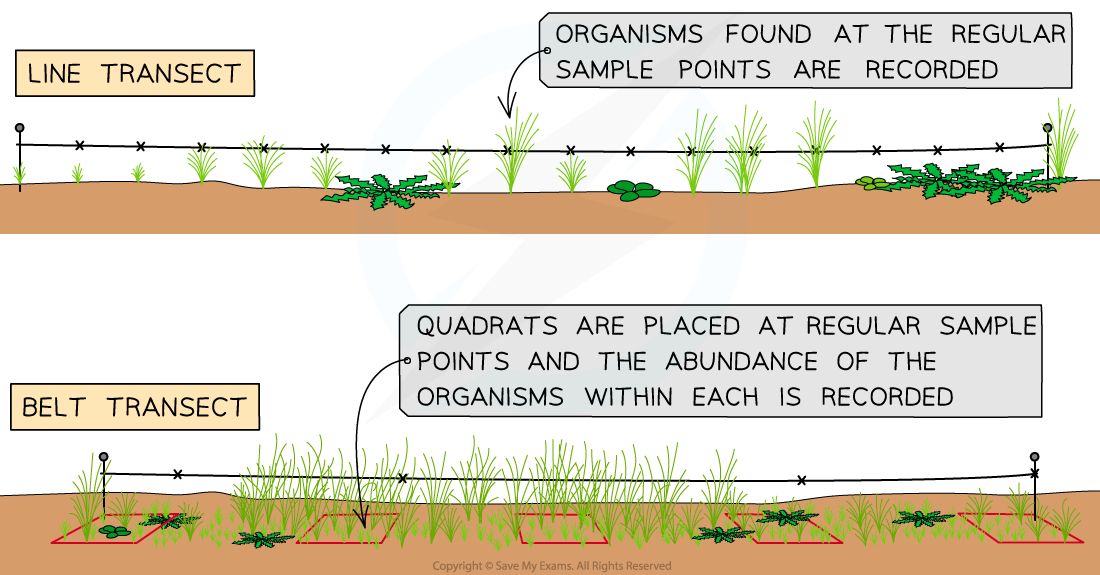
A transect is a row of quadrats or points placed in a line at pre-set intervals
Transects are useful for measuring the change in distribution of organisms across a area known to differ in abiotic factors
e.g. down a hillside where altitude changes
Across a beach and sand dune system and into mature woodland

Example of a belt transect setup
Capture - recapture
This technique is used for estimating the population size of mobile organisms
To avoid the risk of double-counting because organisms move about
Capture/collect a sample (of named species), mark them and release
Method of marking must not harm the organism OR make the organisms more visible to predators
(Release and) leave sufficient time for the (marked) organisms to (randomly) distribute around their habitat before collecting a second sample from the same area
Worked Example
Estimating the population size using capture-recapture
In a capture-recapture study, scientists were attempting to estimate the population of banded snails in a meadow habitat
On Day 1, 54 snails were collected in a 30-minute period and marked with a small band of non-toxic white paint on their shells
They were then released back into their habitat
The following day, 48 snails were captured, 9 of which were ones that had been marked the day before
Estimate the population of the yellow banded snails in the meadow habitat. You can assume that no snails entered or left the meadow, and no snails were born or died during the study.
Answer:
Population estimate = 288 snails
Examiner Tips and Tricks
Remember that all these population counting techniques only provide estimates of the population. Estimates like these are generally acceptable if the sampling techniques used have been sufficiently random.
Identification Keys
Identification of species
When sampling a habitat, a scientist is unlikely to know exactly which species is which
To help with the field work, identification keys are used
These ask a series of Yes/No questions which lead the scientist through a flowchart towards a positive identification
A good identification key for use in the field will contain detailed images/photos of various species
Because all the questions are Yes/No or only have only two possible answers, they are sometimes called dichotomous identification keys
Questions can include these examples
Are the leaves oval-shaped? (Yes/No)
Does the leaf have a sharp tip (Yes/No)
Does the animal have 6 or 8 legs?
Is the skin covered in scales or a shell?
An Example of an Identification Key

Measurement of Abiotic Factors
An important part of field work is to measure abiotic factors in a habitat
Because abiotic factors can easily change, they may be causing the populations of species to change
The types of abiotic factors routinely measured in field work include
Light intensity
Using a light meter/light sensor
Temperature (and range)
Using a thermometer or temperature probe
Soil moisture
This can be measured in-situ with a probe or a sample can be taken and analysed in the lab
Soil or water pH
With a pH probe or indicator solutions
Turbidity (cloudiness) of water
By measuring the maximum depth of water through which a black 'X' shape can be seen
Dissolved oxygen in water
Using an oxygen meter
Wind speed/direction
Using an anemometer
Pollutant levels
Using various analytical methods, depending on the pollutant

Unlock more, it's free!
Did this page help you?