A student does an experiment with radioactive materials.
He investigates how the activity of radiation changes with distance.
In the experiment, the radiation moves from the radioactive source to a detector.
He measures the counts per minute at the detector.

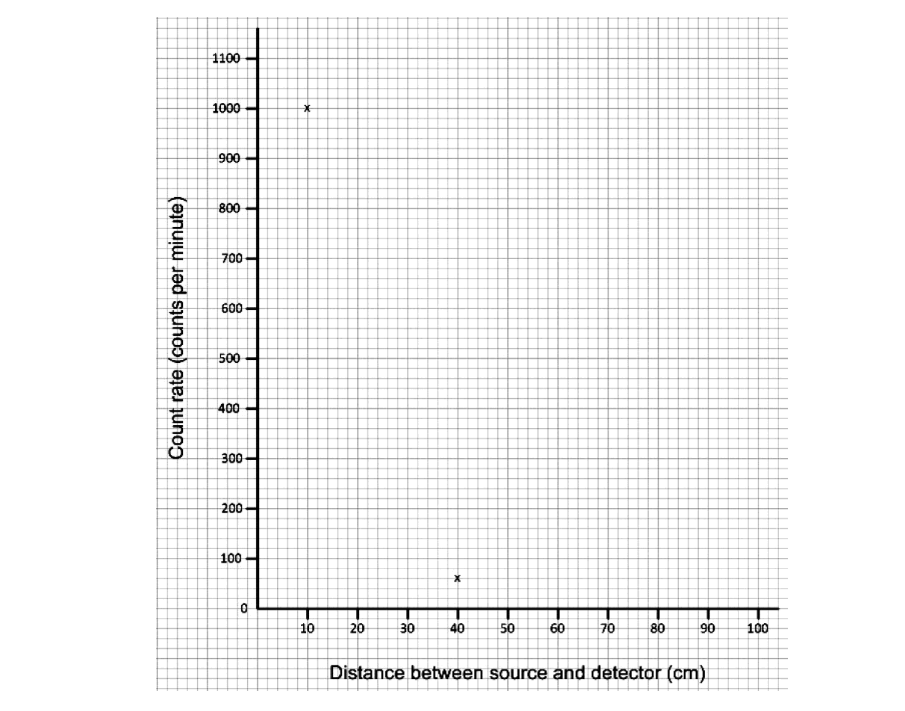
The table shows the results.
Distance between source and detector (cm) | Count rate (counts per minute) |
10 | 1000 |
20 | 240 |
40 | 60 |
80 | 20 |
The student could not take an accurate reading at 0 cm.
Suggest a reason why.
i) Plot the results on the graph below.
Two points for 10 cm and 40 cm have been plotted for you.
Join the points with a smooth curve.
[2]
ii) Use the graph to estimate the count rate at 30 cm.
Answer = ......................... counts per minute [1]
Higher Tier Only
i) What pattern is shown by the results as the distance is increased from 20 to 40 cm?
[2]
ii) The student wants to find the count rate at 5 cm.
Estimate the count rate at a distance of 5 cm.
Answer = .......................... counts per minute [1]
The student considers the risks of doing experiments with radioactive sources.
He does experiments with two radioactive sources, A and B.
He writes down his conclusions about the sources in the table below.
Radioactive material | State | Distance from source | Irradiation risk | Contamination risk |
A | solid | 1 m | high | none |
A | solid | 4 m | low | none |
B | gas | 1 m | very high | high |
B | gas | 4 m | high | high |
Describe the difference in the risks for irradiation and contamination for A and B.
Was this exam question helpful?

