Sankey Diagrams & Efficiency (WJEC GCSE Physics): Revision Note
Exam code: 3420
Sankey Diagrams
The efficiency of a system is a measure of the amount of wasted energy in an energy transfer
Efficiency is defined as:
The ratio of the useful power or energy output from a system to its total power or energy input
If a system has high efficiency, this means most of the energy transferred is useful
If a system has low efficiency, this means most of the energy transferred is wasted
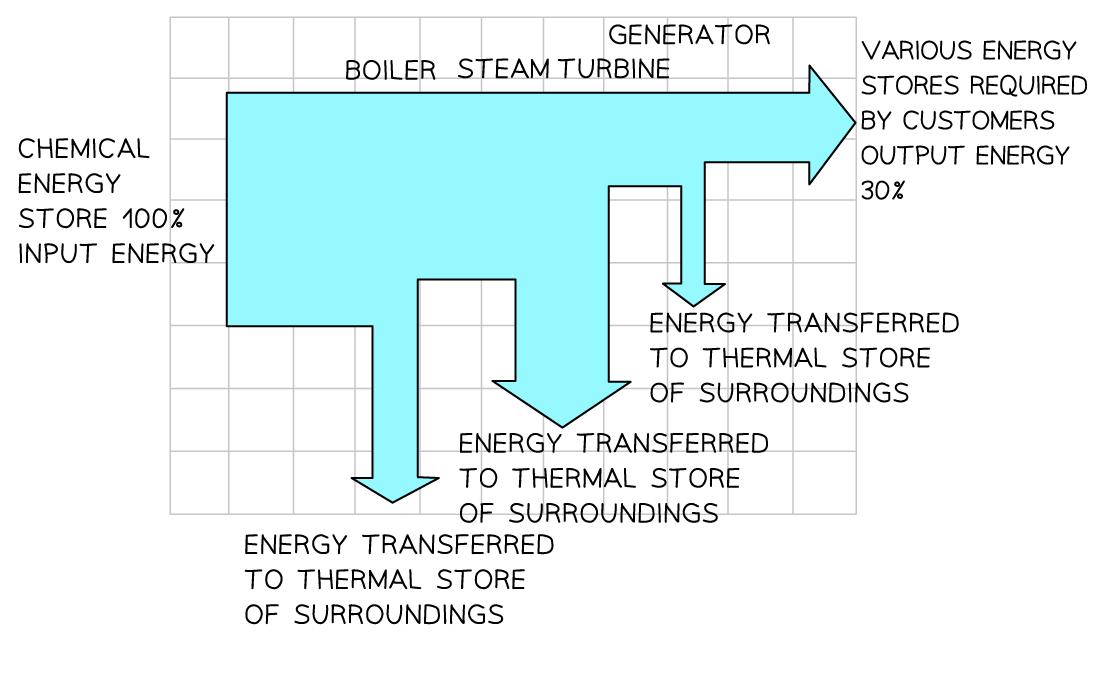
The overall efficiency of a typical thermal power station is approximately 30%
This means that 70% is wasted energy
At each stage of the electricity production process, energy is dissipated to the surroundings
Sankey diagrams are often used to show the efficiency of energy transfers
Sankey Diagram for a Gas-fired Power Station

Sankey diagrams show the efficiency of a system
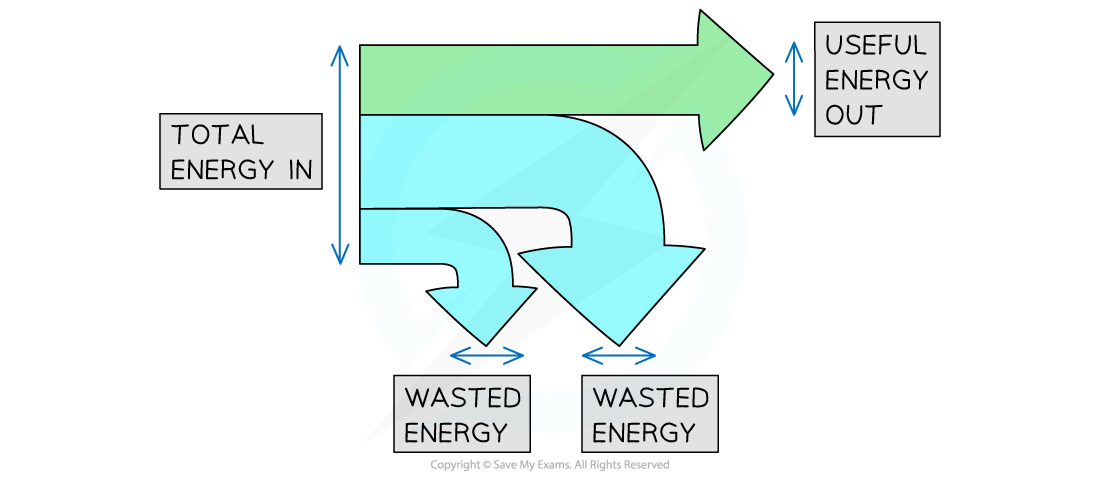
Key features of Sankey diagrams:
The width of the arrows represents the amount of energy
The flat end of the arrow represents the total energy input
The downward arrows represent wasted energy output
The horizontal arrows represent the useful energy output
Energy Distribution in a Sankey Diagram

Total energy input, useful and wasted energy outputs on a Sankey diagram
Worked Example
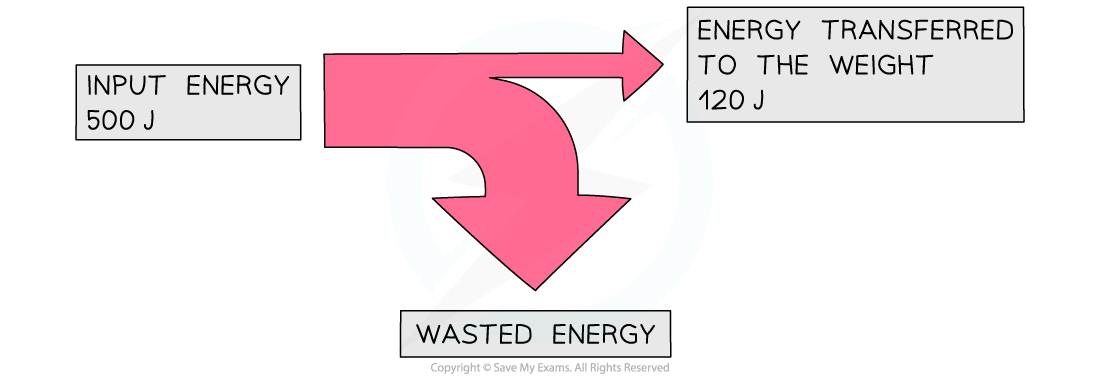
An electric motor is used to lift a weight. The diagram represents the energy transfers in the system.

Calculate the amount of wasted energy.
Answer:
Step 1: State the conservation of energy equation
total energy input = useful energy output + wasted energy output
Step 2: Rearrange the equation for the wasted energy
wasted energy = total energy in – useful energy out
Step 3: Substitute the values from the diagram
wasted energy = 500 – 120
wasted energy = 380 J
Efficiency
Efficiency is represented as a percentage, and can be calculated using the equation:
The efficiency equation can also be written in terms of power:
Where power is defined as the energy transferred per unit of time
Worked Example
Some energy values for a gas-fired thermal power station are listed below.
Input energy = 20 000 kJ
Heat energy = 13 500 kJ
Electrical energy = 6500 kJ
Use this information and the equation below to calculate the % efficiency of the power station.
Answer:
Step 1: State the known quantities
Useful energy transferred = electrical energy = 6500 kJ
Total energy supplied = input energy = 20 000 kJ
The heat energy is the wasted energy, but this is not required for the calculation
Step 2: Write out the equation
Step 3: Substitute the known values
Examiner Tips and Tricks
Usually in a calculation, you would convert the kJ to J before you input any numbers. However, in a ratio calculation like this, the units cancel out, so you don't need to do it. If you did convert the units to joules, you would still get the same answer, and therefore you would still gain full marks. It would just take you slightly longer to complete the calculation, so this is a good short cut if you feel confident with your maths skills. You will never lose marks for doing conversions (correctly!) when you don't need to, but you will lose marks if need to do a conversion and you don't do it. So if in doubt, always do the conversion.

Unlock more, it's free!
Did this page help you?