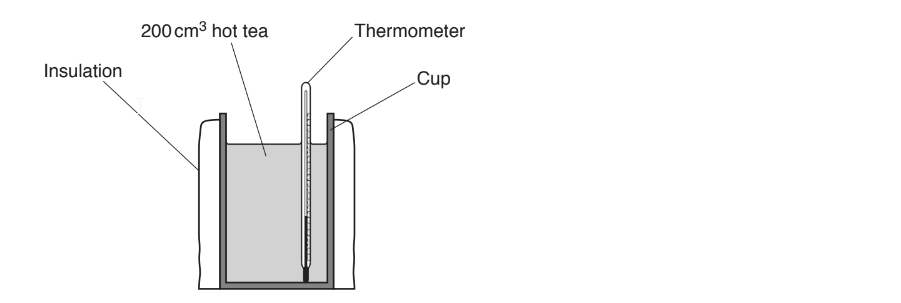
A student investigates how the thickness of insulation affects the cooling of a cup of tea.
Fig. 16.1 is a diagram of her apparatus.

Fig. 16.1
The student wraps a layer of insulation around a cup containing 200 cm3 of hot tea.
She measures the temperature of the tea at the start of the experiment and after 10 minutes.
She repeats the experiment with different thicknesses of the insulation.
Table 16.1 shows her results.
Thickness of the insulation (mm) | Temperature of tea (°C) | ||
Start | End | Difference | |
2 | 90 | 65 | 25 |
4 | 88 | 66 | 22 |
6 | 91 | 72 | 19 |
8 | 89 | 73 | 16 |
10 | 98 | 84 | 14 |
12 | 100 | 60 |
|
Table 16.1
i) Calculate the temperature difference when the thickness of insulation is 12 mm.
Temperature difference = ................................°C [1]
ii) The result when the thickness of the insulation is 12 mm is anomalous.
Suggest a reason why this result appears to be anomalous.
[1]
Plot a graph of the results in Table 16.1 and draw a line of best fit.
Ignore the anomalous result for 12 mm.

Describe how the temperature difference is affected as the thickness of the insulation increases.
Suggest how the thickness of the insulation affects the rate of cooling of the tea.
This experiment could be improved.
Describe two different ways of improving the experiment.
1 .......................................................................................................
2 .......................................................................................................
Did this page help you?
